Q
UALITY VARIATION
ANALYSIS AND
PRODUCTION APPLICATION
–
A
STUDY IN THE ROOT CAUSE OF VARIABILITY
Bachelor in mechanical engineering Product development - Improvement Salman Ahmad
I
Program: Maskiningenjörsprogrammet - Produkt utveckling
Swedish title: Kvalitets variations analys och Produktions anpassning English title: Quality variation analysis and Production application Publication year: 2019
Authors: Salman Ahmad
Supervisor: Sunil Kumar Lindström Ramamoorthy
Examiner: Henrik Ringsberg
Keywords: Variation, Quality, Robust workflow, Production, Standardization
II
Abstract
This study aims to research variation at a startup company and to understand what methods are necessary to root out and eliminate quality issues. The study is conducted at Biotech AB which is a producer of Bio-instruments as well as bio-ingredients that are produced on site for customers. The company has been concerned with the amount of variation in internal quality coming from the production and the purpose of this study is to find what is causing the variations and what preventative actions need to be taken. This study has been a mix between a quantitative and a qualitative study with its base being around the records of errors given through quality logs. Several interviews were made as well as observations in working procedures and working instructions. The results showed that five major issues were causing the most concern and unnecessary cycles in production, namely featured parts and human error also cause these variations. The interviews indicated that processes need to be managed better and faster due to the rapid pace of the company growth. They also indicate that the communication doesn't always work and needs to flow freely in both directions. The level of waste is quite high in forms of physical waste and time wasted due to cycles in production. Lean thinking needs to be implemented and 5s needs to be made aware of to give everyone a quality and waste-free working ethic from the ground up. Many of these issues could be solved by implementing a quality perspective by giving constant feedback according to TQM.
III
Sammanfattning
Denna studies syfte är att granska variationen i ett nystartat företag och att förstå vilka metoder är nödvändiga för att rota ut och eliminera kvalitets avvikelser. Studien har
genomförts på Biotech AB som är en tillverkare av Bio-instrument och även bio-ingredienser som produceras på plats åt forskande kunder. Företaget har varit bekymrade kring variationen i den interna kvalitén som kommer från produktionen och syftet med denna studie är
undersöka varifrån dessa variationer uppstår och hur man kan gå tillväga för att bli kvitt dessa. Denna studie är en blandning mellan en kvalitativ och kvantitativ studie och har sin utgångspunkt kring felen som har loggats av kvalitetsavdelningen. Intervjuer och observation har också använts som hjälpmedel för att undersöka arbetsmetodik och arbetsinstruktioner. Resultaten indikerar på att fem fel stod för majoriteten av de totala felen och orsakar mest oro och cykler i produktionen nämligen viktiga komponenter och mänskliga faktorn. Intervjuerna indikerar på att processer behöver skötas bättre och snabbare för att hänga med företagets fortskridande takt. De indikerar också på att kommunikationen inte alltid fungerar och behöver flöda fritt i både riktningar. Mängden av slöseri i form av fysiska produkter och tid kopplade till cykler i produktionen är relativt hög och behöver ses över. Genom att
implementera Lean tänkande genom produktionen och införa 5s i arbetsrutinen kan man få ett gynnsamt utfall och ge alla involverade ett kvalitetstänk och minska slöseri. Många av
felfaktorerna kan lösas genom att ge all involverade ett kvalitetstänk genom kontinuerlig uppföljning såsom i TQM.
IV
Acknowledgement
I would like to thank Biotech for giving me the opportunity to conduct this study, S and K for their support and supplying all the information required, and the production and quality team for their support and problem-solving mentality. I have had an interest in quality for a long time and, as it almost always is intertwined with production, I always felt comfortable in this kind of work environment. One of the best I have encountered so far was at this company where one can feel the energy and support of the active work environment. I hope this study can lead the department further towards perfection.
Finally, I would like to thank my instructor Sunil Kumar Lindström Ramamoorthy, my family and friends that have supported me throughout this process.
Salman Ahmad
V
TABLE OF CONTENTS
INDEX OF FIGURES ... VII
1. INTRODUCTION ... 1
1.1 Background ... 1
1.2 Problem Description ... 2
1.3 Purpose and Research Questions ... 2
1.4 Limitations ... 3
2. THEORY ... 4
2.1 Quality Definition ... 4
2.1.1 Quality Management ... 4
2.1.2 Quality Management System ... 5
2.1.3 Total Quality Management ... 6
2.2 Processes ... 8
2.2.1 Process Management ... 9
2.2.2 Capability Maturity Model ... 10
2.3 Quality Process Improvement ... 11
2.3.1 Plan-Do-Check-Action - Cycle ... 12
2.3.2 Six Sigma ... 13
2.3.3 Lean management ... 13
2.3.4 Statistical process control ... 14
2.5 Cost of quality ... 14
2.5.2 Production quality ... 16
3. METHOD ... 17
3.1Methodological approach ... 17
3.2Collection and analysis of empirical data ... 18
3.2.1 Data Collection ... 18 3.2.2 Data Analysis ... 19 3.3Quality ... 19 3.3.1 Reliability ... 19 3.3.2 Validity ... 20 3.4 Ethical perspective ... 20 4. CASE STUDY ... 21
VI
5. RESULTS AND ANALYSIS ... 22
5.1 Quality variation analysis ... 22
5.2 Manufacturing Variation Analysis ... 25
6. DISCUSSION ... 27
6.1 Practical implications... 28
6.2 Further research suggestions ... 29
7. CONCLUSIONS ... 30
APPENDICES ... 33
Interview 1 – Logistics ... 33
Interview 2 – Quality department ... 34
Attachment 1 Amount of faults ... 35
Attachment 2 Approval rate ... 36
Attachment 3 Pareto distribution ... 37
-VII
INDEX OF FIGURES
Figure 1 - Model of ISO 9001:2008 process map.(Bergman och Klefsjö, 2012) ... 6
Figure 2 - The eight building blocks of TQM. (P.N. Mukherjee, 2006) ... 7
Figure 3 - Capability maturity model. (Bergman och Klefsjö, 2012) ... 10
Figure 4 - PDCA-cycle for continuous improvement. (Mihaela L. Kelleman, 2003) ... 12
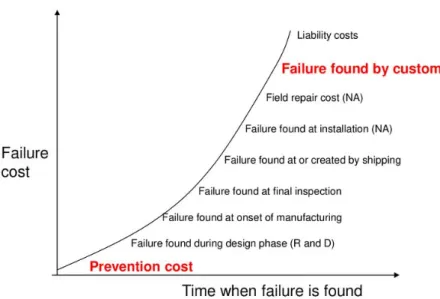
Figure 5 - Increase in failure costs. (Donna C.S. Summers, 2011) ... 15
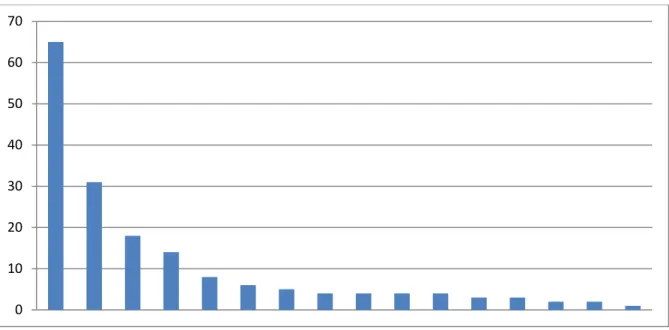
Figure 6 - Assembly 1 - Error graph. ... 22
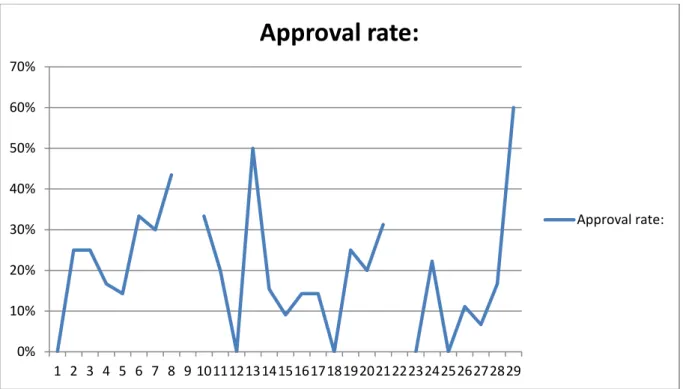
Figure 7 - Weekly approval rate graph of the main assembly during a 28 week period. ... 23
Figure 8 - Assembly 2 internal errors - Total amount of error graph. ... - 35 -
Figure 9 - Main assembly internal errors - Total amount of error graph. ... - 35 -
Figure 10 - Weekly approval rate: Assembly 1 ... - 36 -
Figure 11 - Weekly approval rate: Assembly 2 ... - 36 -
Figure 12 - Pareto distribution: Main assembly ... - 37 -
Figure 13 - Pareto distribution: Assembly 1 ... - 37 -
Figure 14 - Pareto distribution: Assembly 2 ... - 37 -
1
1. INTRODUCTION
1.1 Background
All companies go through different phases while establishing themselves and developing products on their way to the marketplace. Once they reach the market and there is a demand for the product that they offer, most companies aim to supply their customers with the best quality they can produce. This can be a challenge as there are many regulations and standards that certain companies must adhere to in order to be competitive. This study will be conducted at a company that has entered the marketplace and wishes to improve the internal quality and find out what factors are limiting them internally.
Biotech AB is the company that this study will be examining. This company deals with both research within biomaterials and the manufacturing of machines. It was founded through research done at Chalmers University and has grown massively till this day and now covers a range of different machines as well as analytical hardware. All together the company aims to give a researcher total freedom in exploration and discovery of new bio compositions along all stages of the process.
(*******.com)
This study will be based upon the quality of manufacturing in the main production facility of Biotech, in Gothenburg where its famed machines are produced. As many other products are to join the assembly line, the current issues need to be managed and dealt with. One of these issues is the fluctuation in internal quality which will be examined during this study. Processes have been set in motion to counteract this and documentation has been maintained. This study will examine and interpret this information to bring forth which issues create most variability and give suggestions on how to decrease it.
As the modern perspective revolves around process management, this report aims to localize which processes are lacking and need to be implemented. This is done in order to make sure that the solutions presented are to be permanent as well as applicable in all production facilities. In order to find out what is lacking, interviews and random sampling will be done with all affiliated parties.
2
1.2 Problem Description
As Biotech has grown, so has the demand for the machines with the capability of creating designs in various manners. This has led to expansion of the production as the company has procured additional space to meet the demand. In addition, they have expanded their workforce and added a quality management team to ensure that the customers' demands are met.
The demand for the machines that this company produces has grown. As expansion occurs, variations occur, and these variations should be limited in order to maintain high quality products and minimize the lead time for each product made. Variations occur due to many factors and these will be explored and analyzed in order to create robustness throughout the manufacturing facility. There have been fluctuations in internal quality which are being pursued by the production manager and quality manager. This report aims to assist them in stabilizing processes as well as create a quality-based workflow for future products that are to be produced in this facility.
Variation is existent in many forms of everyday life but is unique for every situation and as such for each company. Scientific articles are readily available, about process management, within most fields but often take a generalized view and problem-solving stance. To solve each variation, one must take a close look at the problem causing the variation and all actions connected to it to be able to get to the root of the issue.
1.3 Purpose and Research Questions
The purpose of this study is to investigate and illustrate how the internal quality at a growing organization could be improved and find the causes of variations in order to create a robust workflow as new products are introduced to the assembly.
To aid in this task the following questions will be researched upon:
• Which quality management systems are optimal for the given scale of manufacturing? • How is it possible to raise the standard of quality?
3
1.4 Limitations
In order to restrict the time period for which the data is analyzed, week 2-30 was chosen. This period roughly represents the first quarter of the year. The manufacturing facilities quality is the sole focus of this report so that we restrict the errors to this environment. As the company makes a large part of its revenue through one of their products we will focus on this product. The logistics department and the quality department are both processes that effect the production so they will be investigated in order to find limiting factors. Another limitation will be that the person that is conducting this study is an affiliate of the company.
4
2. THEORY
This chapter contains the theory behind the importance of quality and management systems that control and broaden the quality perspective.
2.1 Quality Definition
Quality can be defined in many ways whether it is "fitness for use" (Juran, 1974) or "conformance to requirements" (Crosby, 1979) this will always remain relative to the customer. Thus, it is important to focus on the quality from the view of the customer. A modern take on this definition that suits this perspective is stated as:
"The quality of a product is based on its ability to satisfy, and preferably to surpass, the expectations of the customers’ needs." (Bergman and Klefsjö, 2012).
2.1.1 Quality Management
In order to maintain structure and control in a manufacturing process it is essential to have a focus on the needs of the customer. This can be fulfilled by utilizing a focused team that oversees the quality of the product. As stated by (David Garvin, 1983) the following eight dimensions are identified:
• Performance - Refers to the primary operating characteristics of a physical good • Features - The added characteristics of a physical good
• Reliability - The probability of a good failing within a specified period
• Conformance - The degree to which a good design and its operating characteristics match pre-established standards
• Durability - The measure of a goods life
• Serviceability - The speed, courtesy and competence of the repair • Aesthetics - Refers to how the good looks, smells, feels and sounds like • Perceived image - Refers to the brand and reputation of the product
These dimensions may be based on subjective judgment and need to be standardized in order to be controlled sufficiently. (Kelemen, 2003)
5
2.1.2 Quality Management System
The main purpose of quality management systems is to assess how a company is performing regarding its goals, aspirations, processes and documented information. There are many quality standards out of which the ISO-9000 is the current globally established standard. This standard enables an organization to demonstrate to itself, its customers and to an independent certified body that it has put in place an effective managing system for its quality and products or services. Yet another benefit is the ability to claim quality certification for its products and to advertise with this fact, which is very advantageous on the global marketplace giving a company an upper hand compared with companies lacking this benefit. (Beckford, 2002)
The ISO-9000 defines quality system standards, based on the premise that certain generic characteristics of management practices can be standardized, and that a well-designed, well implemented and carefully managed quality system provides confidence that the outputs will meet customers' expectations and requirements. (Evans, 2005). To be able to fulfill this, the organization is required to establish structure, routines, processes and resources. All these should be fully documented to establish a base that can be audited and works as an instrument for improvement. This documentation works as a basis for daily work and should be used as a tool to be able to evaluate quality related issues. (Bergman et al., 2012)
ISO-9000 family consists of four quality standards: • ISO 9000:2005
• ISO 9001:2008 • ISO 9004:2009 • ISO 19011:2011
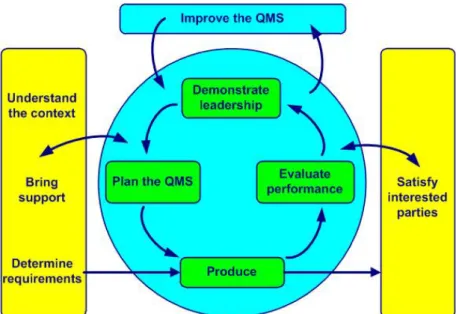
These standards work as guidance within the organization to be able to maintain quality, structure and sustainability in an explanatory manner. They all have individual focuses and specify demands on the company's management system but not on their product quality. ISO 9001 is the only standard that the company must adhere to in order to achieve the approval. This standard specifies to a structure that works towards continuously improving the management system, as demonstrated in figure 1. (Bergman et al., 2012)
6
Figure 1 - Model of ISO 9001:2008 process map.(Bergman et al., 2012)
2.1.3 Total Quality Management
Total Quality management (TQM) is one of the most prominent quality management systems that focus on involving all departments in a company to align the goals and visions into one. This has been successful and is considered to be the reformation of the quality perspective according to the Japanese, who used this concept to build up their industries and become competitive on the global market after being devastated during the second world war. (Evans, 2005) The goal is to focus on processes, as done through ISO-standards (which are also incorporated in this system), but also make sure that all individuals are involved and wholeheartedly focus on the company objectives. This leads to the unification of both the individuals and the company’s objectives that creates a situation where all employees can be proactive and involved in their work and able to achieve overall excellence. (Mukherjee, 2006)
Total Quality management can be defined as "an organized scientific approach towards continuous improvement of quality involving all parts of the organization, covering every function, aimed towards total customer satisfaction". In other words, the most important factor is pleasing the customer and ensuring that they get exactly what they pay for and remain loyal to the brand and their product. This can only be achieved by having consistency in product quality and by measuring all processes leading to the final customer and controlling them. (Mukherjee, 2006)
7
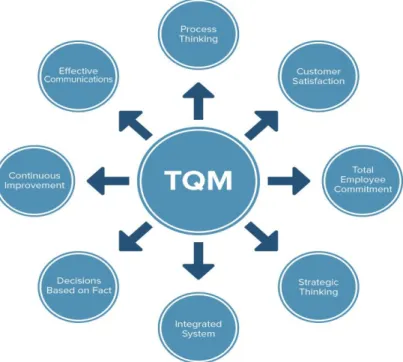
The primary factor that differentiates this management system from others is not only the broad perspective and continuous improvement that can sometimes be found in ISO-9000 but also the involvement of other industries in affiliation to the company. The mission is to allow and encourage affiliated companies to progress at the same pace as one's own company in order to grow side by side. Yet this is only one of the eight building blocks of TQM as depicted in figure 2. Another important factor that has allowed this system to be so successful is its focus on leadership by example. This creates a supportive culture and paves the way for performance excellence as ideas may flow freely. (Mukherjee, 2006)
Figure 2 - The eight building blocks of TQM. (Mukherjee, 2006)
The final point that is to be made regarding TQM is the focus on giving quality value. As time spent on fulfilling non-productive tasks during the workdays is a cost that is not going into increasing the value of the product for the customer, this must be regulated. Depending on the maturity of the quality system in place, the first step is to eliminate external failure by internal testing which may increase the internal cost but puts the faults further away from the customer. When this is completed one can easily locate the root cause of the errors and eliminate them as well as being able to deal with them promptly and finally eliminating most costs for failures. (Mukherjee, 2006) Once this is done the manager can focus on process simplification as this reduces the opportunities for errors and rework. This can be done by clear instructions and visual management. (Evans, 2005)
8
2.2 Processes
A process is defined as a network of activities that repeats itself over time which has the purpose of creating value for an internal or external customer. (Evans, 2005) The activities that are included are usually controlled by people with different expertise that work together in order to achieve the goals of an organization in different manners. Individuals or groups, known as process owners, are accountable for process performance and have authority to manage and improve their processes. (Evans, 2005) Thus processes are divided into three categories:
• Main process: The purpose of this process is to generate value for the external customer.
• Support process: Makes sure that the main process has all required resources and creates value for the internal customer.
• Leadership process: Has the purpose of making decisions regarding the organizations strategy and goals as well as improving other processes. This also creates value for the internal customers.
The purpose of this is not only to focus on specialization within each field but also to decrease the resources spent on each activity. Careful planning and plentiful resources are required for each process to be successful. They are commonly broken down into more specific areas dependent on the size of the organization. (Bergman et al., 2012)
Defining each process is important as each process is connected to another, especially within a manufacturing company, and will determine the efficiency of the total process. Process maps are usually made to aid this and give clarity to all involved. All processes should be monitored and recorded in order to be able to be analyzed and improved. (John Beckford, 2002
The modern focus is around process management that in term decreases the focus from "who does what” to “how results are produced". This is important because process owners are given better perspective on how to achieve a common vision based on the result. The process owners are also more responsible for managing variation within their field and with an over viewing perspective able to find the reasons for variability. Therefore, these variations can be eliminated, creating greater customer satisfaction. (Bergman et al., 2012)
9
2.2.1 Process Management
In order to control a process and continuously improve it, it is imperative to have a good process management system. This involves design, control and improvement - the key activities necessary to achieve a high level of performance in key value creation and support processes and identifying opportunities for improving quality and operational performance. (Evans, 2005) This has proven to be successful within the fields of product development, marketing, purchasing and many other fields. This can be done by dividing the duties of a manager in four steps (Bergman et al., 2012):
• Organize for improvements: Designate a process owner and a group to improve processes.
• Understand the process: Define boundaries and map the process by documentation to determine who are customers and providers.
• Observe the process: Determine testing points and routinely execute these. • Continuously improve the process: Use the information from the tests in order to
analyze and improve.
There are three important roles within process management, and they are process owner, process leader and competence provider according to TQM. The process owner is responsible for all the resources in the process and, through strategic leadership, should create a target, boundaries and framework for the operative work. (Evans, 2005) It is very important that the process owners’ field is well defined, if two process owners’ fields overlap one another it could lead to an internal power struggle. The process leader oversees the operative coordination and is required to take decisions in order to keep the workflow stable and is considered the process owners right hand. This person is also in charge of improving the process. The last and sometimes considered the most important role is the competence provider whose task is to make sure that the right competence is in the right position. This role is sometimes referred to as a coach. This is due to the possibility of giving the staff feedback as well as creating opportunities for them to better their abilities. (Bergman et al., 2012)
Well defined roles within an organization create a sense of responsibility and work as an unwritten law of action. Roles also define what competence a person has and contribute to a sustainable workflow but also contribute to a hierarchic management system. This is not always positive as they are connected to emotions, status and salary. (Bergman et al., 2012)
10
2.2.2 Capability Maturity Model
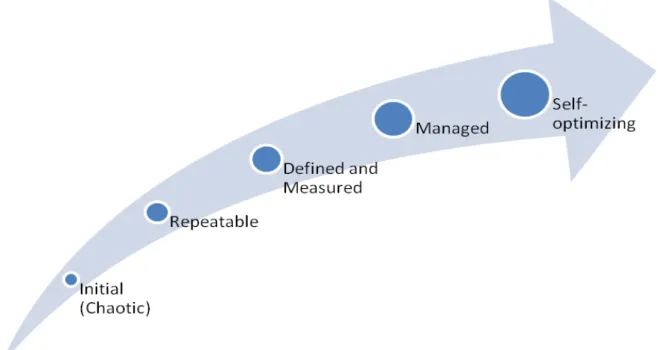
The Capability maturity model (CMM) was first introduced as a tool for software engineering process management but later has also been proven useful to analyze the process management levels within companies. (Bergman et al., 2012) It describes an evolutionary improvement path from ad hoc, inconsistently performed practices, to a mature, disciplined development of the knowledge, skills, and motivation of the workforce, just as the CMM describes an evolutionary improvement path for the software processes within an organization. (Hefley et al., 1995) It comprises of 5 levels leading to total optimization or maturity of a process.
Figure 3 - Capability maturity model. (Bergman et al., 2012)
• Level 1: Initial - On this level there is a lack of routines for development and a
company is dependent on the individuals’ skills and competence. Only a few processes are identified, and the main focus of the company would be to manage time schedules and budgets.
• Level 2: Repeatable - Processes are starting to be defined but the advancement is based on earlier experience. There is a formal structure between internal and external suppliers and quality assurance is forming. One can trace variables due to the
11
• Level 3: Defined and measured - A well-documented process has been established and a well-defined leadership can control and assign resources for each project. A quality management system is in place and training programs are executed. Costs, quality and functionality are followed up through well-defined sub processes.
• Level 4: Managed - Quantifiable targets and measurements are well defined and stable testing methods are in place. These play a huge role as they contribute to keeping processes stable giving processes predictability and high quality. The cause of variations can be identified and eliminated.
• Level 5: Optimized - Continuous improvement is a common part of everyday work at this level. Methods are in place to identify weaknesses in the process and budgets are made to tackle these. Predictability, efficiency and process control are key to improve the organization. (Bergman et al., 2012)
2.3 Quality Process Improvement
In order to improve quality, it is important to be able to identify weaknesses within the organization. These weaknesses could be within its products, services and input resources like men, machine or material. A manager must be able to measure these in order to minimize wastages within the organization and prioritize which solution will lead to being most beneficial for the company. Quality improvement leads to a near perfect working of the organization according to TQM and leads to continuous improvement and elimination of problems resulting in a revolutionary rate of growth. (Mukherjee, 2006)
Managers need systematic approaches to drive continuous improvement programs. Some organizations follow standard and popular approaches, while others develop unique approaches to meet their own needs and cultures. (Evans, 2005)
12
2.3.1 Plan-Do-Check-Action - Cycle
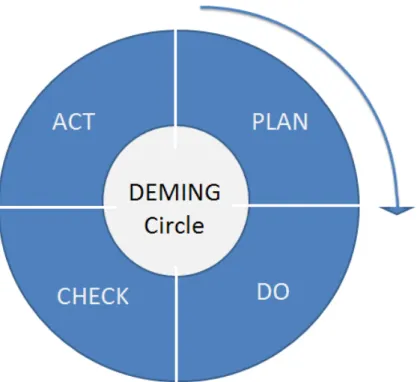
The Plan-Do-Check-Action cycle, as depicted in figure 4, is a reiterative cycle with focus on continuous improvement and was invented in order to reduce variability which is believed to be inherent in all processes. (Deming, 1990) Variability, according to Deming, is caused by two types of causes. Special causes which are easily assignable, identifiable and solvable and common causes which are due to design and operation that only management can eliminate. (Kelleman, 2003)
Figure 4 - PDCA-cycle for continuous improvement. (Kelleman, 2003)
The "Plan" step corresponds to defining the problem statement and performing root-cause analysis. The "Do" step consists of the establishment of goals, the evaluation of multiple alternatives, and the selection of preferred countermeasures, while the "Check" step is the verification of measures taken. Finally, we arrive at the "Act" step, which is addressed by documenting and executing an implementation and follow up plan. (Mascitelli, 2011)
13
2.3.2 Six Sigma
Six sigma is about reducing variation through improving quality, productivity and efficiency throughout an organization. The methodology is systematic and based on homing in on key factors that drive the performance of a process, set them at the best levels, and hold them there for all time. (Wedgwood, 2007) The main focus is around doing the right things right and combining customer knowledge with core process improvement efforts. There are many variables in a facility such as raw material, process equipment or machines producing a product, humans in the system or process procedures. Reducing the variability in any of these could lead to reduction in waste, higher yields, shorter cycle times and improved overall equipment efficiency. Six sigma variation reduction efforts focus on reducing the variation from all these sources. (Summers, 2011)
Another focus within six sigma is to control each process and to be able to calculate the process capability using statistical methods. As a mathematical term this stands for the amount of standard deviations added/ subtracted to the average value. To put this in simple terms it determines if a process is within statistically acceptable variation. In order to achieve six sigma a process must not exceed 3.4 defects per million opportunities which represent a yield rate of 99.9997%. (Summers, 2011)
2.3.3 Lean management
Lean is a systematic methodology to reduce the complexity and streamline a process by identifying and eliminating sources of waste in the process - waste that typically causes lack of flow. (Wedgwood, 2007) Waste in this perspective would be both materials and time spent in processes that don't generate value for the customer. This is done by making processes more effective and creating a flow through the system that alleviates bottlenecks. It is important to reduce variability as this contributes to preemptive activities that are non-value generating and increase the time it takes for each product to be produced. There are many ways of eliminating waste and one of them is to view the human perspective. Unexploited talents and creativity within the workforce can be viewed as a waste as it doesn't allow the individual to contribute as much as they could. (Bergman et al, 2012)
Working with the 5s is the most commonly used method of work within a production facility in order to eliminate waste. These are to sort, set in order, shine, standardize and sustain. All these contribute to easier discovery of faults and create a culture of structure. (Bergman et al, 2012)
14
2.3.4 Statistical process control
There are variations in all processes and the best way to tackle these is by introducing statistics and measuring as well as documenting. The purpose of this is to identify what is causing these variations in order to solve them and create a stable process. To make this easier a manager needs to identify which processes cause discernible variations and which cause random variations. Discernible variations need to be eliminated as soon as possible in order to create a stable process and give it predictability. This goes hand in hand with continuous improvement as when one source of variation is accounted for the next may be focused upon. (Bergman et al, 2012)
There are two major ways of gathering statistics and these are either by gathering the entire collection of values or by gathering a portion of the values. A population is a collection of all possible elements, values or items associated with a situation. The drawback to this could be that there are a lot of values to study but give a more certain result. The other is a sample which is a subset of elements or measurements taken from a population. This makes the data gathering process easier but leaves an opportunity for certain samples to be biased and give the wrong result. (Summers, 2011)
2.5 Cost of quality
There are many costs associated to quality and the purpose with gathering information is to assist the management in assessing which areas need more effort, resources and perhaps more budgeting in order to create improvements. (Kelleman, 2003) Research made in different Swedish industries indicates that the amount of poor quality represents a value of 10-20% of the company's total turnover, and sometimes even higher. (Sörqvist, 2001)
Total quality costs are typically broken down in four segments (Hartman, 2002): • Prevention costs: Costs incurred to keep failure costs at a minimum.
• Appraisal costs: Costs incurred to determine the degree of conformance to requirements. • Internal failure costs: These costs are related to the defects such as scrap, rework and
repairs.
• External failure costs: Costs related to defects found after the customer receives the product. There are many additional hidden costs related to this.
15
A quality cost is considered to be any cost that a company incurs to ensure that the quality of the product or service is the best to date. The most common of these that are easy to discover are scrap, rework and warranty costs but they are merely the tip of the iceberg. Everything in a company is in some way or another related to quality, if it isn't the actual product it may be the psychological perspective and the customers’ perception of how they are treated. Thus, it is important to get things right the first time and avoid "redoing" as this is a source of waste. Every department should monitor and collect quality costs within its control. (Summers, 2011)
The further a product is in a company; the more costly errors are. So, if a nonconformity is discovered in the manufacturing stage it will be more costly compared to the discovery in product development stages. This is illustrated in the graph in figure 5. The part may need to be scrapped or reworked in order to meet customer requirements. It is even more costly if it reaches the customer and can invoke a variety of feelings, the least of which will be dissatisfaction. One may have to repair a product to satisfy them, but the company's reputation will already have been damaged. Failure to discover flaws increases as a function of the failure’s detection point within a process. (Summers, 2011)
16
2.5.2 Production quality
Quality within production is reliant upon the methodology used within manufacturing and its tolerance to resist variability. To create robustness against variability it is important to use tolerances, construction parameters and process parameters to stay within the acceptable level. The causes of variations are called disruptive factors and can be caused by anything from temperature within the work environment to incorrect usage of tools. By systematic work with construction parameters one can avoid such variability and achieve a robust construction and understand and work around the causes of these effects. (Bergman et al, 2012)
Standardization is a good method to reduce variability and can be done by clear working instructions, checklists and maintenance procedures. If the production works in the same manner, it should yield the same results. This is not only true for working methods but also places where tools and parts can be found. Visual management is a method that belongs within the "5s" mindset and helps people observe processes and objectives and can be applied to all areas of the production. Standardizing also greatly supports the setup time reduction and allows an individual to locate tools or prepare for their upcoming work. (Summers, 2011)
One of the most famous experiments is the Hawthorne experiment that was conducted in order to find out how lighting effected the work environment. The conclusion was that it wasn't the lighting but the interest of the management on the workers that effected productivity. Working in a group and feeling appreciated thus leads to an engaged production team with good working morale. (Bergman et al, 2012)
17 3. METHOD
This chapter contains the methods used for this study as well as how data is collected and how viable it is to use in this kind of study. It also contains how the data is analyzed, its reliability, validity and ethical perspective.
3.1Methodological approach
It is important in any study to be scientific and base results on facts, as is the method used in each study, as it effects and permeates the entire study. Making a conscious selection of methods makes it possible to be scientific. A description of the problem is the easiest way to start to solve the issue and this is done by categorizing the information needed. In order to improve something, it is important to have perspective over the issue and this technique is used to further define the problem. (Ejvergård, 2012)
A mix between a qualitative and a quantitative study has been chosen as the data will be both numerical and written. The numerical data of errors was collected in order to lead to the major issues regarding variability which is regarded as quantitative. Interviews were done to lead to possible solutions as well as to get further insight into occurring problems which is a qualitative approach. (Braun and Clarke, 2013) As a researcher it is important to get as much data as possible connected to the issue. Once all the data was collected, I used the technique of stratifying to dig deeper into the problem. Stratifying is used within case studies in order to divide large segments into smaller ones and add variables to get a scope of the entire case. (Ejvergård, 2012)
Variability is unique for each situation and each company dependent on which phase a company is in. A production process contains many sources of variation. (Evans, 2005) The maturity level of the company was assessed to find out what kind of processes are implemented and, with regards to that, the required steps were set in motion to better the current situation. Research was done on similar studies as well. In order to always attain reliable information, it was gathered firsthand by the author as working at the company allowed this freedom.
The deductive approach was taken and, based on prior concepts of reducing variability; data was collected, sorted and analyzed. (Yin, 2016) The data showed the amount of errors and when they were incurred. After being able to figure out what these errors were, we need to tackle the major issues. This also can be done with the help of most quality-based management systems. Qualitative research usually follows this approach as many factors become visible when analyzed in the correct manner. By regarding both concepts
18
(quantitative and qualitative) one may achieve a broader outcome and should lead to more
clear results. (Yin, 2016)
3.2Collection and analysis of empirical data
3.2.1 Data Collection
This project was initiated by the collection of hard data which described the reasons of the errors, the amount and the time the information was collected. This information was available within the quality department that was established in the beginning of 2019. This data was then processed, and verbal information was converted into statistics by amount of iterations. The data was compiled based on how many errors incurred each week as well as what kind of errors. This data was then sorted by amount of errors (most to least) to easily be able to identify the major variables. This data was then sorted into a pareto distribution to be able to calculate how much each error represented in percent. The approval rate was also calculated in order to find out how many assemblies pass the first time they are tested. The purpose of this is to know how many cycles each assembly passes the quality team and needs to be tested.
In order to observe what is occurring in the production the author worked side by side with the technicians allowing the possibility to analyze the everyday routines. The work instructions were followed; workbenches were analyzed and compared to each other. The production floor communication was analyzed as well in order to evaluate how it is working and how much information is being communicated verbally.
To get an input from each department interviews were done using the qualitative interview approach. This qualitative interview did not follow a strict agenda or a scripted questionnaire but rather is in a form of an open-ended conversation that can be steered towards a target problem. (Yin, 2016) This is useful when enquiring into a broad problem that may contain lots of small issues. Several support topics were later formed into questions that were individual for each area within the organization. The purpose of this was to get insight into which processes were lacking and what each department expects of another.
To be able get a perspective on how standardized the work environment was the author also conducted a random sampling to see how much standardized the workplace was at the end of the workday. Out of 9 stations the screw boxes and testing equipment of 4 were examined as well as the amount of materials in each place.
19 3.2.2 Data Analysis
Pareto analysis - Pareto diagram is a diagram based on percentages, and as our basis is quality errors, will indicate which area will lead to the greatest benefit if improved. (M.L. Kelemen, 2003)
Capability maturity model - This is a model of different phases that a company must pass through in order to go to the next. It depicts what kind of processes are in place and what kind of processes need to be stable for a company to achieve the next level of maturity. This model is all about process improvement. (Bergman et al., 2012)
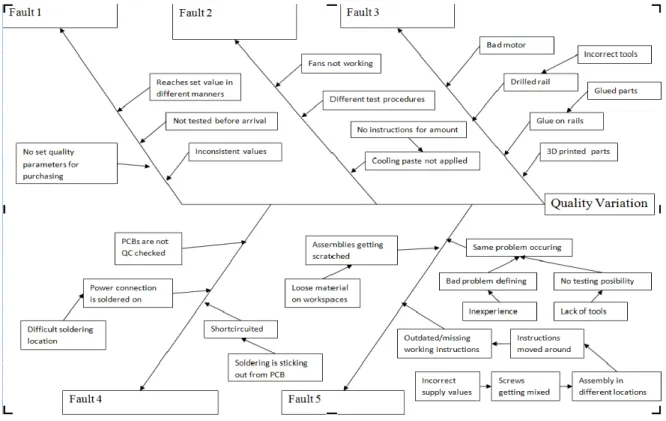
Ichikawa model - The Ichikawa model or more famously known as the cause and effect diagram can be used to determine the reasons behind each problem by dividing them in different categories dependent on the root of each issue. By asking why five times an enquirer is lead to the root of the cause is the basis behind this idea. (Bergman et al, 2012)
Cost of poor-quality analysis - The cost of everything that prevents a nonconforming product to be received by the customer. This includes scrap, time wasted redoing tasks such as repairs and retesting, processes that aren't necessary and internal rotations amongst many other. (Donna C.S. Summers, 2011)
3.3Quality
3.3.1 Reliability
Reliability refers to the possibility of generating the same results when the same measures are administered by different researchers to a different participant group(Marks and Yardley, 2004) Out of the data that was collected, all entries had reasons behind them, and
were logged by myself and three of my colleagues. As each test is done manually, a quality controller follows a manual with triggers for each function, which makes it is hard to fail. The testing quality is quite high and rigorous and can only be faulty by incorrect procedures but can only have two outcomes. Passed or failed. The whole process is standardized for each part and testing equipment is not a cause for concern.
The interviews were conducted in the office of each interviewee and the focus was to create a relaxed chat were ideas could flow freely. The preparation was done by writing down issues that were of concern and later formulating questions connected to those or to mention them and ask for an opinion.
20
As the hard data is the basis of this study which is traceable and descriptive it makes the study reliable but even in this matter human error could be a factor. The quality could be strict or lenient dependent on the attitude or work ethic of the inspector.
3.3.2 Validity
Validity in a broad sense can be defined as a piece of research showing what it claims to show. This is much harder to prove in qualitative studies compared to quantitative where numeric data can be traced to its source. Qualitative research aims to pursue ecological validity, which is concerned with the relationship between the 'real world' and the research. (Braun et al., 2013)
The validity of this study is based around error data that four different people have collected and logged and described the reason for the error. This was then interpreted into specific categories as it was sorted and analyzed. This is the first level of validity, but we also need another source of information to be able to methodically triangulate. Therefore, the qualitative method was introduced, and I interviewed people who were connected to the department to see if they were having trouble with the same issue. Besides this the random sampling and observations made lead to the same conclusion.
3.3.3 Ethical perspective
Ethics should be an integral part of all stages and aspects of research, and being an ethical researcher involves not only adhering to the minimum standards set out in ethical codes of conduct, but also developing a broader ethical orientation that informs your research practice. (Braun et al., 2013)
This study was conducted with hard data as a base and as such leaves out many moral parameters except for the person constructing each assembly. As a researcher it is important to not look for people to blame but instead try to see the whole picture as of what caused this person to produce a faulty part and if this person has the right tools for the job.
The interviewees were given the confidence and assurance that they will remain anonymous before the interview was initiated. This was done to make sure that they don't feel intimidated and can express themselves in comfort and honesty. The location was chosen by the interviewees contributing to the previous fact.
21 4. CASE STUDY
This chapter contains the current situation at the company and describes the case in question.
Biotech is a manufacturer of machines and various ingredients. The examined machine that we will be focusing on is their big seller. There has been noticeable variation occurring during the production process and the company wishes to research the amount of variation and the root cause of each error. Quality logs are documented and will provide the base for this study and through interviews and observation a broader sense of the problem will be examined.
The production of this machine is built in various modules where manufacturing occurs from small parts and therefore has a long manufacturing process creating a lot of room for variability. Each module is built by technicians that have undergone certain training and are supervised by the production leader and associates during the workday. The modules are assembled by skilled technicians that have experience and the possibility to test each assembled module. After the main module assembly is done it is passed on to the quality department that tests each subassembly thoroughly using equipment to mimic the final use of the product. Once this is done the final machine is assembled by the most experienced technicians who first test the machine themselves then pass it on for final testing by the quality team before shipping it to the customer.
In each step of the testing process the quality of the final product is improved but there is an uneven variation occurring during each step. Some subassemblies pass without error only for it to be found in the last step of the process and some pass all steps fail free. The variation seems to follow no distinct patterns but does create a lot of cycles in the production line as parts need to be altered or replaced to fulfill the specifications successfully. This makes an already long lead time even longer and time is wasted during repeated errors.
This report is conducted as a single case study type thus it does leave the possibility of problems only occurring within this field. There is some difficulty in generalizing results when there is a lack of comparison. On the other hand, this study will be much more focused and more depth will be achievable.
22 5. RESULTS AND ANALYSIS
The chapter provides a description of collected empirical data and results from the completed analysis of empirical data considering the formulated purpose and the formulated research questions. In the chapter figures are used in presentation of empirical data, as well as in analysis of empirical data.
5.1 Quality variation analysis
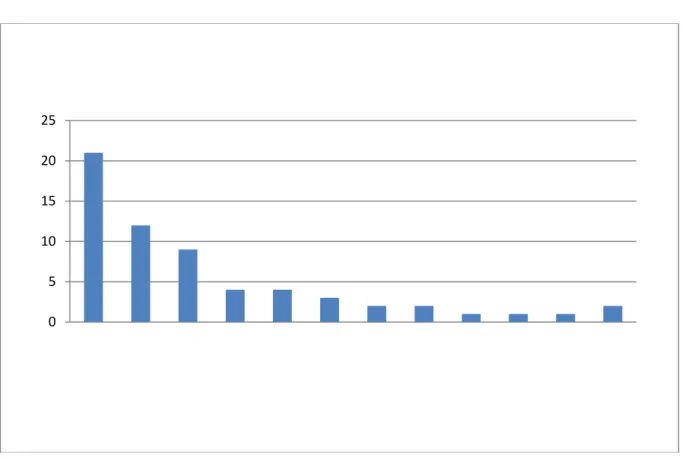
The base of this research originates from the data collected through daily logs done by the quality department. The assembly consists of three major parts that are tested after being built. To find the variability in each assembly I decided to use the total amount of error statistics given for each part that are visualized in figure 6 and compile them using the pareto method to find the major causes. Once this is done, we will know what part stands for the most errors.
Figure 6 - Assembly one - Error graph.
This graph above shows the distribution of errors for one of the assemblies arranged from most to least. The percentage of errors can later be calculated by dividing it by the total amount. This was done for all three major components and by factor of errors and the results show that there are 5 noticeable faults that need most attention. This graph indicates that the 'motor assembly' needs to be focused upon. Findings made by the second and third component
0 10 20 30 40 50 60 70
23
(Figure 8 and 9) follow similar patterns and indicate that there always is an error that needs more focus and when solved will lead to a major decrease in cycles of the production.
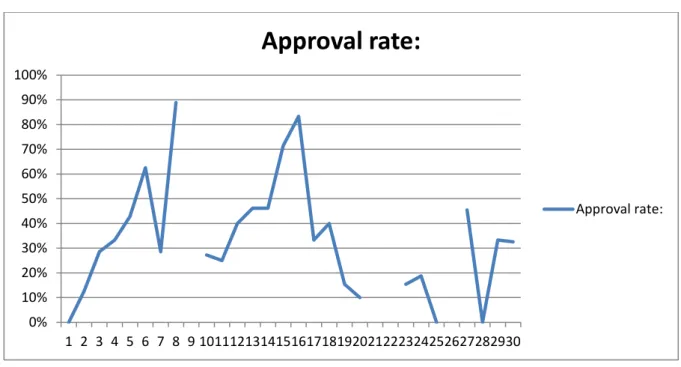
Now that the major flaws in each assembly have surfaced, we need to decide which one needs to be focused upon most. This is done by evaluating the approval rate that is visualized in figures 7, 10 and 11. These values were generalized over the whole period and as such will represent a mean value of the period. The final assembly had the lowest approval rate (19.5% approval), second is the top assembly (32.6% approval) and last the bottom assembly with a marginally better (71,2% approval). Roughly 20% of the causes stand for 80% of the errors. By focusing on the 20% the company can vastly reduce the amount of errors and the amount of cycles in production.
Figure 7 - Weekly approval rate graph of the main assembly during a 28-week period.
In order to assess the variability and the consequences of these errors, we must analyze the processes for each action. This was done by means of interview with two affiliated departments. Logistics department were having trouble keeping track of the amount of material available due to incorrect procedures regarding scraping and materials being left on workbenches. Whether these are usable or going to be scraped is a mystery, but it correlates somewhat to the main variables causing the cycles in the quality process, which is “Incorrect assembly”, and will eventually cause incorrect quantities in the inventory. The quality manager was aware of this issue, that surfaced during the interview, and had implemented a
0% 10% 20% 30% 40% 50% 60% 70% 1 2 3 4 5 6 7 8 9 1011121314151617181920212223242526272829
Approval rate:
Approval rate:24
weekly scraping procedure carried out by the quality team but the amount of scrap is high and varies a lot making it hard to control.
This leads us to the consequences of variability which can be measured as a “Cost of poor Quality” issue. Scrap levels are quite high as faulty PCBs and scratches can’t be fixed and the amount of cycles between production and quality is high. This is evident in the main assembly – final assembly data as one out of five passes the first time. This means that the traffic and setup time for each testing procedure is unnecessary time spent. This extends the lead time by five and quantifies to 6+hours per unit as each unit takes 2 hours to test without flaw.
Processes were further analyzed using the CMM. All processes are defined and repeatable that are connected to the production and quality department and statistics can be attained. As the internal variation is fluctuating, we can conclude that it is not in statistical balance. However, there is predictability on how much this facility can produce. This gives the company a level between 3 and 4. To be able to predict the outcome and to enable further stability within standard deviations we need to continuously improve the processes which can be done by implementing Six sigma.
25
5.2 Manufacturing Variation Analysis
By means of observation and random sampling, the production facility was evaluated. At each workbench detailed instructions are given for each module and assembly to make work easier. These are updated as soon as the module is changed. Each station has a screw kit with screws connected to what is needed to be built on each station. I conducted a random sampling test to see how well these have been kept in order. Out of five, one was complete as the others had a few screws mixed, were missing screw names and had a lot of screws that didn’t belong to that station. It is evident that the screw kits were kept in their order for a little while but as time goes on, they wander between stations and technicians adapt these to be their own personal screw kits. Also, modules and assemblies aren’t always built in the right place causing a collection of random screws in each box. This surfaced during the ichikawa-root cause analysis depicted in figure 15.
Figure 8 - Ichikawa diagram
Working instructions are updated quite frequently as each new upgrade is introduced to the production line. Most are conveyed through instructions, but many are also conveyed by word and experience. There are many quick solutions rather than standardized solutions that the technicians may not be aware of which can lead to misunderstandings. Also, this is
26
done on occasion without prototype testing and faults are discovered by the experienced technicians and in the quality department. There needs to be a system in place to monitor the most recent changes, so they are tested properly and never risk reaching a customer.
The workplace environment is a very comfortable place, and everyone seems to be enjoying their work which has both good and bad implications. Too much comfort may create an environment lacking focus and professionalism and too little may create uncertainty and stress the workers. There seems to be a good balance but there also seems to be a need of quality awareness. Each item is checked by the quality department before being placed in shelves in the inventory. All necessary items are collected either from the workbenches or by finding them in inventory. As collecting them from the inventory creates an extra process of locating what is needed, time is being wasted as less experienced technicians spend longer time to find what they need. Some technicians are placed on the stations that they do best, which is a good strategy, but it doesn’t give the rest of the production perspective regarding what is needed, and they tend to not see the broader perspective.
Biotech has recently implemented quality standards ISO-9000 which is an important part of the evolution of the company and leads to continuous improvement. As this covers many areas and many levels it leads to control in all areas and the possibility to monitor changes. In practicality this perspective is process oriented and has little to do with the attitude to the approach on quality by a technician. In order to educate on a manufacturing level with real practical implications it can be advantageous to introduce Lean thinking and 5s. These perspectives focus on day to day affairs both as processes and as a working method. The waste level of this company could be considered quite high and there are plenty of opportunities to increase the profit even by slowing down the production but making sure that each part is made perfectly from the start.
Six-Sigma focuses on reducing variability by means of introducing statistics to all processes and pushes a company to meet the ultimate demand of statistical balance within the 6-standard deviation limit. This can be viewed as the natural progression of this company.
27 6. DISCUSSION
The chapter discusses the results of the study regarding quality, reliability, the stated
purpose, research questions, and limitations. Based on the discussion, practical applications and suggestions for further research studies are given.
When analysing quality variations, one realizes how individual it is for each field or each company. Be it a production facility or a company working towards services all variations are unique and so is the case in this study as well. Biotech AB has been growing fast and, consequently, the production and quality department have been put under pressure to meet targets. This has been done successfully and would, in the future, like it to be done more efficiently as well. The main variables uncovered during this study have been concerns for the production manager and being available, through statistics, will give a basis for improvement. The quality for the hard data collected could be considered quite high as it was taken from the database and compiled, from verbal to numerical, but as the amount that this company is producing is not the same for every week, it was more suitable to generalize the total quantity. If the same quantity of assemblies was built every week the monitoring and discovering of irregularities would be much easier.
As an associate of the company it is easy to see myself as a limitation during this report. So, to avoid bias and keep the study objective the focus was put on hard data and less on observation. Another limitation was the ability to compare companies as there are not many within the same scale of production capabilities. On the other hand, plenty of studies regarding quality have been made but are quite hard to generalize. A study that was of some help is "Quality-driven logistics" (Andersson, 2018) where the different quality management systems were compared against each other. By reading this I gained the perspective that they focus on companies that are in different maturity levels. For example, Biotechs maturity level was determined to be at level 3-4, where processes are in place but not in statistical balance, and the next step of progression would be for all processes to be in statistical control. A Six-sigma approach.
Six-Sigma focuses on reducing variability by means of introducing statistics to all processes and pushes a company to meet the ultimate demand of statistical balance within the 6-standard deviation limit. This can be viewed as the natural progression of this company.
28
6.1 Practical implications
The research in this study indicated that there is a lot to improve within the analyzed processes and which ones need most attention. Now we will discuss what one may do in practicality to ensure that we get rid of all concerning issues. The issues that are not solvable in house, such as faulty hardware, need to be addressed by the logistics department. I would suggest finding a better manufacturer as it may be worth paying a bit more to ensure satisfied customers and to avoid rigorous testing and calibration and recalibrations. It is also important to place extra checks around products that are faulty continuously as early as possible so that no faulty products ever enter the assembly.
A major issue of concern was the number of tests done before the final product or assembly passed the inspection. As this is quite high, I would highly suggest that either the order of testing be changed in order to focus on the consistently failing part or test all the mechanical parts so that many faults may surface. It is important that the faults get flushed out as soon as possible and will save a lot of time.
If it is possible to establish active feedback from the production to the engineers and vice versa both parties may gain knowledge and be able to make fast changes. This will increase the understanding of the product and the thought behind the construction.
Raising the standard of quality would be a team effort and as such the whole team would need to start thinking of quality daily and would need a target to aim towards. The implementation of weekly meetings could give the team both perspective and something to aim towards. Direct feedback by the quality department would ensure that corrective actions take place straight away when inadequate parts emerge and are taken care of so that no one else makes the same fault. The ability to commit an error could easily be avoided by standardizing workbenches further and making sure that all parts, that a technician needs, are readily available. Tools that are kept in order, or always have a place to be, are missed. The appointment of roles in production gives the worker a sense of pride and responsibility. Be it small or large, the person will be in control of an area and responsibility will be enforced upon them.
An error persists when no one is working actively to tackle the cause. Therefore, communication is very important and feedback on reoccurring errors and statistics can give the management a lot to work with in terms of improvement. This works both ways as a person may not know what they are doing wrong. Keeping track and introducing statistics is the best way to tackle variation for each abnormality will be visible and traceable. This
29
information could be shared between departments and allow corrective actions to be done faster.
Errors need to have flags and alerts as they may not be noticed during day to day work. A critical amount of errors must be determined that is within a standard deviation and everything exceeding this value needs to be taken care of urgently. The awareness of this error must be informed to all affected parties by means of word or some form of standardized board. Weekly meetings are a good tool to deliver this information.
6.2 Further research suggestions
While conducting this study many questions arose and some concerns as of to the consequences of variation in practicality. If it is kept within the production and discovered in the quality inspection it will be of no concern but any further, the company may suffer. This is what I personally would research upon if I was to take this study to the next level. Warranties have been established to complete the product cycle and a support team to give the customer reassurance but how many faults make it through the inspections and are all parameters considered during testing? I would suggest that the returned machines should also be analyzed to see which faults persist and if there is any trend. This could be done while doing a lifecycle analysis of the product.
This study was focused on the quality of the main product and its production line to find out the variability and means to tackle it. This also effects the lead time, repair time and scrapping of faulty components that all amount to waste in time spent and material. If one were to calculate this, it would give a guideline to which is in most urgent need of attention.
We noticed in this study, as stated through the interviews, that scrapping and mapping the components was creating a challenge. This could be studied as well as it plays a major role in the logistical network. The cost of poor-quality analysis done in this study is only connected to the examined researched departments and are only scraping the surface of what the real cost may be.
30 7. CONCLUSIONS
Biotech as a company has a versatile production and quality team and meets many challenges weekly that they deal with through quick thinking and quality awareness. Having a youthful team gives the advantage of easier adapting to changes made and quicker learning and adapting. Whenever a problem surfaces it is dealt with by the quality team and tightened inspections are done. The flow through the system is decent but quite long and checks are done in production by the assemblers. Testing equipment is available but doesn’t have standardized places on the workbenches which can create confusion as some of the testing equipment is shared. The workbench layout is easy to understand and mostly all equipment for daily work is available at hands reach, if not one may collect them from the supply. Larger parts are kept in another supply further away which creates a small amount of traffic. An issue that I have noticed is that there isn’t a routine in place to fill up screws in boxes and make sure all products that need to be assembled are available in the shelves. By making this into a process and giving someone or everyone the responsibility to assure that their workbench is ready for the next person, or the next week, one could save time and make sure order is kept.
The quality team works towards identifying all faults and does quality checks whenever each batch of new materials enters the inventory. They are familiar with the functionality of the final product and know what tolerances are acceptable in terms of esthetics and functional values. It is quite a passive role at the moment and simple problem descriptions are given to the production to fix. If this were to be a proactive role one would be able to solve quality related matters faster and be an active flagger. The products are tested until a fault is discovered but since there may be more than one fault as the statistics imply, I believe it would be more advantageous to complete the entire test on assemblies with a lower approval rate. This would minimize the times the product will travel between production and quality as well as giving the production the opportunity to fix all eventual faults.
As errors are discovered both in production and quality there needs to be a system in place for everyone to be able to highlight errors so that the communication is not only verbal. A system that is proactive that makes sure that each task gets a permanent solution. One way to do this is to create weekly follow up meetings on a specifically chosen day that suits everyone and brings quality and production together so that ideas flow freely and officially. This will create a better structure and also work as a nonofficial deadline for quality follow-ups. Feedback from quality, number of products produced and monthly or quarterly targets
31
may be reviewed. By assigning everyone small roles or responsibilities that need to be presented on a certain day will increase the responsibility taken by all parties.
The Biotech production line is a very comfortable place with little noise and quite ergonomic. In the product assemblies initial phase, the components are very light and easy to manage but as they get to the final assembly its gets quite heavy and could be a strain on the staff. The comfort creates a space that one desires but it is easy to get too comfortable and it is noticeable by technicians personalizing their workspace. Rotations in the production line can increase the perspective of quality as well as teach them how to assemble all intricate parts together and further educate them.
When regarding the production line with a quality perspective everything is in a systematic order and well maintained and most problems seem to be related to time wasted or incorrect/slow procedures for scrapping. As waste management is a typical LEAN issue, I would propose introducing 5s into the daily routine and also employ a certain transparency as to what each product costs. I believe that once people know how much each product costs, they will regard it from that perspective and treat an expensive part better. Lean and 5s also give the sense of professionalism as they enjoy the feeling of a healthy clean environment.
The main data in this study was collected from the cloud network which is accessible to anyone within the department. This greatly eases work, allowing an associate to work from any location but it also has its vulnerabilities as accessibility to the internet is required and if someone were to sabotage the documents, months of work will go wasted. My recommendation is to create a backup that is updated weekly in an offline document.
In conclusion, Biotech has achieved a lot in a very small-time frame and keeps on expanding. The production and quality are far beyond that of companies that have been around for the same period and is now in need of stabilizing the processes and permanently reducing variability. On the CMM model the natural progression is to create predictability in processes and continuously improve in order to cement the level of 4. I hope this report brings the company a bit closer to this target.
32 REFERENCES
Books
Beckford, J. (2002). Quality. 2nd ed. London: Routledge. Kelemen, M. (2003). Managing quality.
Marder, M. (2011). Research methods for science. Cambridge: Cambridge University Press.
Bergman, B. and Klefsjö, B. (2012). Kvalitet från behov till användning. 5th ed. Johanneshov: MTM. Mukherjee, P. (2006). Total quality management. New Delhi: PHI Learning.
Hartman, M. (2002). Fundamental concepts of quality improvement. Milwaukee, Wisconsin: ASQC Quality Press.
Ejvegård, R. (2012). Vetenskaplig metod. Lund: Studentlitteratur.
Womack, J. and Jones, D. (2003). Lean thinking. New York [etc.]: Free Press. Goertz, G. (2017). Multimethod research, causal mechanisms, and case studies.
Yin, R. (2016). Qualitative research from start to finish. 2nd ed. New York: The Guilford Press. Summers, D. (2011). Lean six sigma. Boston (Mass.): Prentice Hall.
Evans, J. (2005). Total quality. 4th ed. Mason, Oio: Thomson/South-Western. Deming, W. (1990). Out of the crisis. Cambridge.
Mascitelli, R. (2011). Mastering lean product development. Northridge, Calif: Technology Perspectives. Wedgwood, I. (2007). Lean Sigma. New Jersey: Pearson Education, Inc.
Braun, V. and Clarke, V. (2013). Successful qualitative research. London: SAGE.
Marks, D. and Yardley, L. (2004). Research methods for clinical and health psychology. London: SAGE. Juran, J., Gryna, F. and Bingham, R. (1974). Quality control handbook. New York: McGraw-Hill. Crosby, P. (1979). Quality is free. New American Library.
Reports
Wettersten, H. (2018). Change through standardization. Uppsala University.
Andersson, R. (2007). Quality driven logistics. Chalmers University, University college of Borås. Hefley, W., Curtis, B., Miller, S. and Konrad, M. (1995). Incorporating human resources into process improvement programs. INCOSE International Symposium