Proactive Quality Management in Production
- A case study at Scania CV AB
Rafi Totangy
Product and Process Development
Production and Logistics
School of Innovation, Design and Engineering Master Thesis Work: Advanced Level, 30 Credits
Supervisors, Scania CV AB: Jimmie Andersson, Oskar Hjälmeby and Andreas Pihl Supervisor, Mälardalen University (MDH): Anders Fundin
Examiner: Antti Salonen Date: 2016-08-08
Acknowledgements
The research for this thesis has been conducted at the School of Innovation, Design and Engineering at Mälardalen University. During the completion of this thesis, I have received generous support from a large amount of people, who in different ways have contributed to the completion of this academic assignment.
First of all, I would like to give special thanks to my supervisors at Scania, Jimmie Andersson, Oskar Hjälmeby and Andreas Pihl, the work behind this thesis would never have been accomplished without your support and guidance. Moreover, I would like to thank my supervisor at Mälardalen University, Professor Anders Fundin, who has supported and encouraged me through this work. The knowledge and support you have contributed with; I will keep forever. Also I would like to thank the employees at Scania, who have been extremely helpful and given me invaluable support during the completion of the thesis. Thanks for your contribution.
Lastly, thanks are also due to my family, friends and classmates for the support and knowledge you have contributed with.
Rafi Totangy
Abstract
Title: Proactive Quality Management in Production
Subtitle: A case study at Scania CV AB Author: Rafi Totangy
Topic: Product- and Process Development Subsection: Masters’ Degree 30 HE credits
Supervisor, MDH: Anders Fundin
Supervisors, Scania: Jimmie Andersson, Oskar Hjälmeby and Andreas Pihl
Examiner: Antti Salonen Period: Spring 2016
Summary: In order to survive the threatening rivalry, manufacturing organisations are required to constantly improve the quality of their production processes. Earlier research shows that manufacturing industries are today attempting to implement various proactive quality management practices using more structured and systematic working methods in the production processes. However, this attempt is argued to be implemented to a small extent. For that reason, the intention of this thesis is to examine how a multinational company can utilise existing tools and work-methods to proactively improve quality of production processes to better meet or even exceed the needs of customers without financial investments. The intention is to review theoretical research in the field and evaluate its applicability. Further, the aim is to contribute to existing literature and broaden the knowledge in the field of quality management by answering the research questions: 1. How can one proactively improve the quality of the production process without financial investments? 2. How can utilisation and development of existing tools and work-methods at companies establish proactive quality improvement in the production process? 3. What kind of information do one need to apply these methods? The researcher has been conducting a combination of both qualitative and quantitative study to provide an answer for an industrial problem. A generic case study at Scania CV AB was conducted collecting, what is argued to be, extensive amount of primary and secondary data. This thesis has with the findings identified the current state, in terms of output quality, utilised existing tools and work-methods and suggested an automatic solution for the highest failure risk identified. By doing this, the research questions have been answered and the relevance of the theory and its applicability confirmed.
Keywords: Quality Management, Proactive Quality Management, Total Quality Management, Quality
Table of Contents
1. INTRODUCTION ... 1
1.1. BACKGROUND ... 1
1.2. PROBLEM FORMULATION ... 2
1.3. AIM AND RESEARCH QUESTION ... 2
1.4. DELIMITATIONS ... 3 1.5. THESIS STRUCTURE ... 3 2. RESEARCH METHODOLOGY ... 5 2.1. RESEARCH PROCESS ... 5 2.2. METHODOLOGICAL APPROACH ... 6 2.3. RESEARCH STRATEGY ... 7 2.3.1. Quantitative Research ... 7 2.3.2. Qualitative Research ... 7
2.4. METHODS OF DATA COLLECTION ... 10
2.4.1. Literature Review ... 10 2.4.2. Interviews ... 11 2.4.3. Benchmarking ... 13 2.4.4. Documents and Internal Material ... 14 2.4.5. Observations and Meetings ... 15 2.4.6. Workshops ... 16 2.5. DATA ANALYSIS ... 16
2.6. VALIDITY, RELIABILITY AND OBJECTIVITY ... 17
2.7. PROJECT TIMELINE ... 18 2.8. CONTEXT CLARIFICATION ... 18 2.8.1. Scania Production System (SPS) ... 19 2.8.2. Product Engineering Engine Assembly (DETP) ... 20 2.8.3. Problem Description ... 20 3. THEORETICAL FRAMEWORK ... 22
3.1. QUALITY DEFINITION AND STRATEGIC ISSUE ... 22
3.2. QUALITY MANAGEMENT (QM) ... 24
3.3. TOTAL QUALITY MANAGEMENT (TQM) ... 24
3.3.1. Values ... 26
3.3.1. Methodologies ... 30
3.3.2. Tools ... 32
3.4.1. Parameters of Communication ... 33
3.5. SCOPE AND USE OF THEORETICAL FRAMEWORK ... 34
4. EMPIRICAL FINDINGS ... 36
4.1. STEP 1: PROBLEM CLARIFICATION ... 36
4.1.1. Introductory Interviews ... 36
4.1.2. Summary Problem Clarification ... 40
4.2. STEP 2: PROBLEM BREAKDOWN ... 41
4.2.1. Documents ... 42
4.2.2. Go and See - Production-line ... 44
4.2.3. Flowchart – SIPOC ... 45
4.2.4. P-FMEA ... 47
4.2.5. Summary Problem Breakdown ... 50
4.3. STEP 3: TARGET SETTING ... 51
4.3.1. Summary Target Setting ... 52
4.4. STEP 4: CAUSE ANALYSIS ... 52
4.4.1. Fishbone Diagram ... 53
4.4.2. Summary Cause Analysis ... 53
4.5. STEP 5: DEVELOP COUNTERMEASURES ... 54
4.5.1. Benchmarking Work-Methods and Work-Environment ... 55
4.5.2. Technical Countermeasures ... 60
4.5.3. Summary Develop Countermeasures ... 61
5. ANALYSIS ... 62
5.1. FOCUS ON CUSTOMERS ... 62
5.2. BASE DECISIONS ON FACTS ... 63
5.3. IMPROVE CONTINUOUSLY ... 65
5.4. FOCUS ON PROCESSES ... 66
5.5. LET EVERYBODY BE COMMITTED ... 67
5.6. OTHER THEMES ... 68 5.6.1. System Problems (MONA) ... 69 5.6.2. Right from the Start ... 70 6. CONCLUSIONS AND RECOMMENDATIONS ... 71 6.1. PROPOSED COUNTERMEASURES ... 73 6.2. CRITICAL REFLECTION ... 73 6.3. FURTHER RESEARCH ... 74 7. REFERENCES ... 75
List of Figures
Figure 1 - Thesis Structure - Authors Figure ... 4
Figure 2 - Schematic View of the Research Process (Fagerström 2004) ... 6
Figure 3 - Selection of Articles - Adapted from Professor Anders Fundin (2016) ... 11
Figure 4 – Project Timeline - Authors Figure ... 18
Figure 5 - Scania Production System (SPS) (BSEM, 2016) ... 19
Figure 6 – Total Quality Management History ... 25
Figure 7 – Values, Methodologies and Tools in TQM ... 26
Figure 8 – Values in TQM ... 27
Figure 9 - PDCA - Authors Figure - Adapted from Summers (2010) ... 30
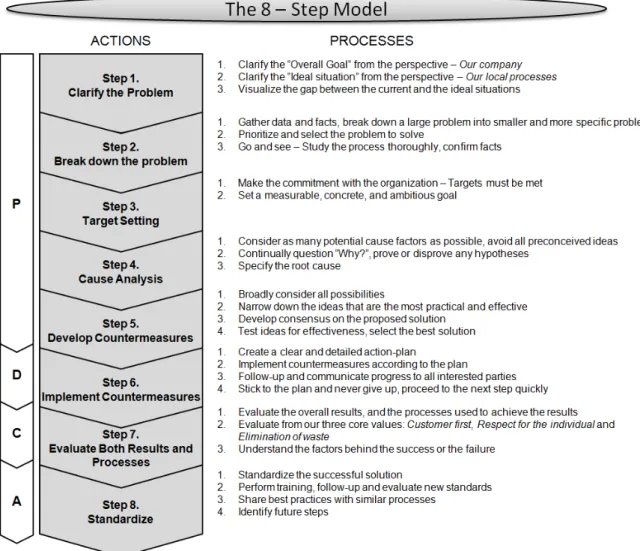
Figure 10 - The 8 - Step Model (BSEM, 2016) ... 31
Figure 11 - Communication Effectiveness (Sharma and Patterson, 1999) ... 32
Figure 12 - Scope of Theoretical Framework - Authors Figure ... 35
Figure 13 - Visualisation Current and Ideal Situation - Authors Figure ... 41
Figure 14 - Flowchart - Authors Figure ... 46
Figure 15 - Fishbone Diagram Results ... 53
List of Tables
Table 1 - Characteristics of Qualitative and Quantitative research (Merriam, 1998) ... 8Table 2 – TQM Tools - Adapted from Hellsten & Klefsjö (2000) ... 32
Table 3 - Communication Strategies (Mohr & Nevin, 1990) ... 33
Table 4 - Deviations per Week 2015/2016 - Authors Table ... 42
Table 5 - Types of Deviations - Authors Figure ... 43
Table 6 - Go and See Summary Remarks - Authors Table ... 44
Table 7 - P-FMEA Results Group 1 ... 48
Table 8 - P-FMEA Results Group 2 ... 49
Table 9 - P-FMEA Results Group 3 ... 50
Table 10 - Benchmarking Results DTMD, MSTC and Engines ... 59
List of Appendices
I. APPENDIX ... 81 II. INTERVIEW GUIDE ... 82 III. DEVIATION-REPORT EXAMPLE ... 83 IV. TIME PLAN ... 84 V. WORK-ORDER EXAMPLE ... 85 VI. FLOWCHART ... 86 VII. P-FMEA TEMPLATE ... 87 VIII. EVALUATION CRITERIA P-FMEA ... 88 IX. FISHBONE DIAGRAM TEMPLATE ... 89 X. ROUTINE UNRELATED OBJECTS ... 90 XI. CHANGE REQUEST ... 94Abbreviations
ECO Engineering Change Order
DE Scania Engine Production Assembly
DETP Product Engineering Engine Assembly
DTMD Preparation Axles and IS/IT Coordination
INAE Scania Production Logistics IT
LDETM Assembly Engineering in Brazil
MASP Product Engineering in France
MONA Scanias internal computer system
MSTC Product Engineering Truck
MZEP Production Engineering in Netherlands
PtCO Production Change Order
P-FMEA Process Failure Mode and Effects Analysis
1.
Introduction
This chapter presents the background of the thesis, its purpose and goals. Furthermore, issues that the thesis aims to answer are presented and finally the delimitations and reading instructions.
1.1.
Background
The pressure from globalisation has made manufacturing organisations move towards three major competitive arenas: quality, cost and responsiveness (Jimenez et al., 2015; Peris-Ortiz, 2015; Singh, 2014; Judi et al., 2001). Quality, one of those three arenas, is a universal value and has become a global issue. In order to survive and be able to provide customers with good products, manufacturing organisations are required to ensure that their production processes are continuously monitored and their product quality continuously improved (Judi et al., 2001). Earlier research shows that quality management is an important area of practice and research (Peris-Ortiz, 2015). According to Peris-Ortiz (2015), both managers and scholars have become increasingly interested in quality management, and the number of books and articles on the subject has grown exponentially as our knowledge has developed. Further, Peris-Ortiz (2015) claims that today it remains an interesting topic for managers and academics alike, and many organisations use quality practices, techniques, and tools to implement quality management philosophy.
Initially it was thought that quality had a cost and that if quality rose then costs increased correspondingly (Singh, 2014). This vision of quality has been changing and today a commitment to quality enhancement is considered to improve differentiation and also reduce costs (Jimenez et al., 2015). Studies have shown that companies that implement quality management can reduce their costs as a proportion of sales because they control costs successfully, eliminating scrap and rework, and improving their processes (Jimenez et al., 2015). In addition, quality management has positive effects on improving the corporate image and promoting product/service quality, among other outcomes. Consequently, quality can have a positive effect on competitive advantage, through both differentiation and cost leadership (Bindl & Parker, 2010).
The literature on quality has gone through a range of research themes and has principally examined how quality management practices should be adopted, how quality models should be
used, which techniques and tools are most effective in developing quality initiatives and what benefits can be achieved by organizations (Peris-Ortiz, 2015). According to Chiarini (2011) today, in quality management literature, there are a lot of different improvement practices oriented towards improving production processes. They have implementation factors and results in common such as: continuous improvement, customer satisfaction, people and management involvement to mention a few. However, over time, a movement from a “reactive” to a “proactive” approach has been arising (Chiarini, 2011; Osseo-Asare & Longbottom, 2002).
The simplest way to classify is thinking in terms of whether you prevent issues or help recover from issues where the literature is highly agreeing on the positive advantage of the proactive approach resulting in preventive highly efficient outcomes (Vasconcellos, 2003; Osseo-Asare & Longbottom, 2002; Chiarini, 2001).
1.2.
Problem Formulation
Anderberg et al. (2008), highlights that today, manufacturing industries are attempting to implement proactive quality management practices in the production processes. However, what is also highlighted as a problem is the extent in which this is implemented. This approach is claimed being implemented to a very small extent in relation to its potential theoretically which can result in large loss of long-term quality improvement in manufacturing production processes.
1.3.
Aim and Research Question
The above mentioned is a complex situation presenting huge challenges in the production processes. To eliminate problems before they even happen requires proactive quality management practices designed to prevent problems rather than solve them after they have occurred. In addition, without financial investments, this task becomes even more complex than what it actually is.
Following naturally, the aim of the thesis work is to examine how a multinational company can utilise existing tools and work-methods to proactively improve quality of production processes to better meet or even exceed the needs of customers without financial investments.
Thus, this thesis shall answer the following questions:
• How can one proactively improve the quality of the production process without financial investments?
• How can utilisation and development of existing tools and work-methods at companies establish proactive quality improvement in the production process?
• What kind of information do one need to apply these methods?
1.4.
Delimitations
The time interval for this thesis is from 2016-01-18 to 2016-06-01. This short time interval results in limitations both in data collection and collection of literature. Furthermore, this thesis is limited to researching one company, Scania CV AB in Södertälje, and is carried out at Product Engineering Engine Assembly, DETP, at Scania Engine Production Assembly in Södertälje. Due to the limited timeframe, the research is limited to be conducted only internally at Scania in Södertälje. Therefore, this thesis does not intend to examine whether the practical approach is applicable to other companies or industries other than the one Scania operates in. Furthermore, the implementation of the proposed results is not planned within the thesis timeframe, basically meaning the scope of this thesis covers only the planning phase.
Since DETP, Scania, will be the client, results will be conducted according to their requirements and preferences. However, there is a high probability that other departments at/or outside Scania may use the results produced, but adjustments to their preferences will not be made.
Further theoretical limitations have been made in terms of using literature conforming to Scania standards. This limitation ensues since the aim of this thesis is to use already existing standards, tools and work-methods at Scania for quality improvement.
1.5.
Thesis Structure
For the convenience of the reader, chapters of the thesis are presented below. See figure 1 for the chapters and the main thread of the thesis.
Chapter 1 Background, introduction, problem disucssion & aim of the study Chapter 2 Methodological choices, strategies and context clarification Chapter 3 Theoretical frame of reference Chapter 4 Empirical Findings Chapter 5 Analysis Chapter 6 Conclusions and Recomendations References Appendices
2.
Research Methodology
This chapter presents the methodology used in this thesis work to answer the research questions and draw a conclusion from the empirical and theoretical findings. First, a general description of the research process will be presented to clarify the understanding of the methodology and the approach for the research process. Thereafter, a short presentation of the different methods used for data collection will be given. And finally, the difference of qualitative and quantitative research is explained the concepts validity and reliability clarified, and the context, in which this thesis has been performed, clarified.
2.1.
Research Process
The research presented in this thesis purposes to be valid for the academic and industrial communities alike. The starting point of the research has been influenced by problems and challenges evident in both the real world and in theory. Throughout this thesis, literature studies have been iteratively combined with a case study in order to answer the research questions and meet the objective in a desirable fashion. This approach goes in line with Fagerström (2004) whom argues that in order to create dual relevance of the result, the research ought to move in an iterative process combining theory with real world contact. The researcher has been actively conducting interviews, collecting data and analysing it. Further, the researcher has made use of both scientific theories and real world situations throughout the study and continuously been moving between the two borders to provide an answer for an industrial problem. Figure 2, adapted from Fagerström (2004), demonstrates the starting point of the research being both influenced by theory and the real world and with a constant exchange between the two borders, the goal of the research is namely new scientific knowledge and/or new practical knowledge.
Figure 2 - Schematic View of the Research Process (Fagerström, 2004)
2.2.
Methodological Approach
When performing a research, according to Arbnor & Bjerke (1997), there are three approaches; Analytical Approach, System Approach and Action Research.
Typical characteristics of the Analytical approach in the design of a study; • An objective measure of a problems significance
• Study a factive reality that is constructed summatively
• The knowledge to be produced must be independent of individuals (observers) • The goal is to arrive at invariable results, achieving generalizable results Typical characteristics of the System Approach in the design of a study;
• A purpose to explain and/or understand a reality which is consisting of objective and subjective facts
• Consists of components mutually dependent meaning a significant role of each component
• Requires considering a more holistic view of the issue
Typical characteristics of the Action Research in the design of a study; • Reality is not independent of observers.
Considering these approaches, when conducting this thesis, the methodology employed has been a combination of both system and actors approach. For instance, a system approach has been used in different stages of this study, when considering internal and external factors that may influence quality assurance in production preparation. On the contrary, the actors approach has been used since the researcher had an active role in collecting, categorising and interpreting data. As a result, the whole process was somehow influenced by the observer.
2.3.
Research Strategy
A research can be either quantitative, qualitative or a combination of both. To summarize, this thesis is a combination of both qualitative and quantitative approach.
2.3.1.
Quantitative Research
Quantitative research, according to Dawson (2002), should be conducted by collecting statistics through large-scale survey research, using methods such as questionnaires or structured interviews. Further, Dawson (2002) explains that in a quantitative research several respondents should participate, but the contact with these respondents is shorter than in a qualitative research. Quantitative research is basically a research method where statistical and quantifiable results are sought. Patel and Davison (2011) argues that within the quantitative method the research includes measurement from data collections and statistics process, and analyses methods. Saunders et.al. (2007) explain that quantitative data is raw data that not has been processed or analysed. To make the collected data useful, you must analyse it. Graphs, charts and statistics can be useful to analyse, explore, examine, compare, describe and present the collected data.
In this thesis two different items were studied, weekly-meeting records and deviation-reports, to examine historical deviation documents. The historical data were collected to measure and obtain information concerning the amount, and types, of deviations requiring action from DETP. The reason was to illustrate the deviation pattern over time. Thereafter the historical data, in form of statistics, was analysed and examined.
2.3.2.
Qualitative Research
Qualitative research is “an umbrella concept covering several forms of inquiry that help us understand and explain the meaning of social phenomena with as little disruption of the natural setting as possible” (Merriam, 1998, p. 5). According to Merriam (1998), the main goal of a
qualitative research is to understand the nature of a phenomena and reveal how elements work together as a whole.
According to Dawson (2002), qualitative research is, with methods as interviews or focus groups, exploring attitudes, behaviours and experiences. Further arguing that these aspects are seen as most important in qualitative research, resulting in few amount of respondents with longer and more rooted interaction. Patel and Davidson (2011), describes that qualitative research should, through qualitative interviews and interpreted analysis, focus on soft values. Saunders et.al. (2007) explains that qualitative data as quantified non-numeric data being a product of several research strategies.
Finally, to define Qualitative research, (Merriam, 1998) categorized some major characteristics that define the traits of that type of research and separates it from quantitative research, see table 1.
Element Qualitative Research Quantitative Research Focus Quality (nature, essence) Quantity (amount, quantity)
Philosophical roots Phenomenology, symbolic interactionism Positivism, logical empiricism
Associated phrases Fieldwork, ethnographic, naturalistic,
grounded, constructivist
Experimental, empirical, statistical
Goal of investigation
Understanding, description, discovery, meaning, hypothesis generating
Prediction, control, description, confirmation, hypothesis testing
Design characteristics
Flexible, evolving, emergent Predetermined, structured
Sample Small, non-random, purposeful, theoretical Large, random, representative
Data collection Researcher as primary instrument, interviews, observations, documents
Inanimate instruments (scales, tests, surveys, questionnaires, computers)
Mode of analysis Inductive (by researcher) Deductive (by statistical methods)
Findings Comprehensive, holistic, expansive, richly descriptive
Precise, numerical
Table 1 - Characteristics of Qualitative and Quantitative research (Merriam, 1998)
According to (Merriam, 1998), common types of qualitative research are; Basic or Generic, Ethnography, Phenomenology, Grounded Theory and Case Study.
In this work qualitative strategy has been used to study the problem, understand the situation and explain the results. Two qualitative research methods have been applied in this work;
Generic qualitative study and case study. It is worthy to mention that the comprehensive and descriptive findings of this work are the result of the researcher investigating documents, conducting interviews and making observations.
2.3.2.1. Generic Qualitative Study
In generic qualitative study, the attempt is simply to “discover and achieve an understanding of a phenomenon, process or the perspectives and worldviews of the people involved”
(Merriam, 1998, p. 11). This type of study is an essence of general characteristics of a qualitative study where the goal is understanding, the primary data collection and analysis instrument is the researcher, the use of fieldwork, an inductive orientation to analysis and richly descriptive findings. Merriam (1998) emphasized that the findings of such a study are a combination of description and analysis, in which the analysis is carried out by using the concepts of theoretical framework.
The materials presented in chapter 4 are the results of a generic qualitative study. Furthermore, this chapter provides essential information required to perform and comprehend the case study presented in this thesis work.
2.3.2.2. Case Study
An example of definitions of case studies are “An empirical inquiry that investigates a contemporary phenomenon within its real-life context, especially when the boundaries between phenomenon and context are not clearly evident.” (Yin, 2003, p. 57) and “intensive descriptions and analyses of a single unit or bounded system such as an individual, event, group, intervention, or community” (Merriam 1998, p. 19). According to Merriam (1998), the most defining characteristic of case study research is limiting the object of the study, the case. Being an explanatory approach, case studies are best fitted to answer how/why questions. Further, case studies provide background information when answering complex questions and does not offer any particular defined data collection methods.
When conducting a qualitative case study, an extensive explanatory insight into the phenomenon is provided with purpose of deriving, through induction, a holistic understanding of a particular bounded system rather than discovering, though deduction, universal, generalizable truths.
Thus, the results of the case study might be limited since its relying on the researchers’ point of view; e.g. observer’s sensitivity, selectiveness and other traits. This is regarded as a drawback
to the case study and therefore the researcher should be cautious about his/her own impact on the findings.
The qualitative case study conducted in chapter 4 has been developed to investigate quality improvement in the production process. Consecutively, the presented findings and results are in the form of explanatory statements.
2.4.
Methods of Data Collection
To collect required information and data, this thesis has made use of a literature review, observations, meetings, workshops, internal documents and semi structured interviews. Primary Data Collection: Interviews, Observations and Meetings, Workshops, Documents (Deviation-Reports, Weekly Records)
Secondary Data Collection: Literature Review, Internal Material (Educational Documents, Pre-Studies, Thesis Projects)
2.4.1.
Literature Review
The literature review in this thesis work is based on books, scientific articles and journals within the chosen topic; Quality Management in Production Preparation. To gather literature of interest, databases, such as Google Scholar, ABI/INFORM Global, Discovery, Emerald and DiVA, and books, from Stockholm, Södertörn and Mälardalen University Library, were used to find relevant scientific literature. Thereafter, a scanning of the literature was conducted in order to gain an adequate level of knowledge of the theoretical subject. Subsequently, a final selection of literature was made to find relevant information, the final selection was based on the relevance of the content in the literature.
Keywords used when searching for scientific papers: quality management, quality assurance, quality tools, total quality management, quality in production preparation, quality in manufacturing, quality in production.
Figure 3 - Selection of Articles - Adapted from Professor Anders Fundin (2016)
Relevant articles are considered to be articles with focus on product development, production, interface between product development and production, quality aspects considering product development and production.
2.4.1.1. Source Critical Considerations
In an attempt to strengthen the credibility of the thesis, to the greatest extent possible, relevant sources with distinct academic connections were used. Reading frequently cited and well acknowledged researchers on the subject. The vast majority of the sources consist of scholarly articles published in peer reviewed academic journals, all within the field of study and with relevance to the subject. In order to write an up-to-date and relevant thesis, sources that are as current and contemporary as possible are used, with a majority of them written in the 2000s (with the exception of the original publications on the theory).
2.4.2.
Interviews
One method for collecting data, a well-recognised and possibly the most common method, namely interviews was used (O'Gorman & Macintosh, 2014; Dawes Farquhar, 2012). Generally, there are three different interview approaches: unstructured, semi-structured and structured (O'Gorman & Macintosh; 2014; Merriam, 1998). Based on the strengths and weaknesses clarified by O'Gorman & Macintosh (2014) semi-structured interviews are argued to be the most suitable approach in this thesis work. Semi-structured interviews are not as time consuming and doesn’t require as experienced interviewers as unstructured interviews do and also increases the reliability and extent of comparability. In addition, semi-structured interviews allow the researcher to prepare the interview questions in beforehand, which is (once again) beneficial due to the limited experience the student has as an interviewer. At the same time, it enables a wider scope than structured interviews, still allowing for freedom and flexibility in the interviewees answers. This lets them express and clarify their thoughts and views in their own words. Inevitably, the semi-structured interviews have weaknesses as well. They are still quite time consuming and the interview questions can lead to researcher bias (where the
Is the title relevant?
If yes, abstract screening and selection of possibly relevant articles Read abstract, if abstract relevant, read article
researchers’ opinions and believes influences the interviewees), also no generalisations can be made since they are based on interviews with a limited number of respondents. However, with the limitations mentioned in chapter 1, this approach is argued to be the best approach for this particular study thanks to its wide scope and flexibility, enabling an in-depth understanding and also its suitability for inexperienced interviewers.
2.4.2.1. The Interview Guide
The questions where formulated in a manner so the answers could be somewhat concrete, facilitating the subsequent comparison of the different answers. For more information, the complete interview guide is presented in Appendix II: Interview Guide.
Dawes Farquhar (2012) presents several basic elements for developing a good semi-structured interview guide. When preparing our interview guide we made sure to incorporate as much of these elements as possible.
For instance, a great care was taken in developing questions relating to the aim of the research without being too evident. The questions were also formulated in a language that would be understandable and familiar to the participants, excluding irrelevant theoretical terminology and explaining, in a simplistic manner, the theoretical concepts that needed to be included. The questions where eventually ordered in a sequence that would provide a natural flow and logical order to the interview. Additionally, several ethical research principles were followed in order to create a harmless situation where we as researchers would be perceived as trustworthy to the participants.
2.4.2.2. Sample Design
It’s important to choose relevant respondents since time is consumed and interviewing irrelevant respondents (for the survey’s purpose), is a waste of time. The interviews were conducted with the 10 product engineers working at DETP, Scania Engine Production Assembly in Södertälje. They are the most relevant respondents since the thesis is concerning quality improvement of their work. The interviews were carried out by a visit, meaning verbally through an open dialogue one person at a time, and the interview guide was used to ensure that every interview was carried out in the same manner. Each interview lasted between 40-60 minutes. To remember what the respondents said notes were taken and interviews recorded with the respondents’ agreement. Yet, it’s important to have in mind that recording may be
disincentive to the respondent, however, to ensure that the respondents feels comfortable, they were given the opportunity to elaborate on the answers and approve the draft of the interview.
2.4.3.
Benchmarking
“The art of benchmarking is to be sufficiently lowly to recognize that someone is better than you and at the same time be obstinate enough to learn to be equally good or better.” – Andersen and Pettersen, 1997, p. 11
According to Andersen and Pettersen (1997), the goal with benchmarking is to develop and create changes and improvements. Benchmarking is a complement to the continuous improvement since one will:
• Find new resources for improvements outside your own organisation. • Find new, innovative methods that benefit the development of the company. • Establish goals in line with the best representatives of the industry.
Benchmarking can be divided into three perspectives: • Internal
• External • Best practice
Internal benchmarking is evaluating something (e.g. work process) by studying something (e.g. the same process in different departments) within the company. With benchmarking, one can for example identify and compare different processes between different departments at the company. Comparing two departments in a company to identify strengths and weaknesses and thereby develop adjustments and improvements can constitute internal benchmarking. External benchmarking is when one studies an external party, it can be companies from different industries or from the same industry. It can be an advantage to study a company that produce different products since new things might be learnt by seeing situations from new perspectives. Best practice benchmarking is when one studies the leading company in a certain industry or process. This can be essential to be successful in your business.
In this thesis project, interviews have been conducted in form of a benchmarking process. The benchmarking process was conducted at two different departments at DTMD and MSTC, to compare how the production preparation processes differs between different departments and to identify differences in work-method/environment. Totally, two product engineers were
interviewed at DTND and one product engineer at MSTC. The duration of the interviews lasted for approximately one hour.
The two departments were chosen after recommendation from group managers and product engineers since they have similar production preparation processes, using the same system and similar work-methods, despite preparing production for different products.
Further, benchmarking with national and international units at Scania was executed when developing countermeasures. The benchmarking was in digital form, email conversation due to the long distance, where the researcher has been emailing proposed countermeasures for feedback from all potentially interested Scania units. Totally, apart from for DETP, the proposed countermeasures were sent to internationally located product engineers at MASP in France, MZEP in Netherlands, LDETM in Brazil and to national product engineers at DTMD and MSTC.
2.4.4.
Documents and Internal Material
Various documents and internal material was used throughout the thesis. The purpose of collecting these documents is to understand and identify the current state at Scania. Four types of documents where collected, categorised into the following four categories:
Weekly-meeting records: data regarding amount of deviations, requiring action from DETP, reported from the work-team is stored digitally. This information is available in terms of weekly-meeting records found in Scania’s computer system.
• A total amount of 65 weekly meeting records from the period 2015-2016 were collected. Deviation-reports: Data regarding types of deviations is not stored neither digitally nor on paper. However, some production areas take own initiative to store the data on paper in terms of deviation-reports, see Appendix III: Deviation-Report Example.
• A total amount of 101 deviation-reports from the period 2013-2016 were collected. • 77 deviation-reports from production area 4, 22 deviation-reports from production area
6, and 2 deviation-reports from production area 7.
• The remaining production areas did not store any deviation-reports.
Internal material and earlier thesis projects were used to understand the process and to gain deeper and more holistic insight of the issue. Also internal materials were used to describe the background of this thesis, see context clarification in chapter 2.
Earlier and ongoing pre-studies regarding the issue/similar issues were studied. These earlier pre-studies were also used, having contact with the project participants, to set targets with the thesis project. Since it’s not preferable to conduct a thesis project overlapping with earlier/ongoing pre-studies, rather complement.
2.4.5.
Observations and Meetings
In direct observation, the researcher observes something without interacting, merely watching and taking in data (Yin, 2003). Observations are, according to Patel and Davidson (2011), the most common method for data collection in our daily lives based on random encounters. Further, Patel and Davidson (2011) argues that as a scientific method, observations cannot be random rather performed and planned in a systematic way.
Observations will be used in as an additional method in this study to further investigate certain parts of the interface between engine production and production preparation, for example meetings with different representatives. According to Andersen et al (1997), observations should be used early in a study to gain a clear view of the problem, thus in this study, observations are used throughout the study and as a follow-up method to the interviews. This approach is supported by Patel and Davidson (2011), stating that observations can be used as an explorative method in the early phase of a study but also to supplement information that have been gathered with other methods. Further, Patel and Davidson (2011) argues that observation as a method is suitable when investigating behaviours and activities in their natural situations, which is corresponding to the purpose of the empirical study.
Furthermore, Genchi Genbutsu, an observation meaning “go and see”, was performed. Genchi Genbutsu is a key principle of the well-acknowledged Toyota Production System, suggesting that in order to truly understand a situation, one needs to go and see the real place, where the work is done. Therefore, a “go and see” was performed at the assembly line for two days, in two different assembly stations, in order to understand the work-process and how deviations might occur.
2.4.5.1. Meetings
During the course of this thesis, the student has worked with DETP and actively been taking part in their daily and weekly meetings. This has enabled the student to sync up the proceeding of the thesis with the project and deliver the required data to the project team simultaneously.
Further meetings with various employees at Scania, e.g. Scania Production and Logistics IT, INAE were constantly occurring to discuss confusions and to brainstorm ideas.
2.4.6.
Workshops
To identify failure risks within DETPs work process, a P-FMEA, Process Failure Modes Effects Analysis, workshop was carried out. P-FMEA, is a systematic method by which potential failures of a product or process design are identified, analysed and documented. The group manager and all product engineers from DETP were invited and given the opportunity to attend. Before the workshop, the required material for the workshop was distributed and discussed with the participants. The participants represented the same unit at Scania, DETP, and in total, there were 8 participants out of 11 possible, 7 product engineers and the group manager attended. The participants were divided into 3 smaller groups (3/3/2), with a separate task for each group. The workshop was conducted in 4 hours, and documented by the researcher afterwards, (e.g. collecting used post-its). By way of introduction, the method P-FMEA together with the purpose and aim of the workshop were presented. The introductory presentation was
presented in one hour, to truly make sure that the participants understood the method and their task. The introduction was followed by a case practise where the participants read through and discussed all provided materials and the provided example P-FMEA in order to discuss any uncertainties.
The workshop ended with a full group discussion where every group presented their results from the P-FMEA exercise followed by questions and discussions. The workshop lead to direct response on relevant suggestions for improvements; and there was also a chance to discuss identified uncertainties as the employees had different opinions. After the workshop, the results were documented by the researcher digitally and finally completed together with the group manager.
2.5.
Data Analysis
Since this thesis has used both qualitative and quantitative data, different methods for analysing this data has been used. The data collected by quantitative methods is always numerical henceforth analysed using mathematical and statistical methods. There are a wide range of statistical techniques available to analyse this data, techniques used in this thesis are for example graphs and diagrams to find and visualise patterns in collected data.
Data collected by qualitative methods does however not involve numbers or numerical data, often involving words or language resulting in rich data that gives an in-depth picture, requiring therefore different analysis methods. Because qualitative data is drawn from a wide variety of sources, there can be radical difference in scope resulting in a wide variety of methods for analysis. In this thesis, structuring the data into groups and themes, highlighted in the literature, and comparing the data with the literature, has been the analysis method for the collected qualitative data. Furthermore, in order to best work out which method is right for this particular research, discussions with the supervisor has constantly been conducted to clarify the analysis method.
2.6.
Validity, Reliability and Objectivity
According to Björklund and Paulsson (2003), there are three measures of the credibility of a study:
• Validity – to what extent you actually measure what you intend to measure
• Reliability – the reliability of the measurements. If you repeat the study, will you get the same results?
• Objectivity – to what extent the values of the author and participants influence the results of the study.
Patel and Davidson (2011), claims that in every study, the effort must be to reach as high validity, reliability and objectivity as possible, thus with regards to resources and time available. Further, Patel and Davidson (2011) suggests one method, namely triangulation, which is commonly used to increase validity and reliability. Triangulation is basically used to indicate that two (or more) methods are used in a study in order to check the results of one and the same subject. This can be done in many different ways during data collection. Several different methods as interviews, observations and documents from different sources can be used to get a comprehensive view of the issue. For instance, if a respondent says a certain thing in an interview but does something contradictive during an observation that can be the basis for a deeper interpretation.
Further, triangulation can also be used by the researcher to validate the study using several data sources. For instance, interviewing different respondents with different perspectives of a certain phenomenon.
According to Björkman and Paulsson (2003), one method for increasing the objectivity of a study is to motivate different choices made during the study. Thus giving the reader a possibility to self-evaluate the objectivity and the results of the study.
The validity of the study has been ensured by having a dialogue with the supervisors, both at MDH and at Scania to confirm that the study is making the necessary progress related to the problem definition.
The study has also been triangulated to increase the validity and reliability by using different methods of collecting data. For instance, the respondent has been interviewing different perspectives on the phenomenon, product engineers, process engineers, group managers, team leaders, assemblers, all which have had their chance to express their perspective on the issue.
2.7.
Project Timeline
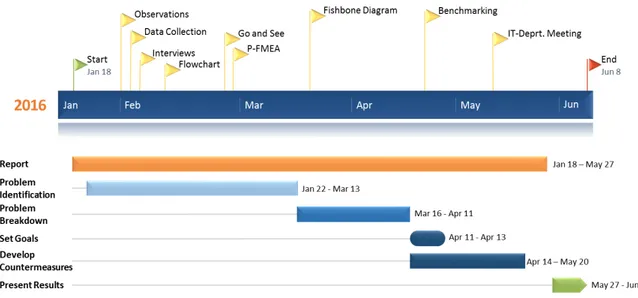
A basic visualisation of the project timeline is shown in figure 4. For a fully detailed project timeline, see Appendix IV: Time Plan.
Figure 4 – Project Timeline - Authors Figure
2.8.
Context Clarification
Scania, with sales and service organisations in more than 100 countries, net sales in 97.8 billion SEK and net income amounted to 6.7 billion SEK, is one of the world’s leading manufacturers of trucks and buses for heavy transport applications. Besides manufacturing customised heavy trucks and buses, Scania also manufactures engines for use in heavy vehicles, marine and industrial applications focusing on efficient, low-carbon solutions enhancing customer
profitability. Scania is aiming to be the leader in sustainable transport striving to build its business by creating value for customers, employees and society.
“With the aim to be the leader in sustainable transport, at Scania we are building our business while creating value for our customers, employees
and society. Delivering customised heavy trucks, buses, engines and services, our focus is on efficient, low-carbon solutions that enhance
customer profitability.” - Scania Annual Report, 2015, p. 2
2.8.1.
Scania Production System (SPS)
Scania Production System (SPS), originating from lean production, was introduced in the company in the mid-1990s. SPS can be seen as a base to meet customer needs, while achieving greater competitiveness, growth and profitability. Scania has visualised how different values, principles and priorities affect each other by means of a house, SPS house, see figure 5.
Figure 5 - Scania Production System (SPS) (BSEM, 2016)
The foundation of the house, the grey blocks, are representing Scania’s values, also called philosophies. These values are customer first, respect for the individual and elimination of waste (BSEM, 2016) Normal situation – standardised working method, continuous improvement, right from me and consumption controlled production are Scania’s four main principles that form the house’s floor, ceiling and walls. In the middle of the SPS house, one
finds Scania’s four priorities; safety/environment, quality, delivery and cost. All employees, throughout Scania should understand these values, principles and priorities in order to quickly take correct decisions.
2.8.2.
Product Engineering Engine Assembly (DETP)
Product Engineering Engine Assembly (DETP), is a supporting function of Scania Engine Production Assembly (DE). DE is a production unit where Scania Engines are produced and DETP acts as product technical support in DE and as a management resource in technical questions.
The aim with DETP:s operation is to contribute to the introduction of new or changed products at the lowest cost with the lowest possible environmental impact and with the right quality. DETP consists of 10 product engineers and one group manager. Performing many different tasks, just to mention a few examples, product engineers are producing work-orders (assembly instructions) to the assembly line, see Appendix V: Work-Order Example, and daily participating at the assembly line to control what deviations and difficulties are arising on or around the product.
2.8.3.
Problem Description
With an increased number of introductions (new engine introductions or continuous changes) and a constantly growing number of engine variants (increasing number of customer choices, today 200 customer choices), DETP needs new work-methods to deal with the new demands from the outside world.
Today there is no comprehensive method or tool to be used to proactively assure the quality of the output from product engineers. The output may be checked manually, e.g. by letting a colleague control the work to ensure that everything is correct or by visually controlling a preview.
DETP is today obtaining deviation-reports when deviations are caused at the assembly line, however, since deviations are discovered only when occurred it is a reactive job and does not correspond to Scania’s strategic goal of having zero deviations.
With this thesis project, DETP is requesting a method or a tool to proactively assure the quality of work-orders produced from their internal production system MONA. The following process is suggested:
1. Current-state analysis
2. Develop and utilise existing tools and work-methods
3. Suggest an automated system for improving the quality of the output from product engineers
3.
Theoretical Framework
This chapter presents the theoretical framework which is part of the underlying basis supporting the results of the thesis. The chapter begins with basic definitions of quality and describes concepts of quality management.
3.1.
Quality Definition and Strategic Issue
According to earlier research, quality is an important aspect in business strategy and provides competitive advantage (Peris-Ortiz, 2015). Since this thesis has a focus on quality and quality management, these areas need to be defined and described as a basis to discuss implications and methods that concern quality.
According to Kehoe (1996), in order to understand the fundamental concepts of quality, the starting point is to understand the meaning of the term “quality” itself. Despite the fact that it might seem elementary, since the word “quality” is a well-recognised word and in general speech used to describe excellence, value, reliability or goodness, it’s important to clarify the definition for this thesis. However, this is not a simple task since up until now, earlier research has been unable to arrive at a single definition of quality.
A definitional example of the term “quality” is The Oxford English dictionary’s definition (Kehoe 1996):
“(Noun) Degree of excellence, relative nature…” – Kehoe, 1996, p. 29
Further examples, Garvin (1984) identified five major approaches to the definition of quality, and disciplines in which they are rooted. Reeves and Bednar (1994) identified similar definitional approaches to quality and concluded that a global definition of quality does not exist. Explaining that different definitions of quality are appropriate under different circumstances.
Furhter, J.Fox (1993) mentions multiple different definitions of quality thus highlighting The International Standards Organisation’s, ISO, definition of quality. ISO, which has published over 21000 international standards documents (ISO, 2016), presented their definition of quality in its ISO 8402 Quality Vocabulary document as:
“The totality of features and characteristics of a product or service that bear upon its ability to satisfy stated or implied needs.” – ISO, 2016
Moreover, other definitions of quality written by various well-acknowledged writers, so called gurus in quality, are:
“Fitness for purpose or use.”- Juran, 1999, p. 19
Or Feigenbaum’s definition:
“The total composite product and service characteristics of marketing, engineering, manufacture and maintenance through which the product and
service in use will meet the expectation by the customer.” – Feigenbaum, 1986, p. 238
And lastly Crosby’s definition of quality:
“Conformance to requirements.” – Crosby, 1989, p. 58
Nevertheless, Kehoe (1996) argues that when it comes to any business, the concept of quality needs to be more precisely understood and clearly interpreted by everyone in the organisation. An important realisation is that quality seems to be a multi-dimensional construct (Garvin, 1984; Hjorth-Anderson, 1984). All these definitions are worth considering together since they can be complementary. Each definition emphasizes on a particular point which is only implicit in the others. Some definitions are brief, e.g. Juran’s definition, while others more expansive, e.g. ISO-definition. ISO-definition is for instance emphasising on the totality of quality considerations which together satisfy all needs, whether expressed or taken for granted. Feigenbaum’s definition reveals that the customers are those whose criteria of need, fitness and expectation are being addressed. Further highlighting four key divisions, marketing, engineering, manufacturing and maintenance as significant to business. Meaning quality has different function in each one of those divisions. Also, a similarity between both ISO and Feigenbaum is their highlight on the definition being applied equally to a manufactured product and to a delivered service. Finally, despite definitional differences, what is common, in matters of quality, the customer is indeed always right. What the manufacturer feels the customer should want, or what the manufacturer believes they are getting, is irrelevant.
When evaluating quality of a production preparation process, the most important aspect is that specifications are met J.Fox (1993). Therefore, the definition stated by Crosby (1989), conformance to requirements, is used in this thesis since it is considered the most appropriate definition of quality for the study.
3.2.
Quality Management (QM)
Kehoe (1996) explains how quality management has become incredibly important as a result of an increasing global competition. Arguing that the international markets for many products are now very mature since products/services offered by different companies from different countries are basically the same. This results in an increasing competition for better quality of the product or service. Also, Kehoe (1996) argues that the conflict between quality and cost does not exist in organisations since they are realising that in the long term, quality actually costs less.
Having expressed different definitions of the term “quality”, and the importance of managing it, naturally the following question is how can quality be managed? According to (Sousa & Voss, 2002), quality management was born with the core ideas of W. Edwards Deming, Joseph Juran, Philip Crosby and Kaoru Ishikawa. Further claiming that it has become an all-pervasive management philosophy in most of today’s business society and is here to stay.
Dean & Bowen (1994) defines quality management as a
“philosophy or an approach to management with a set of mutually reinforcing principles, each of which is supported by a set of practices and techniques”- Dean & Bowen, 1994, p. 2
Watson and Korkukonda (1995) however states that since quality management has become embedded in more and more organisations, it means different things to different people. What’s important is that quality is vital to the prosperity of businesses, J.Fox (1993) argues that the management functions planning, organising, motivating and controlling, must be exercised in pursuit of quality in every department and activity of a company. J.Fox (1993) explains that it is necessary for a company to have conscious and coherent “quality
management system” in order to achieve this.
Sousa & Voss (2002) compared five major studies in QM, concluding that there is substantial agreement as to the set of constructs classified under the scope of QM. According to Sousa & Voss (2002), the agreement in the literature on what constitutes QM indicates that QM as a field has indeed matured and is laid down on solid definitional foundations.
3.3.
Total Quality Management (TQM)
According to Summers (2010) TQM can be summarised as a management system for customer-focused organisations that involves all employees in continual improvement. It uses strategy,
data, and effective communications to integrate the quality discipline into the culture and activities of the organisation.
Total Quality Management, TQM, is a phenomena expressing companies that consider quality as an integrated strategic function of the overall organisation (Bergman & Klefsjö, 2007; Kiella & Golhar, 1997; Morris, 1989). Summers (2010, p. 12) defines TQM as; “a management approach that places emphasis on continuous process and system improvement as a means of achieving customer satisfaction to ensure long-term company success”.
With a long and complex history, from the industrial revolution to present day, the quality movement has not surprisingly been interpreted in several different ways. Some highlights four relatively distinct phases, some identifies two different movements evolving more or less in parallel, while some highlights a more continuous improvement (Garvin, 1988; Kanji & Ascher, 1993; Dale, 1999 and Dahlgaard et al., 1998).
Yet, the most common description of way which quality and quality improvements have evolved into the present day Total Quality Management (TQM), is that which identifies the four different phases or stages illustrated in figure below: Quality Inspection (after production), Quality Control (during production), Quality Assurance (before production) and Total Quality Management (continuous improvements before, during and after production) (Garvin, 1988; Kanji & Ascher, 1993; Dale, 1999 and Dahlgaard et al., 1998).
The fourth and the current stage as seen in figure 6, Total Quality Management, TQM, involves understanding and
implementing quality management principles and concepts in every aspect of an organisation. This development has been described by Bergman & Klefsjö (2003, p. 34) as “a constant endeavour to fulfil,
or preferably exceed customer needs and expectations at the lowest cost, by continuous improvements work, to which all involved are committed, focusing on the processes in the organisation”.
According to Dale (1999), visualised in figure 7, values, tools and methodologies are used in TQM in order to improve the organisation continuously. A similar approach is from Shiba et al. (1993, p. 89) arguing that “Total Quality Management (TQM) is an evolving system of practices, tools, and training methods for managing companies to provide customer satisfaction in a rapidly changing world”. In this thesis however, the definition of TQM used is the development of Hellsten & Klefsjö (2000, p. 27) defining TQM as “a management system in continuous change and consisting of values, methodologies and tools, the aim of which is to increase external and internal customer satisfaction with a reduced amount of resources”.
Figure 7 – Values, Methodologies and Tools in TQM (Dale, 1999)
3.3.1.
Values
An organisations core values are the basis of its culture (Hellsten & Klefsjö, 2000). These core values underpin the basis of succeeding with TQM (Bergman & Klefsjö, 1995). Despite that literature offers a whole variety of suggestions for the values of TQM, roughly, the values presented in earlier literature are the same as those summarized by Bergman & Klefsjö (1995). Also further similar values with considerable agreement with the values presented can be found in (Boaden, 1997; Cameron & Sine, 1999; Dale et al., 2001; Hellsten, 1997 and Sila & Ebrahimpour, 2002).
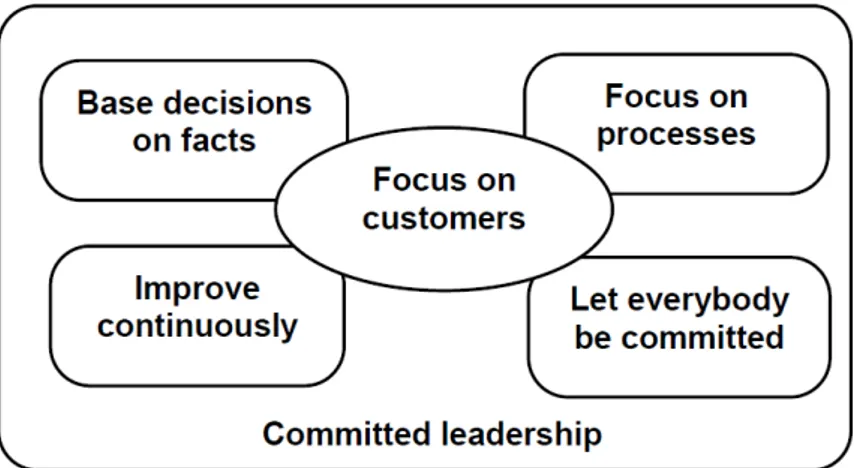
The values presented by Bergman & Klefsjö (1995), as seen in figure 8, are committed leadership, focus on customers,
basing decisions on facts, focusing on processes, continuously improving and letting everybody be committed. These are some of the most recognised core values of TQM (Hellsten & Klefsjö, 2000) and are presented briefly below.
3.3.1.1. Committed Leadership
Working with TQM and keeping up the quality improvements requires total management commitment (Dale et al., 1999; Abraham et al., 1999). According to Dale (1999), the senior management has the responsibility and must initiate planning for implementation and participate in the work including evaluation of processes and results. All senior leaders in the organisation must create a customer orientation and set clear organisational environment and visible quality values in which TQM can achieve its potential. The importance of the role of senior managers as advocates, teachers and leaders cannot be overstated (Tenner & DeToro, 1992). Oakland (1989) explains that TQM must start with these leaders as they must serve as role models throughout the organisation, thus reinforcing the quality values organisation-wide by choosing and applying appropriate techniques and tools.
3.3.1.2. Focus on Customers
Focusing on customers is highlighted by most authors of TQM literature. In fact, it is highlighted as a central core value in TQM, meaning that all products and processes should always have customer focus (Shiba et al., 1993). Earlier research (Oakland, 1989; Tenner & DeToro, 1992; Shiba et al., 1993; Dahlgaard et al., 1994; Bergman & Klefsjö, 2003), explains that quality should be valued by the customers and be put in relation to their needs and expectations. Further, Tenner & DeToro (1992) explains that the organizations need to be dedicated to satisfying customers with continuous and long-term effort since the quality of a product can be experienced as strongly weakened if a competitive product with better characteristics enter the market. Focus on the customer means, therefore, that there is a strive
for finding out what the customers’ need and what they to fulfil their expectations while systematically developing and manufacturing the product (Dahlgaard et al., 1994).
According to Bergman and Klefsjö (2001), focusing on the customer does not only apply to the external customers. Rather both internal and external customers since every employee has customers within the organization and in order to perform a great job their needs also have to be fulfilled. Further claiming that in order to satisfy external customers, the internal customers also need to be satisfied (Oakland, 1989; Tenner & DeToro, 1992; Shiba et al., 1993; Dahlgaard et al., 1994; Bergman & Klefsjö, 2003).
3.3.1.3. Base Decisions on Facts
An important element in TQM is to make decisions which are based on fact that are well founded and not allow random factors to be a decisive importance (Bergman & Klefsjö, 1994). Deming (1994) argue that speculation or opinion has no place as basis of decision-making highlighting for instance the importance of knowledge regarding variation and ability to handle and control variation. This underlines importance of that the production processes are based on facts related to the customers’ experiences plus customers present and future needs (Bergman & Klefsjö, 2003). Dale (1999) explains that utilising different efficient statistical tools, as the seven quality control tools and the seven management tools, can help obtain, organise and analyse these facts of customer satisfaction.
Bergman & Klefsjö (2003) also highlight the importance of having a clear purpose of the data collection. Before obtaining data it’s important to question what the problem is and what facts are needed. Also stating that the above mentioned statistical tools for processing data can help tackle process variation and reduced it in a good manner. Bergman & Klefsjö (2003) more importantly highlight the importance of an active search for information to be complied and analysed.
To analyse and structure numeric information there are seven quality improvement tools. These are control charts, pareto diagrams, scatter plot, data collection, histograms, stratification and cause-effect diagrams. However, it is not only numerical facts that should be compiled. Verbal information, such as views, descriptions, events and feelings, is of great importance. The seven management tools can be used to structure and analyse this type of information. These are tree diagrams, matrix diagrams, process decisions charts, matrix data analysis, activity network diagrams, interrelation diagraph and affinity diagrams. See Dale (1999) for a more detailed description of these tools.
3.3.1.4. Focus on Processes
Nearly every organised activity within an organisation can be looked upon as a process, which means a repetitive sequence of activities (Bergman & Klefsjö, 2003). The goal of the process is to produce products or services, which satisfy its customers (Bergman & Klefsjö, 2003). The consequence of focusing on processes is that the focus is not on results. Instead the result is the dependent variable. The result comes from whatever process is followed, process drives result (Shiba et al., 1993). The process generates data indicating how the process is satisfying its customers. Meaning that we should not look upon every single piece of data, for instance every single customer complaint, as something unique but as part of statistics, which give information about how well the process is working and how it can be improved (Bergamn & Klefsjö, 2003).
3.3.1.5. Improve Continuously
It is not enough for an organisation to do better than it did previously. The external demands an organisation faces are continuously increasing and therefore, organisations are required to continually improve the quality of its production processes in order to survive (Bergamn & Klefsjö, 2003). The continuous improvement of the process leads to customer satisfaction, which results in an external quality improvement (Dahlgaard et al., 1994). Moreover, Dahlgaard et al. (1994) explains that the continuous improvement of the production process also leads to fewer defects, which results in an internal quality improvement
The Deming cycle, or the PDCA-cycle, is a model for process analysis and improvement and serves as a symbol for continuous improvement. The PDCA-cycle is composed of the four stages: plan, do, check and act (Deming, 1994). PDCA-Cycle is below methodologies discussed further in this chapter.
3.3.1.6. Let Everybody Be Committed
In order to ensure that the organisations quality strategy is to be successful, all of the organisations employees should be commited in the work of satisfying the customer and to continuous quality improvement (Bergman & Klefsjö, 1994). Moreover, everybody’s commitment means that continuous improvement should be practised everywhere in the processes and that the involvement of all employees at every level should be facilitated (Tenner & DeToro, 1992; Bergman & Klefsjö, 1994). The work is based on the skills and participation of every employee and his or her understanding of what is required. Educating and training all employees provides the knowledge needed on the mission, vision, direction, and strategy of the