Materials. This paper has been peer-reviewed but does not include the final
publisher proof-corrections or journal pagination.
Citation for the published paper:
Olsson, Pär; Hyldgaard, Per; Schröder, Elsebeth; Persson Jutemar, Elin;
Andreasson, Eskil; Kroon, Martin. (2018). Ab initio investigation of
monoclinic phase stability and martensitic transformation in crystalline
polyethylene. Physical Review Materials, vol. 2, issue 7, p. null
URL: https://doi.org/10.1103/PhysRevMaterials.2.075602
Publisher: American Physical Society
This document has been downloaded from MUEP (https://muep.mah.se) /
DIVA (https://mau.diva-portal.org).
Preprint of: Ab initio investigation of monoclinic phase stability and martensitic
transformation in crystalline polyethylene
By: Olsson, Pär A. T.: Hyldgaard, Per: Schröder, Elsebeth: Persson Jutemar, Elin:
Andreasson, Eskil: Kroon, Martin.
Published in:
Physical Review Materials (2018), Volume 2, Article-id 075602.
DOI:
https://doi.org/10.1103/PhysRevMaterials.2.075602
Published: 2018-07-10
Citation for published version:
Olsson, P. A. T, Hyldgaard, P., Schröder, E., Persson Jutemar, E., Andreasson, E. &
Kroon, M. (2018). Ab initio investigation of monoclinic phase stability and martensitic
transformation in crystalline polyethylene. Physical Review Materials, 2, 075602.
Link to published paper:
Ab initio investigation of monoclinic phase stability and martensitic transformation in
crystalline polyethylene
P¨ar A. T. Olsson,1, 2, ∗ Per Hyldgaard,3 Elsebeth Schr¨oder,3 Elin Persson Jutemar,4 Eskil Andreasson,4, 5 and Martin Kroon6
1Materials Science and Applied Mathematics, Malm¨o University, SE-205 06 Malm¨o, Sweden 2Division of Mechanics, Lund University, Box 118, SE-221 00 Lund, Sweden
3Department of Microtechnology and Nanoscience (MC2),
Chalmers University of Technology, SE-412 96 Gothenburg, Sweden
4Tetra Pak, Ruben Rausings gata, SE-221 86 Lund, Sweden
5Department of Mechanical Engineering, Blekinge Institute of Technology, SE-371 79, Karlskrona, Sweden 6Department of Mechanical Engineering, Linnaeus University, SE-351 06 V¨axj¨o, Sweden
(Dated: July 16, 2018)
We study the phase stability and martensitic transformation of orthorhombic and monoclinic polyethylene by means of density functional theory using the non-empirical consistent-exchange vdW-DF-cx functional [Phys. Rev. B 89, 035412 (2014)]. The results show that the orthorhombic phase is the most stable of the two. Owing to the occurrence of soft librational phonon modes, the monoclinic phase is predicted not to be stable at zero pressure and temperature, but becomes stable when subjected to compressive transverse deformations that pin the chains and prevent them from wiggling freely. This theoretical characterization, or prediction, is consistent with the fact that the monoclinic phase is only observed experimentally when the material is subjected to mechanical loading. Also, the estimated threshold energy for the combination of lattice deformation associated with the T1 and T2 transformation paths (between the orthorhombic and monoclinic phases) and chain shuffling is found to be sufficiently low for thermally activated back transformations to oc-cur. Thus, our prediction is that the crystalline part can transform back from the monoclinic to the orthorhombic phase upon unloading and/or annealing, which is consistent with experimental observations. Finally, we observe how a combination of such phase transformations can lead to a fold-plane reorientation from {110} to {100}-type in a single orthorhombic crystal.
PACS numbers:
I. INTRODUCTION
The mechanical properties of semi-crystalline polymers are largely dictated by the microstructure and degree of crystallinity of the polymer, which can vary substantially depending on the manufacturing technique and process settings. This is attributed to the fact that the mechan-ical response of the crystalline and amorphous regions are widely different, and their respective parts interplay and jointly contribute to the macroscopic properties. In terms of yielding, typically the amorphous parts are duc-tile and can accommodate substantial amounts of strain before rupture, and the crystalline parts behave in a more brittle manner with the plastic deformations constrained by preferential crystallographic orientations [1–4]. Thus, by varying the content of such phases and the process strategy, widely different mechanical properties of semi-crystalline polymers can be obtained [1, 5], which compli-cates the prediction of the mechanical response. In light of the large number of industrial applications for such materials, ranging from light-weight components in the automotive industry to sealing screw caps for beverage and food packages, this issue inhibits the capability to
∗Electronic address: Corresponding author. Par.Olsson@mau.se
optimize the product performance and to minimize the material expenditure.
The microstructure of high-density linear polyethylene (PE) typically consists of a spherulitic semi-crystalline arrangement with alternating crystalline lamellae and amorphous layers [6]. Under normal conditions the lamellae structures are commonly lozenge shaped crys-tals with the polymer chains ordered according to an orthorhombic unit cell, arranged such that the crystal side surfaces are terminated by {110}-faces, while the lamella surface normal direction coincides with the [001]-direction [6]. The polymer chains are folded back and forth into the lamellae multiple times, such that they are primarily aligned parallel to the orthorhombic c-axis. This implies that bonding in the c-direction is dominated by strong covalent bonding, whereas weak van der Waals (vdW) interaction is the predominant bonding type in the transverse directions. The lamellae are intercon-nected via tie-molecules that extend through the amor-phous region to the neighbouring lamella and possibly even further. Such tie-molecules and entangled poly-mer segments are responsible for holding the polypoly-mer together. The density of the polymer and the molecular structure depend on the manufacturing technique and process timings, but the size of the crystalline lamellae thickness typically lies in the range 3-25 nm whereas the lateral dimensions can reach up to 50 µm [6–9].
of semi-crystalline polymers is a non-trivial task, since it involves the interplay of mechanisms at different length scales [2]. Yielding of amorphous polymers is character-ized by slippage of the random chains, and the response depends strongly on the chain entanglements. On the other hand, for crystalline PE three important crystal plastic mechanisms have been identified: (i) slip [8–21], (ii) twinning [8, 13, 22–24] and (iii) martensitic transfor-mation [8, 16, 22, 23, 25–31].
The occurance of martensitic transformation in poly-mer crystals was initially indicated by the observation of extra reflections in X-ray and electron diffraction pat-terns when studying deformed crystals [22, 26–29, 32]. It was found that the orthorhombic crystal transforms into that of a monoclinic lattice [26]. Because such transfor-mations typically cannot accomodate the same amount of strain as slip, the deformations are primarily found to accompany the early onset of yielding for situations when slip is geometrically unfavourable. Thus, to facilitate the slip, the crystal reorients to restore the geometrical orien-tation such that glide can be initated [9]. Owing to the chain orientation and the covalent nature in the chain direction, martensitic transformations of crystalline PE occur exclusively by transverse deformations in the plane perpendicular to the chain direction. The most plausible modes and those observed experimentally belong to the T1 and T2 families of transformation [16, 22, 23, 26] (re-ferred to as A and B, respectively, in [26]), which require the least amount of shearing strain. Despite their fre-quent experimental observation, knowledge of the tran-sition strain energy and chain shuffling activation energy remains unknown, which partly motivates this study.
Beside these issues, the mechanical stability of the monoclinic phase is a subject of debate. Experiments have indicated that the monoclinic structure may be metastable or unstable and is present only when it is subjected to stress. This conjecture is based on the ob-servation that deformed crystals transform back to the orthorhombic structure upon relaxation and/or anneal-ing [33–35]. Based on X-ray diffraction experiments, the mechanism by which the monoclinic phase trans-forms back to the orthorhombic phase upon anneal-ing has been investigated [34]. It has been found to concur with that of the propagation of the orthorhom-bic(110)/monoclinic(010) interface towards the mono-clinic side of the crystal, in accordance with the pre-dictions of the T1 and T2 transformation mechanisms. Moreover, the fold-planes of lamellae have been found to change from {110} to {100} post-annealing. Such behaviour could be an implication that the monoclinic structure is merely an intermediate configuration to ac-commodate fold-plane transformations [7, 8, 36]. Hence, the stability of the free-standing monoclinic phase re-mains elusive, which merits further investigation.
In the present work we address these issues through a theoretical atomistic exploration of the orthorhombic-to-monoclinic phase transition and a discussion of its im-portance for understanding mechanically induced phase
transitions in the PE system. Primarily, we seek to an-swer three questions with our computational analysis: (i) How are the preferential martensitic transition paths between the orthorhombic and monoclinic phases char-acterized in terms of threshold energy, chain shuffling as well as strain energy and volume conservation? (ii) Under what conditions is the monoclinic phase stable? (iii) What is the nature of the stabilization of the or-thorhombic phase at zero pressure? For the first issue, we compute the strain energy landscape associated with the martensitic transformation and the activation energy connected with chain shuffling. Such knowledge and data provide valuable discrete dislocation and crystal plastic-ity input for macroscopic modelling. For the second, we study the phonon characteristics with the intention to characterize whether the monoclinic phase is stable or not. For the third question, we correlate the phase dif-ferences in cohesive energies with the changes emerging in the electron density variation and with the variation in the inter-chain vdW bonding.
Our analysis is based on first-principle density func-tional theory (DFT) using the vdW density funcfunc-tional (vdW-DF) method [37–39] in the recent consistent-exchange formulation vdW-DF-cx [39, 40]. This non-local correlation functional is based on rigorous physical insight and can be expected to be transferable with the capability to provide robust predictions of materials be-haviour, free of all experimental input. The vdW-DF-cx applicability is documented for the PE system and it al-lows us to detail the nature of the molecular movement that is associated with the martensitic phase transforma-tion [21].
The remainder of the paper is organized as follows. In Sec. II we introduce the simulation setups and pro-vide computational details. Results are presented and discussed in Sec. III and IV, respectively, while Sec. V contains our summary and conclusions.
II. SIMULATION SETUP AND
COMPUTATIONAL DETAILS
A. Investigated phases
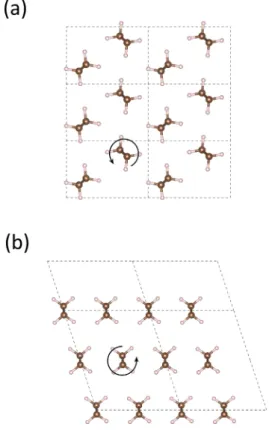
The two phases considered in the present work cor-respond to the orthorhombic (P nam space group) and monoclinic (C2/m space group) phases, see Figure 1(a) and (b), respectively. X-ray and neutron diffraction mea-surements at ambient temperature (4-90 K) have re-vealed that the experimental orthorhombic lattice pa-rameters correspond to a = 7.12 − 7.42 ˚A, b = 4.85 − 4.96 ˚
A and c = 2.54 − 2.55 ˚A [42–45], where the latter di-mension is aligned with the polymer chain direction. As depicted in Figure 1(a), the molecular units are arranged such that the chains are rotated by about 45°relative to the horizontal axis and nearest neighbouring chains are rotated about 90°relative to each other.
3
FIG. 1: Illustration of the considered transformation paths from orthorhombic to monoclinic PE viewed along the chain direction. The primitive cells are indicated by the dashed lines. (a) The solid lines indicate the initial supercells for the T12 and T21 transformation paths and the {110} and {100}
planes of the orthorhombic lattice. (b) Illustration of the final states of monoclinic PE for the transition paths. The solid lines indicate the supercells and the {010} and {100} planes of the monoclinic lattice. (c) Definition of the supercell vectors a∗ and b∗ and the tilt angle β. (a) and (b) were generated
using the VESTA code [41].
parameters, a = 8.09 ˚A, b = 4.79 ˚A and c = 2.53 ˚A with the tilt angle corresponding to 108°[22], cf. Figure 1(b). However, it should be noted that given the notion that the monoclinic lattice is metastable/unstable this data may not correspond to that of zero pressure. The molecular units in the monoclinic unit cell are arranged such that the neighbouring chains along the horizontal axis in Figure 1(b) are rotated by 180°.
To determine the optimal lattice parameters for the two phases, we performed semi-relaxed DFT calculations to find the configuration that minimizes the ground state energy. To this end we incrementally varied the lattice parameters and the tilt angle, while allowing all atomic coordinates to relax fully. A conventional relaxation scheme with concurrent stress and atomic coordinate
re-laxation was not performed due to the fact that the elas-tic constants vary significantly (by more than one order of magnitude) in the chain and transverse directions, which made it hard to obtain convergence for the stress relax-ation.
B. Phase transformation
In the present work we consider two types of marten-sitic transformations: T12and T21[16, 22, 23] (hereafter referred to as T1 and T2, respectively). Because the tran-sitions in general are non-affine, the molecular units do not follow the Cauchy-Born rule [46], which suggests that the atomic positions cannot be directly mapped along with the deformations. This can be realized for instance by the fact that the nearest neighbour molecular units for the monoclinic phase are rotated by 180°relative to each other, whereas those of the orthorhombic phase are rotated by about 90°, see Figure 1. Hence, we adopted a procedure that enabled us to estimate the strain en-ergy associated with lattice deformations and the chain shuffling activation energy. For the first part we mapped out the ground state energy for different combinations of lattice parameters and tilt angles. Because different molecular chain configurations can minimize the ground state energy for different amounts of strain we tried dif-ferent initial guesses of the rotational angle around the chain axis for each molecule for each configuration. From this initial state we let the atomic coordinates relax fully while fixing the supercell, such that the atoms were al-lowed to reach equilibrium for each strain increment. This way we improved the basis for finding the optimal molecular chain configuration for each strain increment, which enabled the identification of the minimum energy lattice deformation path.
Alternative representations of the orthorhombic unit cell are needed depending on the transformation mode considered. Therefore we defined the supercell vectors a∗and b∗, and the tilt angle β to describe the transverse extension of the supercell, as depicted in Figure 1(c). For the T1 transformation, we utilized a supercell for the ini-tial state that had twice the volume of the primitive cell, as seen in Figure 1(a). For this representation the pla-nar supercell vectors a∗ = (a, b, 0) and b∗ = (−a, b, 0) were used. From the experimental lattice parameters, β can be computed to be 112°for this representation. The other supercell depicted in Figure 1(a), corresponds to the initial state for the T2 transformation, for which the supercell vectors are a∗ = (−a, b, 0) and b∗ = (0, b, 0). This implies that the tilt angle between the supercell vec-tors initially is 124°. For the final state of T1 we double the volume of the monoclinic primitive cell by letting b → 2b, see Figure 1(b), such that it complies well with the initial state. These representations of the orthorhom-bic and monoclinic lattices were chosen on the basis that they can be used to model the phase transition, which is reflected by the fact that the tilt angles between the
supercell vectors of the initial state are similar to those of the final state.
In principle there are three parameters that need to be varied to fully cover the space of possible transition paths: the lengths of the supercell vectors a∗ and b∗ and the angle β between them. However, to visualize the strain energy landscape we reduce the number of parameters to two by making the third linearly dependent on the others, which requires some elaboration. For T1, because β only changes very little (from 112°for orthorhombic to 108°for monoclinic) we primarily vary the lengths of the supercell vectors independently to fit those of the orthorhombic and monoclinic phases. To ensure that we concurrently change the tilt angle we vary it linearly with the length of b∗. For the T2 transition path, we use an alternative representation to describe the deformation path. Because the length of b∗ only changes from about 4.89 to 4.79 ˚
A when transforming from orthorhombic to monoclinic, we instead map the strain energy landscape by varying the length of a∗ and β. To make sure that the lattice parameters of the optimal lattices are met, the length of b∗is varied linearly with β.
To account for the energy required to perform chain ro-tations, we used the nudged elastic band (NEB) method [47, 48] to compute the activation energy needed for a sin-gle chain to rotate in the orthorhombic (see Figure 1(a)) and in the monoclinic molecular configurations (see Fig-ure 1(b)). This approach allowed us to quantify whether the elastic or rotational energies dominate the transfor-mation and enabled us to investigate if the required com-bined activation energy is low enough for the back tran-sition to be thermally activated.
C. Computational details
All DFT simulations in this work were performed us-ing the open-source plane-wave based Quantum Espresso (QE) software suite [49, 50]. For describing the electron-ion interactelectron-ion we used the ultrasoft pseudopotential ap-proach [51, 52] with the electron description for C com-prising the 2s22p2 states, while that of H consisted of a 1s1 electron. We chose the kinetic energy cutoff for the plane-wave basis set and k -point density such that the ground state energy was converged to within less than 1 meV/CH2-unit. To achieve this, we used a kinetic energy cutoff of 60 Ry (1 Ry = 13.6 eV) and the energy cutoff for the electron density is set to 600 Ry. We utilized a k-point grid for the first Brillouin zone of the orthorhombic primitive cell corresponding to a Γ-centered 6 × 6 × 12 sized grid (for the reciprocal a × b × c lattice), gener-ated by means of the Monkhorst-Pack method [53]. This was found sufficient to produce well converged results. The k-point mesh for the supercell used for the mon-oclinic primitive cell was made commensurate with the orthorhombic primitive cell.
For the phonon calculations we adopted the density functional perturbation theory approach as implemented
FIG. 2: Schematic illustration of supercell size and the chain shuffling considered for the NEB calculations of the (a) or-thorhombic and (b) monoclinic phase.
in QE [54]. To prevent boundary induced artefacts from the periodic conditions, phonons were computed using supercells with twice the volume of the primitive cell, i.e. those depicted to the left in Figure 1(a) and (b) for the orthorhombic and monoclinic phases, respectively. The dynamical matrices and force constants were computed and evaluated on a 2 × 2 × 6 q-point grid, from which the phonon dispersion curves were interpolated. To improve the accuracy of the computed force constants, we enforce the acoustic sum rule. The explicit algorithm that is used for this purpose is a subspace projected approach for finding the optimal solution of the coupled acoustic sum rules, as outlined by Mounet [55]. This modelling strategy and employed q-point density was found to yield well-converged phonon data.
For investigating the threshold energy associated with chain rotation in the orthorhombic and monoclinic phases, we used the NEB method [47, 48] to obtain the activation energy. For the simulations we study the grad-ual rotation of a single chain from 0°to 180°around the axis through the chain’s centre of mass, as illustrated in Figure 2. To this end we utilized eleven (one initial, nine intermediate and one final) images to represent the grad-ual rotational movements. To avoid artefacts emanating from finite size we considered relatively large supercells with sides not smaller than 14 ˚A, as shown in Figure 2. Moreover, to prevent unnaturally high repulsion from the neighbouring chains that may corrupt the results, we
5 allowed all atoms in the supercell to undergo relaxation.
This approach, combined with the chosen supercell sizes, was found to yield an activation energy converged within less than 5 meV/CH2accuracy, which is sufficient for the present investigation.
The choice of exchange-correlation functional for soft and sparse matter is a delicate issue that requires some elaboration. Since modelling of the martensitic transformation and phonons in PE are typical soft- or sparse-matter problems, we needed to employ a suitable exchange-correlation functional for an accurate descrip-tion of the interatomic interacdescrip-tion. Owing to the im-portance of vdW interaction in the considered system, a formulation of the vdW-DF method [37, 38, 56–60] was considered appropriate.
In the present work we used the recent consistent-exchange vdW-DF-cx formulation [40]. There are for-mal arguments to expect a high degree of transferability for this non-local exchange-correlation formulation, also when materials (such as PE) combine regions with both dense and sparse electron concentrations [39, 59]. Also, it has shown high predictive capabilities in terms of repro-ducing the librational phonon modes of organic crystals [61] and robustness when it comes to providing restor-ing forces for strained bond lengths [62]. For the case of PE, the vdW-DF-cx functional has shown an ability to predict both the lattice parameters and elastic con-stants of orthorhombic PE in good agreement with ex-perimental data, where local or semi-local formulations, such as conventional LDA or GGA, fail [21]. Finally, as demonstrated below, in the present work we observed a good agreement between experimental and vdW-DF-cx characterizations of the orthorhombic phonon data. These traits suggest that vdW-DF-cx is a suitable func-tional choice for the all-theory characterization of the PE martensitic transformation and relative phase stability that we pursued here.
III. RESULTS
A. Ground state data
The results of the lattice optimizations show that the difference in ground state energy (without zero point cor-rection) between the two phases is about 1.5 meV/CH2 -unit in favour of the orthorhombic phase. This concurs with the fact that the orthorhombic lattice is most com-monly observed. For this phase we have summarized the optimal lattice parameters in Table I together with com-puted and experimental data from other sources. The obtained results are found to agree quite well with the experimentally measured data. For the initial configu-ration of the T1 transformation, β corresponds to 110°, agreeing well with the experimental data of 112°.
Like-TABLE I: Computed and experimentally measured lattice pa-rameters and one of the elastic constants (C11) of the
or-thorhombic system. The data is presented in ˚A and GPa, respectively. Source a b c C11 DFT (vdW-DF-cx, this work) 7.19 5.02 2.55 9.0 DFT (LDA, [63]) 6.73 4.53 2.52 DFT (LDA, [64]) 6.75 4.65 2.53 16.0 DFT (LDA, [65]) 6.55 4.45 2.52
DFT (PBE-GGA, this work) 8.13 5.59 2.56
DFT (PBE-GGA, [63]) 8.28 5.64 2.57 DFT (PBE-GGA, [64]) 8.43 5.57 2.56 DFT (PBE-GGA, [65]) 7.30 5.02 2.57 39.2 DFT (vdW-DF, [66]) 7.30 5.22 2.57 DFT (vdW-DF, [67]) 7.34 5.19 2.58 DFT (vdW-DF2 [67]) 7.05 4.98 2.58 DFT (DF-C09 [67]) 6.84 4.76 2.55 DFT (DF-optB88 [67]) 6.93 4.85 2.56 DFT (DF-optB86b [67]) 6.95 4.86 2.56 DFT (revDF2 [67]) 6.97 4.88 2.56 DFT (rVV10 [67]) 6.90 4.77 2.56 Exp (X-ray, 77 K [44]) 7.42 4.96 -Exp (X-ray, 77 K [42]) 7.39 4.93 2.54 Exp (Neutron, 4 K [43]) 7.12 4.85 2.55 Exp (Neutron, 90 K [43]) 7.16 4.87 2.55 Exp (Neutron, 10 K [45]) 7.12 4.84 -Exp (Neutron, 300 K [45]) 7.42 4.94 -Exp (Phonons, [68]) 11.5 Exp (Ultrasonic, [69]) 8.4
wise for the initial T2 configuration the tilt angle becomes 125°, which agrees with the experimental data of 124°.
Compared with the vdW-DF-cx results, the general ob-servation is that the LDA data underestimate the trans-verse lattice parameters (i.e. a and b) by the order of 0.5 ˚
A. This deficiency is believed to be due to the well known overbinding and the lacking of weak vdW forces [75, 76], which limit the applicability in sparse matter. Depend-ing on the literature source, the reported performance of GGA calculations varies significantly. It has been re-ported that the lattice parameters are either largely over-estimated (cf. [63, 64] and this work) or in good agree-ment with experiagree-mental data (cf. [65]), see Table I. How-ever, despite good agreement with experimental lattice parameters, such calculations typically suffer from other deficiencies. In particular the computed elastic constants associated with transverse deformation are substantially overestimated. For instance in [65], the reported value of C11 ≈ 40 GPa, while the experimental data lie in the range 8.4-11.5 GPa [68, 69], implying that the transverse bonding is not accurately accounted for. This elastic constant relates to the stretching of the orthorhombic a-lattice parameter, which we in the present work find to be C11≈ 9.0 GPa in accordance with experimental data. In addition to the aforementioned data in Table I, we have compared the obtained optimized lattice parame-ters for PE with those computed by Kleis et al. [66] and Pham et al. [67] for a wide range of non-local formula-tions. Specifically, we have compiled data for the
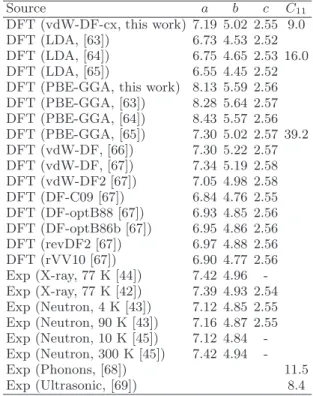
vdW-FIG. 3: (a) Phonon dispersion and density of states for stress free orthorhombic PE along with (b) a high resolution image the low frequency phonon dispersion branches for the Γ-Z path compared with experimental results [70–73]. The k-vector notation and Brillouin zone paths are adapted from [74] with branches associated with modes 9 and 12-16 as well as the B1u and B2u
translational intermolecular modes highlighted. (c) Illustration of modes 9 and 13 at the Γ-point that correspond to the lowest B1uand B2utranslational intermolecular modes, respectively. The arrows indicate the translational directions of the individual
chains. (d) Illustration of the librational intermolecular modes 12 and 14-16 computed at the Γ-point, which constitute the optical modes with rigid chain rotations around the [001]-axis (note that 14 and 15 are degenerate). The arrows indicate the rotational directions of each chain and the size of arrows indicate the relative magnitude.
func-7 tionals. In terms of predicted lattice parameters, those
found in the present work for the vdW-DF-cx compare well with those found for the vdW-DF and vdW-DF2 formulations in the literature. The remaining function-als (DF-C09, DF-opt88, DF-opt86b, revDF2, rVV10) predict a slightly underestimated a-lattice parameter, whereas b concurs with experimental data.
The computed lattice parameters for the monoclinic lattice correspond to a = 7.90 ˚A, b = 4.87 ˚A and c = 2.55 ˚A, which deviate from the experimental data by less than 3%. As comparison we computed the lattice parameters using PBE-GGA, which resulted in a = 9.04 ˚
A, b = 5.50 ˚A and c = 2.56 ˚A, which substantially overes-timate the experimental data. The computed respective tilt angles correspond to 108°and 112°, of which the for-mer concurs well with experimental data.
B. Phonons
To investigate the mechanical stability of the two phases, we compute the phonon dispersion and density of states, see Figures 3 and 4.
1. Orthorhombic phase
The phonon branches of the orthorhombic phase can be seen in Figure 3(a). The fact that no branches as-sume soft modes for the orthorhombic phase implies that it is stable. Because phonons can be sensitive to the choice of the pseudopotentials and the exchange-correlation functional used to generate them, we validate the predictability by comparing the transverse and longi-tudinal branches for the path between the Γ and Z sym-metry points [74] with experimental data [70, 71]. The computed results reproduce the experimental data for the acoustic and librational modes with an overall good match, see Figure 3(b).
Translational modes can be problematic to model with DFT, especially when the intermolecular interaction is weak. The phonon frequencies for the lowest B1u and B2u translational modes at the Γ-point (see Figure 3(c)) can serve as a test case. Their phonon frequencies are identified in Figure 3(b) and they correspond to 8.9 and 11.5 meV, respectively, which are underestimated by up to about 15% compared to the respective measurements of 9.9 and 13.4 meV [72, 73] at low temperature. How-ever, for higher frequency modes this discrepancy is re-duced, as seen for instance by tracing the associated phonon branches in Figure 3(b). This suggests that the B1u/B2udeviation is an upper bound on the errors made in our translational phonon characterization. This is in line with the results reported for crystalline naphtalene in [61], where the discrepancy between experiment and modelling was found to be about 10% and occurred for the low frequency translational modes.
As a consequence that we consider a cell with twice the volume of the primitive cell, we find that there are nine anti-parallel rocking modes and four librational opti-cal modes displaying chain rotational displacements (the latter corresponding to those depicted in Figure 3(d)). It should be noted that modes 14 and 15 are merely translated and rotated in the supercell, which means that they are degenerate. The librational modes are impor-tant for describing the chain rotations associated with orthorhombic to monoclinic transformation. As can be seen for modeshapes 12 and 14-16, the chain rotations are arranged such that they rotate in the same direction (such as in inset 12 in Figure 3(d)) or in opposite direc-tions (insets 14-16 in Figure 3(d)) and they need not dis-play the same displacement amplitude as the neighbour-ing chain (insets 14-15 in Figure 3(d)). From Figure 3(b) it is seen that the branches associated with the librational modes fit the experimental data well. This confirms that the utilized phonon modelling approach has satisfactory predictive capabilities for the current study.
2. Monoclinic phase
In light of the conjecture that the monoclinic phase may be a stress induced phase we have studied how the phonon spectrum varies with applied transverse strain. To this end we applied normal strains, ǫa and ǫb, such that the lengths of a and b were varied. Even though we tested different combinations of such strains, we only present the results for two states corresponding to ǫb= 0 and ǫb = −4%, respectively, see Figure 4. These states were found to be representative for all considered combi-nations.
For the stress free situation there are soft modes present that suggest that the phase is dynamically unsta-ble, see Figure 4(a)-(c). Specifically, the imaginary fre-quencies appear at the Γ and X symmetry points, which are situated at the origin and the Brillouin zone bound-ary, respectively (for details see [74]). To gain insight on the molecular movements associated with the soft mode, we investigate the atomic displacements for the Γ and X wave vectors. The modeshape is found to be the same type for both wave vectors: a librational mode repre-sented by chain rotations around the centre of gravity, of the same type as depicted in Figure 3(d) inset 16.
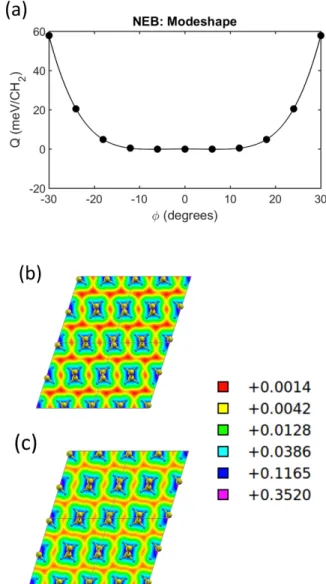
To investigate the physics behind the soft modes, we utilize the NEB method and simulate a concerted shuf-fling mechanism that reproduces the modeshape of the imaginary mode. To this end we rotate each chain by gradually increasing the rotation angle in the direction indicated by the modeshape. The results from this anal-ysis reveal that the potential energy landscape is virtu-ally flat when the rotation angle is varied between −15° to 15°, see Figure 5(a). This indicates that the chains can wiggle back and forth without resistance, which im-plies that the monoclinic phase is not stable in the low temperature limit. However, it is possible that the phase
FIG. 4: Phonon dispersion and density of states for mono-clinic PE for (a) ǫb = 0. High resolution image of the low
frequency phonon dispersion branches in the proximity of (b) Γ and (c) X for ǫbillustrating the soft mode. The imaginary
frequencies are indicated as negative frequencies in (a)-(c). Phonon dispersion and density of states for monoclinic PE for (d) ǫb= −4%
can be entropically stabilized by phonon-phonon inter-actions resulting from an increase of the temperature, which would suggest that the phase is metastable at most. Such behaviour has been observed for the
stabi-FIG. 5: (a) Activation energy curve, Q, for concerted mode-shape displacements of the soft mode computed by means of NEB. The end points were not allowed to undergo any re-laxation, which suggests that the energy levels for φ = ±30° are overestimated. Logarithmic charge density plots for (b) ǫb= 0 and (c) ǫb= −4% with volume specific density levels
in units of e/a3
0, where e denotes the number of electrons and
a0is the Bohr radius. The charge density plots are generated
using the XCrysDen software [84].
lization of high-temperature body-centered-cubic phases in metals [85, 86] and to model this one has to utilize methods that captures anharmonic or even non-adiabatic effects, which lies beyond the scope of this paper.
If we compress the b lattice parameter by 4%, the soft modes disappear, see Figure 4(d). In effect, the mon-oclinic phase becomes stable if the lateral dimensions are reduced such that the molecular chains are prevented from rotating. Such transverse deformations can appear as a Poisson effect when the polymer is strained in the chain direction. This result could explain why the phase is only seen when the material is subjected to loading and why it disappears upon relaxation and/or annealing.
9 To further explore the mechanisms responsible for this
behaviour, we have studied the link between coordinate changes and charge distributions for both ǫb = 0 and ǫb= −4%, see Figure 5(b) and (c), respectively. The un-strained cell is characterized by regions of depleted charge density, suggesting that the H-H repelling is not severe. Our results show that the chains tilt to align with the b-lattice vector, when subjected to compressive strain, see Figure 5(c). Based on a comparison of the charge den-sity plots, we interpret the tilting as occuring because the Pauli principle becomes increasingly more relevant with compression. This is due to a reduced interatomic dis-tance between H-atoms of neighbouring molecular chains and a disapperance of the charge-depleted regions aris-ing in concert with the tiltaris-ing. In this tilted state, the polymer chains are pinned by the surrounding repelling H-atoms of the neighbouring molecules. They are then prevented from wiggling freely, which causes the phonon instabilities to disappear.
C. Orthorhombic-monoclinic transformation
For the transformation between the two phases to oc-cur, two things need to happen: (i) the lattice needs to deform and (ii) the molecular chains need to shuf-fle such that the chain arrangements agree with those of the ground state structures. Since both mechanisms contribute to the threshold energy of the transformation we need to quantify them. Below we investigate their separate contributions.
1. Lattice deformation
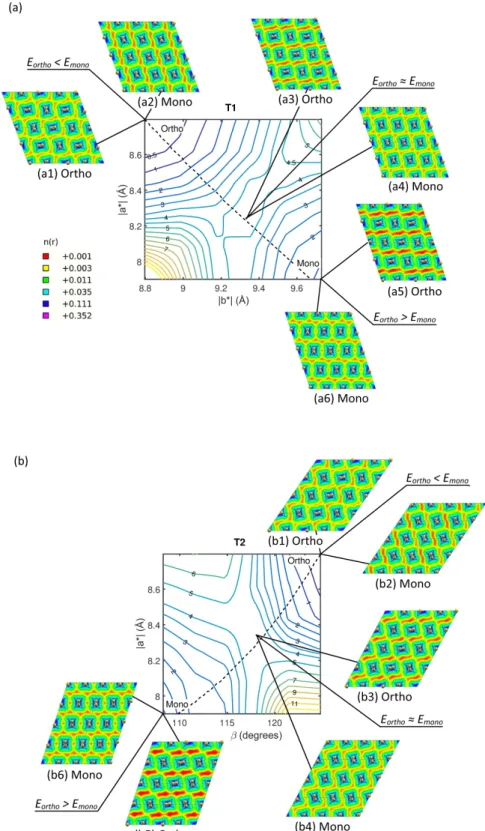
For the lattice deformations it turned out that all lowest energy equilibrium configurations originated from molecular arrangements where the chains were either or-ganized as those of the orthorhombic unit cell (i.e. ap-proximately 90°rotated, see Figure 1(a)) or as the mon-oclinic cell (i.e. aligned with a 180°skeletal rotation, see Figure 1(b)). Thus, in practice the strain energy land-scape reflects the competition of lowest ground state en-ergy of different chain arrangements for varied lattice pa-rameters. Therefore to present the strain energy land-scape we define the strain energy amplitude associated with each strain increment as E = min(Eortho, Emono), i.e. we take the lowest ground state energy of the re-laxed configurations emanating from initial states with chains arranged according to either the orthorhombic or the monoclinic cell. The reference energy corresponds to that of the ground state of the orthorhombic phase.
Figure 6 shows that for both transition paths, there is a saddle point in the strain energy at which the chain arrangement preference is changed. For both cases this is found to be ∼ 4 meV/CH2-unit. Inspection of the co-ordinate variation shows that the saddle point serves as a distinct point where the rotated molecular configuration
of the orthorhombic phase obtains a higher ground state energy than the aligned molecular configuration of the monoclinic cell, cf. Figure 6(a) and (b). Thus, the saddle region effectively is the border between the two possible molecular chain arrangements and indicates where it is energetically favourable for the molecules to rearrange. This switch is from an arrangement where nearest neigh-bouring chains are rotated by about 90° to that of the monoclinic cell, where the chains are organized accord-ing to Figure 1(b).
The fact that the iso-volume curves in Figure 6 to a great extent are perpendicular to the energy iso-levels and approximately pass through saddle points, indicates that the deformations are approximately volume conserv-ing. This implies that the supercell deformation can be described in terms of a pure shearing mode accompanied by chain rotations, as proposed by Bevis and Crellin [22]. As indicated by the insets in Figure 6, at the saddle point (i.e. insets a4 and b4 in Figure 6), the molecular chains are tilted, similar to Figure 5(c). But as the lattice parameters approach those of the monoclinic (i.e. insets a6 and b6), the molecular chains adapt the orientation of the stress-free monoclinic phase as indicated in Figure 1(b). Although this tilting can be seen as concerted chain shuffling, it does not reflect the fact that the molecules need to reorient from a non-aligned to an aligned chain configuration, which in the next section is shown to re-quire much higher activation energy.
To better understand the nature of the strain energy landscapes, we study the charge density distributions at minima and saddle points. We find that high ground state energy configurations are accompanied by the for-mation of regions of depleted charge density as well as those of unusually high charge density. The high density regions are particularly noticeable whenever the separa-tions of H-atoms from neighbouring molecules are small, which cause the concerted chain tilting. This can be re-alized for instance by tracing the charge density plots along the constant volume curves in Figure 6 from the stable orthorhombic structure to the monoclinic. Dur-ing this transition, the amount of low and high density regions increases substantially, unless the molecules grad-ually reorient to reduce the ground state energy.
The fact that there is an emergence of regions of re-duced charge density during the transition implies that vdW interaction is the main contributor to the landscape variation. To investigate this closer, Figure 7 documents the total strain energy, E, and vdW energy, Enl
c , contri-butions to the optimal iso-volume T1 path. The latter of these contributions represents the extent to which the cohesion arises as a partial contribution, originating from the vdW-DF-cx non-local correlation energy term. This term describes the vdW interactions in the system and Enl
c reflects the inter-chain vdW binding in the PE crys-tal. Analysis of Figure 7 reveals that the peak strain energy and the majority of the overall behaviour can be attributed to the vdW forces, and thus the vdW inter-action constitutes the major contribution to the strain
FIG. 6: Strain energy landscapes for (a) T1 and (b) T2 deformation mechanisms. The strain energy, E, is measured in meV/CH2-unit, with an uncertainty of less than ±0.5 meV/CH2-unit. The dashed lines correspond to iso-volume curves.
The insets correspond to logarithmic charge density plots for the relaxed equilibrium configurations using orthorhombic and monoclinic molecular arrangements as initial states. The units for the density levels are the same as in Figure 5 and the legend applies for both (a) and (b).
energy. The fact that the end points of the curves in Figure 7 overlap is an indication that the ground state
energy difference between the two phases is solely dic-tated by the vdW interaction.
11 0 0.2 0.4 0.6 0.8 1 normalized coordinate 0 1 2 3 4 5 E (meV/CH 2 ) T1 Ortho Mono E Ecnl
FIG. 7: Strain energy curve of the optimal T1 lattice defor-mation path and documentation of key role of vdW forces. The set of black markers identify computations of the total strain energy (per polymer repeat unit) in the PE crystal for a set of representative lattices along the iso-volume curve of Figure 6(a). The set of red markers shows the strain energy contributions that arise alone from the non-local correlation energy part, i.e., the part of the vdW-DF-cx functional that captures the vdW binding.
2. Chain shuffling
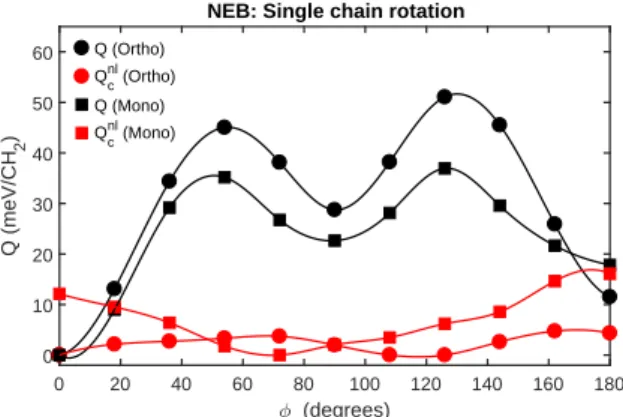
The second contribution to the threshold energy as-sociated with martensitic transformation is the energy required for the chains to re-arrange from a non-aligned configuration to an aligned. To quantify this contribu-tion we consider the activacontribu-tion energy needed for a sin-gle chain to rotate 180°. To estimate the activation en-ergy we use the NEB method to compute the enen-ergy re-quired for rotating a molecular chain in the equilibrium orthorhombic and monoclinic phases. Figure 8 shows that the threshold for these transitions lies in the range of 35-50 meV/CH2, which is approximately ten times higher than the threshold energies associated with lattice defor-mation. Thus, individual chain shuffling dominates and represents the bulk of the threshold energy associated with the martensitic transformation.
The NEB calculations further reveal that the activa-tion energy for rotaactiva-tion is less in the monoclinic config-uration, which indicates a preference for rotation in that state. The fact that there are local minima for the ro-tation corresponding to 90°, implies that chain arrange-ments with stems aligned or perpendicular are in a (po-tentially) metastable state. In the same manner as for the lattice deformation, we quantify the vdW contributions to the activation energy in Figure 8. It is found that they are relatively small in comparison with the total activa-tion energy, of which they constitute about 10%. Hence, other mechanisms, such as repulsion from close ranged H-atoms of neighbouring chains, are more important when describing the chain shuffling activation energy.
0 20 40 60 80 100 120 140 160 180 (degrees) 0 10 20 30 40 50 60 Q (meV/CH 2 )
NEB: Single chain rotation
Q (Ortho) Qnlc (Ortho) Q (Mono) Qnl
c (Mono)
FIG. 8: Estimated activation energies, Q, for a single chain rotation in the equilibrium orthorhombic and monoclinic phases, computed for the ideal equilibrium lattice parame-ters of the respective phases by means of the NEB method. The black markers indicate the total energy, whereas the red markers represent the non-local correlation contribution.
IV. DISCUSSION
In the present section we discuss the main findings and relate them to experimental observations. The re-sults of our non-empirical modelling reveal primarily two very interesting observations: (i) soft phonon modes of the monoclinic phase and (ii) low strain energy required to transform from the orthorhombic to the monoclinic phase accompanied with relatively high activation energy needed for chain shuffling.
The soft phonon modes associated with the monoclinic phase is an indication that it is not stable in the low tem-perature limit. Based on the analysis of the associated modeshape, the soft modes emanate from the fact that the activation energy for the modeshape movement is zero. This can give rise to a spontaneous wiggling chain motion that manifests in imaginary phonon modes. Al-though it is beyond the scope of this work to study, it is possible that the phase can be stabilized by phonon-phonon interaction if the temperature is increased.
In characterizing the chain shuffling process (illus-trated in Figure 2) we have chosen to focus on atomic displacements that are similar, although not identical, to those of the phonon mode (labelled 16 in Figure 3(d)) that is found unstable for the monoclinic phase. Our results for the chain-shuffling threshold reflect a Born-Oppenheimer (BO) description that is directly available in ground-state DFT, while the phonon analysis is a beyond-BO characterization of stability. The differences between the BO and phonon characterizations of mono-clinic phase stability make it desirable to eventually seek a DFT-based account of the non-adiabatic atomic dy-namics, see for instance [85–87]. The strong performance for descriptions of the relevant soft-matter librational modes suggests that vdW-DF-cx would be useful, but such an exploration is beyond the present scope. How-ever, as discussed below, many experimental observations
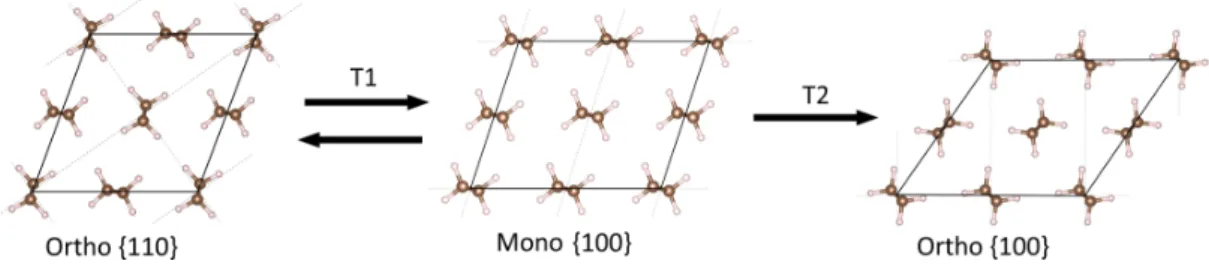
FIG. 9: Possible low threshold energy transition path for lamellae fold planes in crystalline PE. The transition goes from orthorhombic {110} to orthorhombic {100} via monoclinic {100}, by the employment of a T1 transformation followed by a reversed T2 transformation.
can be understood already from the present DFT-based results.
The fact that the soft modes disappear when subjected to transverse deformation is an indication that the mono-clinic phase is stabilized when subjected to loading. This is in accordance with results from experiments that have revealed that the monoclinic phase is only observed un-der such conditions. The strain induced phonon stabil-ity is accompanied by chain tilting that appears as a consequence of reduced H-atom distance of neighbour-ing molecules. The tiltneighbour-ing emanates from charge density overlap in the close proximity of closely spaced H-atoms of neighbouring molecules. Thus, to reduce the energy, the chains are forced to tilt such that the H-H separa-tion is increased. Moreover, such rotasepara-tions reduce the regions of low charge density and lead to more uniform charge density distributions, which in previous investiga-tions have been found to correlate strongly with reducing the ground state energy in PE [21]. Once in this tilted state, the closely-spaced H-atoms pin the chains and pre-vent them from wiggling freely, which is the reason why the instability modes disappear when the b-lattice param-eter of the monoclinic phase is subjected to compressive strains. Such strains could emanate either from com-pressive transverse loads or as a Poisson effect following tensile loading in the chain direction.
The strain energy threshold associated with lattice deformation between the orthorhombic and monoclinic phases is found to be very small, of the order of 4 meV/CH2-unit for both the T1 and T2 mechanisms, and it can be exclusively derived from the vdW interaction. These mechanisms do not account for chain shuffling, for which the activation energies were assessed to lie in the range of 35-50 meV/CH2-unit. Thus, the combined en-ergy threshold for both lattice deformation and chain shuffling can be estimated to about 40-55 meV/CH2 -unit in the adabatic description provided by ground-state DFT calculations. In order to investigate the possibil-ity of thermally activated back transformation, we com-pare the threshold energy with that of kBT , which is a measure of the averaged kinetic energy. In the temper-ature range 0 to 300°C, this translates to about 25-50 meV, which is of the same order as the estimated com-bined threshold energy associated the phase transforma-tion. Hence, it is possible for back transformation to be
thermally activated. This could explain the experimen-tal observation of annealing above 110°C leading to back transformation from the monoclinic to the orthorhombic phase [35].
The fact that the soft modes of the monoclinic phase can disappear when subjected to relatively small trans-verse strains could be an indication that it serves as an intermediate configuration that will transform back to the orthorhombic phase when unloaded and relaxed, for instance through the T1 or T2 mechanisms. Since the threshold energy for both mechanisms are of the same order, they may occur with roughly the same probability. This suggests that there are more than one way through which the back transformation from monoclinic to or-thorhombic phase can occur following relaxation and/or annealing, as illustrated in Figure 9. Thus, when load-ing the orthorhombic phase (such that it transforms to the monoclinic phase (section II B) via the T1 mecha-nism), the monoclinic phase can either transform back to the orthorhombic phase via (i) a reversed T1 or (ii) a reversed T2 mechanism upon unloading and relaxation. If (i) occurs the lamellae will have the same fold sur-faces as before loading. Such transformation corresponds to that observed in [34], where it was deduced that the interface is of monoclinic(010)/orthorhombic(110) type that moves in the direction of the monoclinic crystal af-ter annealing. However, if (ii) occurs this will lead to a change of the fold plane type from {110} to {100}, as indicated in Figure 9. Such reorientation has been ob-served in crystalline lamellae parts of PE, where the fold planes change from {110} to {100} following annealing [7, 8, 36]. These observations indicate that both types of transitions between the monoclinic and orthorhombic phase are possible.
V. SUMMARY AND CONCLUSIONS
In this work we have investigated the martensitic trans-formation in crystalline PE by means of first princi-ples atomistic modelling based on DFT. The modelling is performed using the recent consistent-exchange vdW-DF-cx version [39, 40] of the Chalmers-Rutgers vdW-DF method. Besides seeking an accurate characterization of transformation energetics of the martensitic
transforma-13 tion, we have also investigated phonon characteristics of
the monoclinic phase to gain insight into its much de-bated phase stability.
The computed phonon data for the monoclinic phase shows that it is not a completely stable phase. Two in-stances of imaginary frequencies located at the Γ and X symmetry points were observed, with modeshape dis-placements corresponding to a mode where the chains undergo rotational movements. However, if one of the transverse lattice parameters (b) is subjected to com-pressive strains, the reduced H-H distance between neigh-bouring molecular chains causes regions of increased elec-tron density that through the Pauli principle give rise to chain tilting. In this tilted state the molecular chains are pinned by the repulsive forces emanating from neigh-bouring chains, causing the soft modes to disappear. This concurs with experimental observations of the mon-oclinic phase being exclusively observed in mechanically loaded specimens and the occurrence of back transfor-mation from the monoclinic to the orthorhombic phase upon relaxation or annealing.
For the martensitic transformation, we have studied the strain energy landscapes for two experimentally ob-served transformation paths and the activation energy for chain shuffling. The results reveal that the com-bined threshold energy for these mechanisms are of the same order as kBT (in the range from room temperature to 300°C), which implies that relaxation and thermally activated back transformation between the two phases may occur, as experimentally observed in the literature. Through combinations and reversals of the T1 and T2 mechanisms, we have proposed a transformation path that could explain the experimentally observed reorien-tation of lamellae fold planes from {110} to {100}-type upon annealing. Moreover, the low activation energy of the lattice deformation and chain shuffling mechanisms are in accordance with the experimentally observed back transformation mechanism that corresponds to the
grad-ual movement of a monoclinic(010)/orthorhombic(110) interface towards the monoclinic part of the crystal until it is fully transformed to orthorhombic.
Overall, the martensitic transformation and phase sta-bility of PE is found to reflect a subtle balance of forces [39, 76]. We have documented that strain energy barriers for the transformation and the difference in ground state energy between the two phases are very low (a few meVs per polymer repeat unit). These energy characteristics can be explained by inter-chain vdW forces, which dictate the phase stability and strain energy. At the same time, we have shown that a robust account of Pauli exclusion is important to describe the instability and stability of phonon modes and the chain shuffling activation energy that reflect the nature of the monoclinic-to-orthorhombic transformation. Finally, in the stabilization of the mono-clinic phase (that arises with compressive strain) the PE chains reorganize themselves to both maximize the vdW attraction and the kinetic-energy repulsion that under-pins the Pauli exclusion. These findings demonstrate the importance of the inclusion of vdW interaction in the present application.
Acknowledgments
This work was funded by the Swedish Knowledge Foundation (KKS) through grant no. 20150165, by the Swedish Research Council (VR) through grants No. 2014-4310 and 2014-5289, and by the Swedish Foun-dation for Strategic Research (SSF) under contract No. SE13-0061. The simulations were performed using computational resources provided by the Swedish tional Infrastructure for Computing (SNIC) at the Na-tional Supercomputer Centre (NSC), Link¨oping Univer-sity and at the High Performance Computing Center North (HPC2N), Ume˚a University.
[1] R. Young and P. Lovell, Introduction to Polymers, Third Edition (Taylor & Francis, 2011).
[2] A. S. Argon, The Physics of Deformation and Fracture of Polymers (Cambridge University Press, 2013). [3] A. Rozanski and A. Galeski, Int. J. Plast. 41, 14 (2013). [4] M. Uchida and N. Tada, Int. J. Plast. 49, 164 (2013). [5] D. R. Askeland, The Science and Engineering of
Materi-als, SI Edition (Stanley-Thornes, 1998), 3rd ed. [6] S. S. Katti and M. Schultz, Polym. Engng. Sci. 22, 1001
(1982).
[7] P. B. Bowden and R. J. Young, J. Mater. Sci. 9, 2034 (1974).
[8] L. Lin and A. S. Argon, J. Mater. Sci. 29, 294 (1994). [9] Z. Bartczak and A. Galeski, Macromol. Symp. 294, 67
(2010).
[10] J. Petermann and H. Gleiter, Philos. Mag. 25, 813 (1972).
[11] H. Gleiter and A. S. Argon, Philos. Mag. 24, 71 (1971).
[12] A. Cowking and J. G. Rider, J. Mater. Sci. 4, 1051 (1969).
[13] F. C. Frank, A. Keller, A. O’Connor, and H. H. Wills, Philos. Mag. 3, 64 (1958).
[14] V. F. Holland, J. Appl. Phys. 35, 3235 (1964).
[15] R. J. Young, P. B. Bowden, J. M. Ritchie, and J. G. Rider, J. Mater. Sci. 8, 23 (1973).
[16] R. J. Young and P. B. Bowden, Philos. Mag. 29, 1061 (1974).
[17] A. Galeski, Prog. Polym. Sci. 28, 1643 (2003).
[18] A. Galeski, Z. Bartczak, A. S. Argon, and R. E. Cohen, Macromol. 25, 5705 (1992).
[19] P. Allan and M. Bevis, Philos. Mag. A 41, 555 (1980). [20] N. A. Geary and D. J. Bacon, J. Mater. Sci. 18, 864
(1983).
[21] P. A. T. Olsson, E. Schr¨oder, P. Hyldgaard, M. Kroon, E. Andreasson, and E. Bergvall, Polymer 121, 234 (2017).
[22] M. Bevis and E. Crellin, Polymer 12, 666 (1971). [23] P. Allan, E. B. Crellin, and M. Bevis, Philos. Mag. 27,
127 (1973).
[24] P. Allan and M. Bevis, Philos. Mag 35, 405 (1977). [25] P. Allan and M. Bevis, Philos. Mag. 31, 1001 (1975). [26] T. Seto, T. Hara, and K. Tanaka, Jpn. J. Appl. Phys. 7,
31 (1968).
[27] I. L. Hay and A. Keller, J. Polym. Sci. C 30, 289 (1970). [28] E. R. Walter and F. P. Reding, J. Polym. Sci. 21, 557
(1956).
[29] P. W. Teare and D. R. Holmes, J. Polym. Sci. 24, 496 (1957).
[30] B. Gurun, D. G. Bucknall, Y. S. Thio, C. C. Teoh, and E. Harkin-Jones, J. Polym. Sci. B 49, 669 (2011). [31] S. J. Spells and S. Coutry, Appl. Spectrosc. 61, 276
(2007).
[32] H. Kiho, A. Peterlin, and P. H. Geil, J. Appl. Phys. 35, 1599 (1964).
[33] H. Kiho, A. Peterlin, and P. H. Geil, J. Polym. Sci. B 3, 157 (1965).
[34] Y. Takahashi, T. Ishida, and M. Furusaka, J. Polym. Sci. B 26, 2267 (1988).
[35] H. Kiho, A. Peterlin, and P. H. Geil, J. Polym. Sci. B 3, 263 (1965).
[36] Y. Kikuchi and S. Krimm, J. Macromol. Sci.-Phys. B 4, 461 (1970).
[37] M. Dion, H. Rydberg, E. Schr¨oder, D. C. Langreth, and B. I. Lundqvist, Phys. Rev. Lett. 92, 246401 (2004). [38] K. Berland, V. R. Cooper, K. Lee, E. Schr¨oder, T.
Thon-hauser, P. Hyldgaard, and B. I. Lundqvist, Rep. Prog. Phys. 78, 066501 (2015).
[39] K. Berland, C. A. Arter, V. R. Cooper, K. Lee,
B. I. Lundqvist, E. Schr¨oder, T. Thonhauser, and
P. Hyldgaard, J. Chem. Phys. 140, 18A539 (2014). [40] K. Berland and P. Hyldgaard, Phys. Rev. B 89, 035412
(2014).
[41] K. Momma and F. Izumi, J. Appl. Crystall. 44, 1272 (2011).
[42] S. Kavesh and J. M. Schultz, J. Polym. Sci. A-2: Polym. Phys. 8, 243 (1970).
[43] G. Avitabile, R. Napolitano, B. Pirozzi, K. D. Rouse, M. W. Thomas, and B. T. M. Willis, J Polym. Sci.: Polym. Lett. Ed. 13, 351 (1975).
[44] P. W. Teare, Acta Crystall. 12, 294 (1959). [45] Y. Takahashi, Macromol. 31, 3868 (1998). [46] J. Ericksen, Math. Mech. Solids 13, 199 (2008).
[47] H. Jonsson, G. Mills, and K. W. Jacobsen, Nudged elastic band method for finding minimum energy paths of transi-tions in: Classical and Quantum Dynamics in Condensed Phase Simulations (World Scientific, 1998), pp. 385–404. [48] D. Sheppard, R. Terrell, and G. Henkelman, J. Chem.
Phys. 128, 134106 (2008).
[49] P. Giannozzi, S. Baroni, N. Bonini, M. Calandra, R. Car, C. Cavazzoni, D. Ceresoli, G. L. Chiarotti, M. Cococ-cioni, I. Dabo, et al., J. Phys.: Condens. Matter 21, 395502 (2009).
[50] P. Giannozzi, O. Andreussi, T. Brumme, O. Bunau, M. Buongiorno Nardelli, M. Calandra, R. Car, C. Cavaz-zoni, D. Ceresoli, M. Cococcioni, et al., J. Phys.: Con-dens. Matter 29, 465901 (2017).
[51] D. Vanderbilt, Phys. Rev. B 41, 7892 (1990).
[52] K. F. Garrity, J. W. Bennett, K. M. Rabe, and D. Van-derbilt, Comput. Mater. Sci. 81, 446 (2014).
[53] H. J. Monkhorst and J. D. Pack, Phys. Rev. B 13, 5188
(1976).
[54] S. Baroni, P. Giannozzi, and E. Isaev, Rev. Mineral. Geochem. 71, 39 (2010).
[55] N. Mounet, First-principles determination of the struc-tural, vibrational and thermodynamic properties of di-amond, graphite, and derivatives (Master thesis, MIT, 2005).
[56] H. Rydberg, M. Dion, N. Jacobson, E. Schr¨oder,
P. Hyldgaard, S. I. Simak, D. C. Langreth, and B. I. Lundqvist, Phys. Rev. Lett. 91, 126402 (2003).
[57] M. Dion, H. Rydberg, E. Schr¨oder, D. C. Langreth, and B. I. Lundqvist, Phys. Rev. Lett. 95, 109902 (2005). [58] T. Thonhauser, V. R. Cooper, S. Li, A. Puzder,
P. Hyldgaard, and D. C. Langreth, Phys. Rev. B 76, 125112 (2007).
[59] P. Hyldgaard, K. Berland, and E. Schr¨oder, Phys. Rev B 90, 075148 (2014).
[60] T. Thonhauser, S. Zuluaga, C. A. Arter, K. Berland, E. Schr¨oder, and P. Hyldgaard, Phys. Rev. Lett. 115, 136402 (2015).
[61] F. Brown-Altvater, T. Rangel, and J. B. Neaton, Phys. Rev. B 93, 195206 (2016).
[62] P. Erhart, P. Hyldgaard, and D. Lindroth, Chem. Mater. 27, 5511 (2015).
[63] B. Montanari, P. Ballone, and R. O. Jones, J. Chem. Phys. 108, 6947 (1998).
[64] G. D. Barrera, S. F. Parker, A. J. Ramirez-Cuesta, and P. C. H. Mitchell, Macromol. 39, 2683 (2006).
[65] M. S. Miao, M.-L. Zhang, V. E. V. Doren, C. V. Alsenoy, and J. L. Martins, J. Chem. Phys. 115, 11317 (2001).
[66] J. Kleis, B. I. Lundqvist, D. C. Langreth, and
E. Schr¨oder, Phys. Rev. B 76, 100201 (2007).
[67] T. H. Pham, R. Ramprasad, and H.-V. Nguyen, J. Chem. Phys. 144, 214905 (2016).
[68] J. F. Twisleton, J. W. White, and P. A. Reynolds, Poly-mer 23, 578 (1982).
[69] C. L. Choy and W. P. Leung, J. Polym. Sci.: Polym. Phys. Ed. 23, 1759 (1985).
[70] D. A. Braden, S. F. Parker, J. Tomkinson, and B. S. Hudson, J. Chem. Phys. 111, 429 (1999).
[71] J. Tomkinson, S. F. Parker, D. A. Braden, and B. S. Hudson, Phys. Chem. Chem. Phys. 4, 716 (2002). [72] Y. Takahashi, Macromol. 34, 7836 (2001). [73] Y. Takahashi, Macromol. 38, 5356 (2005).
[74] W. Setyawan and S. Curtarolo, Comput. Mater. Sci. 49, 299 (2010).
[75] A. van de Walle and G. Ceder, Phys. Rev. B 59, 14992 (1999).
[76] K. Berland and P. Hyldgaard, Phys. Rev. B 87, 205421 (2013).
[77] K. Lee, E. D. Murray, L. Kong, B. I. Lundqvist, and D. C. Langreth, Phys. Rev. B 82, 081101 (2010). [78] V. R. Cooper, Phys. Rev. B 81, 161104 (2010). [79] A. D. Becke, Phys. Rev. A 38, 3098 (1988). [80] A. D. Becke, J. Chem. Phys. 85, 7184 (1986). [81] I. Hamada, Phys. Rev. B 89, 121103 (2014). [82] I. Hamada, Phys. Rev. B 91, 119902 (2015).
[83] O. A. Vydrov and T. Van Voorhis, J. Chem. Phys. 133, 244103 (2010).
[84] A. Kokalj, Comput. Mater. Sci. 28, 155 (2003). [85] P. Souvatzis, O. Eriksson, M. I. Katsnelson, and S. P.
Rudin, Phys. Rev. Lett. 100, 095901 (2008).
[86] P. Souvatzis, T. Bj¨orkman, O. Eriksson, P. Andersson, M. I. Katsnelson, and S. P. Rudin, J. Phys.: Condens.
15
Matter 21, 175402 (2009).
[87] F. Agostini, S. K. Min, A. Abedi, and E. K. U. Gross, J.

![FIG. 3: (a) Phonon dispersion and density of states for stress free orthorhombic PE along with (b) a high resolution image the low frequency phonon dispersion branches for the Γ-Z path compared with experimental results [70–73]](https://thumb-eu.123doks.com/thumbv2/5dokorg/4194105.91563/9.892.171.761.65.906/dispersion-orthorhombic-resolution-frequency-dispersion-branches-compared-experimental.webp)