PERFORMANCE ASSESSMENT OF
ELECTRICAL MOTOR FOR ELECTRIC
AIRCRAFT PROPULSION
APPLICATIONS
Evaluation of the permanent magnet motor and its limitations in aircraft
propulsion
MATHIAS BECKMAN
ALEX CHRISTY GERALD VOLDEN
School of Business, Society and Engineering Course: Degree Project, Energy Engineering Course code: ERA206
Credits: 15hp
Program: Energy Engineering Program
Supervisor: Smruti Sahoo Examiner: Md. Lokman Hosain Date: 2019-06-11
Email:
mbn14008@student.mdh.se agn13010@student.mdh.se
ABSTRACT
This thesis project will evaluate which kind of electrical motor is best suited for aircraft propulsion and which parameters effect the efficiency. An economic analysis was conducted, comparing the fuel price (Jet A1) for a gas turbine and the electricity price for an electric motor of 1MW. The study was conducted by using analytical methods in MATLAB. Excel was used to compile and present the data. The data used in this thesis project were assumed with regards to similar studies or pre-determined values. The main losses for the Permanent Magnet Synchronous Motor (PMSM) were calculated to achieve a deeper understanding of the most important parameters and how these parameters need to improve to allow for future electric propulsion systems. The crucial parameters for the losses were concluded to be the temperature, voltage level, electrical frequency, magnetic flux density, size of the rotor and rotational speed. The three main losses of a PMSM was illustrated through the analytical equations used in MATLAB. The calculations present how the ohmic losses depend on the temperature (0-230°C) at different voltages (700V and 1000V), how the core losses depend on frequency (0-1000Hz) at different magnetic flux densities and how the windage losses depend on rotational speed (7000-10000 rpm). It could be concluded that at 8500 rpm an efficiency of 91,26% could be achieved at 700V, 1.5T and 90.4% at 1000V, 1.65T. The decrease in efficiency is a result of the increase in magnetic flux density. When looking at the economic viability of electrical integration the power to weight ratio and energy price was compared for the gas turbine and electrical motor including an inverter and battery. This resulted in a conclusion that a pure electrical system may not compete with a gas turbine in 30 years of time due to the low energy density of the battery. It was also concluded that the emissions during cruise could be lowered significantly. If the batteries were charged in Sweden the emissions would decrease from ~937 kg CO2 to ~31 kg CO2. If the batteries were charged in the Nordic
region the emissions would decrease to ~119kg CO2. However, if the batteries were to be
charged in the US the carbon dioxide emission would be ~1084 kg CO2, which is an increase in
CO2 emission compared to the gas turbine.
Keywords: Electric Aircraft, Permanent Magnet Electrical Motor, Losses, Hybrid-Electric Propulsion System, Environment, Global Warming, Aircraft Emission
PREFACE
This thesis project on a bachelor level concludes our studies on Mälardalen University in the Energy Engineering program. We want to thank our supervisor Smruti Sahoo, without her input and guidance this work would not have been possible.
Västerås, Sweden, in June 2019
CONTENT
1 INTRODUCTION ...1
1.1 Background ... 1
1.1.1 Environmental aspects ... 1
1.1.2 Current research and possible solutions ... 2
1.1.3 The benefits of aircraft electric propulsion ... 2
1.1.4 Inverters ... 3 1.2 Purpose ... 3 1.3 Research questions ... 3 1.4 Delimitation ... 3 2 METHOD ...4 2.1 Literature Study ... 4 2.2 Calculations ... 4 3 THEORETICAL FRAMEWORK ...5 3.1 Environmental impacts ... 5 3.1.1 Emissions ... 5 3.1.2 Fuel consumption ... 6
3.1.3 The individual contribution ... 7
3.1.4 Electric aircrafts ... 7
3.2 Selection of electrical motor ... 7
3.3 Losses ... 8 3.3.1 Stator losses ... 8 3.3.1.1. Ohmic loss ...8 3.3.1.2. Core loss ...9 3.3.1.3. Hysteresis curve ... 10 3.3.2 Windage loss ...11 3.3.3 Rotor loss ...11 3.4 Inverters ...11 3.5 Batteries ...12
3.6 Future technologies ...13 4 CURRENT STUDY ... 14 4.1.1 Operating voltage ...14 4.1.2 Operating temperature ...14 4.1.3 Ohmic losses ...14 4.1.4 Core losses ...16 4.1.5 Windage losses ...17 4.1.6 Total efficiency ...18 4.2 Emission ...18
4.3 Power to weight ratio ...19
4.4 Economics ...19
4.4.1 Energy price comparison ...19
4.4.2 Comparison of gas turbine and electrical propulsion ...20
5 RESULTS ... 21 5.1 Losses ...21 5.1.1 Ohmic losses ...21 5.1.2 Core loss ...22 5.1.3 Windage losses ...23 5.1.4 Total efficiency ...23
5.2 Power to weight ratio ...24
5.3 Economics ...26
5.4 Emission ...27
6 DISCUSSION... 28
6.1 Motor losses ...28
6.2 Power to weight ratio ...28
6.3 Economics ...29
6.4 Emissions ...29
7 CONCLUSIONS ... 30
REFERENCES ... 32
LIST OF EQUATIONS
Equation 1 Ohmic loss ... 8Equation 2 Calculation of coefficient Ce ... 9
Equation 3 C.P. Steinmetz formula for core loss ... 9
Equation 4 Shaft rotational speed ... 11
Equation 5 Reynolds number ... 11
Equation 6 Windage loss ... 11
Equation 7 Approximation of coefficent of friction ... 11
Equation 8 Ohms law ...14
Equation 9 Power ...14
Equation 10 Resistivity as a function of temperature ... 15
Equation 11 Total resistance of a conductor ... 15
Equation 12 Peak power design ... 15
Equation 13 Calculation of conductor lenght ... 15
Equation 14 Motor efficiency ... 18
LIST OF FIGURES
Figure 1 Motor configuration ... 2Figure 2 Specific carbon dioxide emissions of various fuel ... 6
Figure 3 Generalized representation of the Hysteresis curve (B-H curve) ... 10
Figure 4 Technology improvement areas for electric propulsion ... 13
Figure 5 Iron loss depending on various frequency at different air gaps ... 17
Figure 6 Copper loss as a function of temperature at 700V and 1000V ...21
Figure 7 Core loss per kilogram depending on frequency for Hiperco 50 ... 22
Figure 8 How the windage loss increases with the rotational speed of the rotor ... 23
Figure 9 Power to weight ratio expectance of PMSM... 24
Figure 10 PTWR of the system including electrical motor and inverter ... 24
Figure 11 Comparison in power density of battery PTWR with Jet A1... 25
Figure 12 PTWR of motor, inverter and battery combined ... 25
Figure 13 Price comparison of fuel (Jet A1) and electricity for one kWh of energy used ... 26
Figure 15 The amount of carbon dioxide produced during a 2h cruise ... 27
LIST OF TABELS
Table 1 Fuel use and emission factors for average aircraft for LTO cycle and cruise ... 7Table 2 Power Electronics Characteristics ...12
Table 3 Improvements in battery density ...12
Table 4 Data sheet for Hiperco 50 ...16
Table 5 Input data for windage loss calculation ... 18
Table 6 Energy requirements of 1MW electrical motor ... 18
Table 7 Comparison of Turbine engine and Electrical motor energy cost ... 20
NOMENCLATURE
Symbol Description Unit
µ Kinematic viscosity Meter squared/second [m2/s]
B Magnetic flux density Tesla [B]
H Magnetic field strength Ampere/meter [A/m]
I Current Ampere [A]
N Windings in one coil -
P Electric power Watt [W]
R Resistance Ohm [𝛺]
r Radius of rotor Meter [m]
T Temperature Degree Celsius [°C]
U Voltage Volt [V]
W Power Joule/second [J/s] or Watt
[W]
λ Length of rotor Meter [m]
ρ Density of fluid Kilogram/cubic meter
[kg/m3]
𝜌 Resistivity Ohm/meter [Ω/m] η Efficiency Percent [%] S/m Conductivity Siemens/meter [Ω-1/m]
ABBREVIATIONS
Abbreviation Description AC Alternating current DC Direct current EDF Electric ducted fan EMF Electro-magnetic forceMOT Maximum operating temperature PM Permanent magnet
PMSM Permanent magnet synchronous motor PTWR Power to weight ratio
RMS Root mean square rpm Revolutions per minute SM Synchronous motor
1
INTRODUCTION
In the modern globalized world, the aviation industry has become more important than ever before to keep the world and its people connected with each other. In 2018 more than 24 million flight-hours was accumulated globally, and the majority of those were running on fossil fuel (FAA, 2018). Fossil fuels has a finite supply and contributes to global warming (Denchak, 2018). As supply goes down and the demand of oil goes up, the prices will follow affecting both customers and corporations. Therefore, today’s turbine engines running on fossil fuels are not sustainable in the long run and another solution needs to be found to keep the industry and environment running.
Research for alternative propulsion systems are ongoing all around the world to get the aviation industry to use less fossil fuel. The problem with today’s electrical motors is the relatively low power to weight ratio compared to a gas turbine. The increased weight of the total drive system leads to less loading of merchandise on the aircraft, minimizing the potential economic value of each flight.
One type of motor that is being researched is a combined system using a gas turbine in parallel with electrical motors to provide enough propulsion to operate alone at cruise speeds. This will hypothetically lead to a decreased total amount of fuel burned for each flight. This thesis project will evaluate the main losses in the electric motor. The potential reduction of emissions will also be considered. The economic viability will also be analysed.
1.1 Background
This chapter will highlight the reasons why improvements in aircraft industry is needed regarding environmental aspects and how the current field of research approach possible solutions.
1.1.1 Environmental aspects
In 2012 the European Union Emissions Trading System (EUETS) introduced that all airlines within the EUETS area are required to monitor and report all yearly emission data (European Commission, n.d.). The airplanes in the world accounts for more than 2% of the global emissions of greenhouse gases. This could be compared to the worst countries regarding emissions. Resolutions have been made to limit and reduce the CO2 emissions in the aviation
industry. Implementing more regulations could potentially reduce the emissions even further and force a development in aircraft propulsion.
1.1.2 Current research and possible solutions
One focus in current research are finding alternate fuels as well as the electrification of the drive line, partly or fully. One design problem with electrical drive system for aircraft propulsion is the comparably lower power to weight ratio, such as the storage of electrical energy to drive the motors (Denver, et al., 2015).As with most electric vehicles the main benefit is the high effective use of energy compared to a combustion engine, especially at the altitude of aircraft operation (Gaj, 2018).
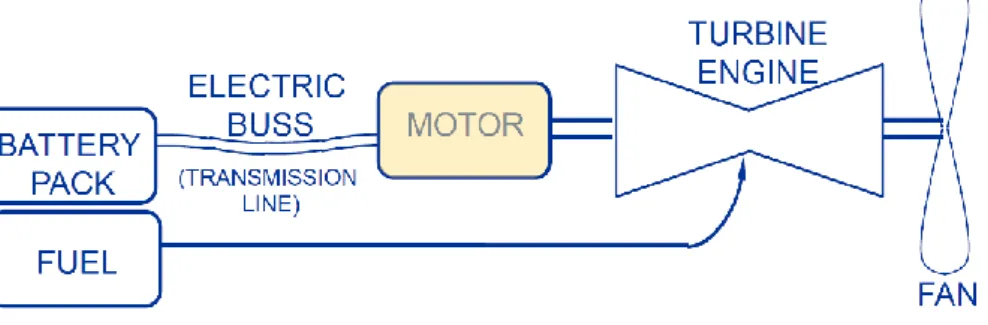
The aircraft requires the most power output (W) during take-off and just a fraction is required during cruise. Therefore, a turbo-electric hybrid turbine combined with a battery could be an alternative to minimize the amount of fossil fuel burned during cruise. Inverters will be used for Direct Current/Alternating Current (DC/AC) conversion and to control the revolutions per minute (rpm) of the motor (Brown, 2011).
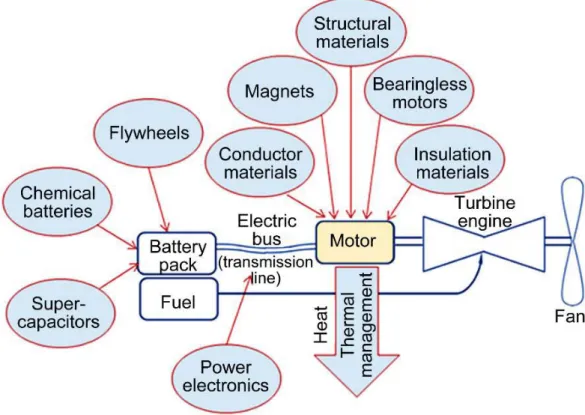
Figure 1 Motor configuration (Brown, 2011).
The hybrid electric system combines the turbine engine and electric motor on one shaft as seen the schematic in Figure 1. Therefore, propulsion comes directly from fuel and electrical power (Denver, et al., 2015).
1.1.3 The benefits of aircraft electric propulsion
According to Brown (2011) new aircraft propulsion system designs are researched to improve multiple problems. Some of these problems are reduction of fossil fuel consumption, noise and emissions. A promising technology is a non-cryogenic electric propulsion system. Such designs can either be made for hybrid systems (gas turbine and battery) or fully electric (through batteries or some other source of energy storage). A problem with the battery powered electrical drive system is the lower power to weight ratio compared to fuel-based gas-turbines. More research is needed to make electric propulsion viable, by increasing the Power to Weight Ratio (PTWR) for the drivetrain. This can be done by improving the components efficiency and reduce the weights. Improvements expected within the next 15 to 30 years includes motor related technologies such as power electronics and improvements to energy storage capacity. The motor efficiency and power density can be increased using improved conductors, insulators, magnets, bearings, structural materials and improving the thermal management of the system. Current state-of-the-art Permanent Magnet- (PM-) motors has a power density of around 5 kW/kg. As stated by Brown (2011) this number is expected to increase to 13 kW/kg
in 15 years, and 26 kW/kg in 30 years. This can be compared to current turbines with a PTWR up to 31kW/kg (Afework, Hanania, Stenhouse, & Donev, 2018).
Duffy (2015) investigated hybrid electric and turboelectric propulsion concepts to reduce fuel burn, emissions and noise for future aircrafts. It was concluded that the parameters that needs to improve is lowering the weight as well as increase the efficiency of the electric motors. These parameters are expected to improve in the coming decades for the Permanent Magnet Synchronous Motor (PMSM) and make hybrid- and turbo-electric propulsion viable.
1.1.4 Inverters
To control the motor an inverter is used to convert the DC from the battery to AC and to supply the motor with the appropriate frequency (Nasir, 2019). This leads to an easy way to control the power output of the motor. The inverter is a static component consisting of diodes, transistors and/or thyristors. The modern inverter can handle powers on a magnitude of MW.
1.2 Purpose
To apply analytical methods to evaluate the main losses of a PMSM intended for electric propulsion system design use.
To determine how the overall efficiency of the PMSM depends on operating temperature, frequency and rotational speed.
Evaluate the limitations of the Electrical PM Motor, looking into what technical & economic aspects that need to improve to make commercial use of electric propulsion viable.
1.3 Research questions
What are the limitations for implementing an electrical motor for upcoming aircraft electric-propulsion?
What are the benefits of using electric propulsion for aircraft applications? How can implementation of an electrical motor reduce emissions during cruise?
1.4 Delimitation
Since there is no current prototype, assumptions of electrical motor size had to be made and compared with previous research. Calculations was done assuming a permanent magnet electrical motor of 1 MW of power output, operating at 7000 to 10 000 rpm. This will only be compared to a gas turbine of the same power output. This thesis project assumed normal temperature conduction materials. The system in question is intended for subsonic use. All calculations are done using theoretical equations.
2
METHOD
Data was gathered from literature and reports on the subject. The gathered data and calculations were analysed in MATLAB. Excel was used to present the data in graphs. The main parameters to calculate are the main losses of the electrical motor and the overall efficiency of the motor. An economic analysis was conducted to compare the fuel- and electricity prices. The results are presented in graphs and tables in the result section.
2.1 Literature Study
To gather information on the field of interest and the current state of technology a literature study was conducted. Information was gathered from different studies researching the losses and the application of electrical motors in aircrafts. Reports were searched via IEEE, which is a database with dissertations, reports and thesis work from around the world.
2.2 Calculations
The information for equations were gathered from research done on PM motors. These equations were analysed and compared to previous research. The equations were implemented in MATLAB. The next step was to determine the input values for the calculations. The input values were extracted from the paper written by Duffy (2015). The values for the loss calculations were used in the designed MATLAB code and the results are presented in the result section. The emission and economic calculations were carried out in Microsoft Excel and presented in graphs and figures.
3
THEORETICAL FRAMEWORK
This chapter supplies a theoretical foundation for the thesis project regarding the environmental impact of the technology, why there is a need for research in aircraft electric propulsion and what kind of electric motor to use in the system. The equations to calculate the main losses of the motor are also introduced.
3.1 Environmental impacts
This section lifts the problem in greenhouse gas emissions in the flight industry and the individual contribution. The benefits of electrical aircrafts are also introduced in this section.
3.1.1 Emissions
The flight industry is claimed to be responsible for 2% of the global CO2 emissions. Research
does however show that this number is somewhat misleading. The CO2 is only a small part of
the greenhouse gasses produced among Nitrous oxides (NOx), soot and water vapor. The NOx
for example forms ozone which is a strong greenhouse gas, but at the same time helps to break down methane. This makes it difficult to estimate the total negative impact of NOx. The soot
and water vapor form contrails that later reforms into cirrus clouds. The cirrus clouds trap heat at night and reflect sunlight at day. These factors make the total negative impact of the flight emissions difficult to estimate. As compensation, most experts favour a “multiplier” of around 2 times the amount of CO2 emissions, leading to a total impact of at least 4% (Clark & Duncan,
2010).
In an article written by Clark and Duncan (2010) people in wealthy countries tend to fly more. Therefore, the CO2 emissions from aviation in the United Kingdom is at least 6.3%. However,
only half of the arriving and half of the departing planes are considered when calculating the total emissions from a country. As stated in the article the number of British passengers on each flight is estimated to about two-thirds. This makes the estimation of total emissions from aircrafts in the United Kingdom an understatement and is more likely around 13-15%.
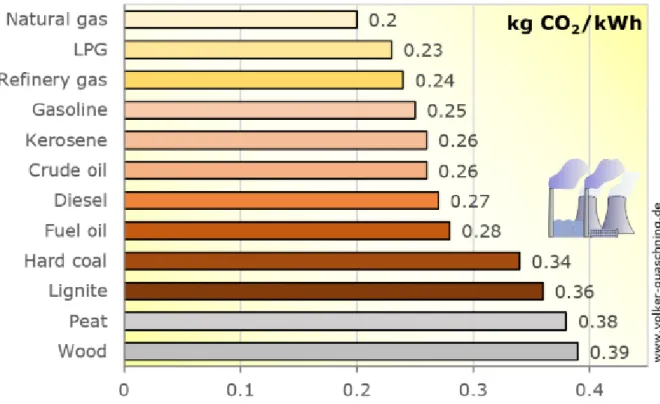
Quaschning and Volker (2019) have summarized a table with the amount of produced CO2/kWh, see Figure 2. The fuel of interest is kerosene as it is the main component in Jet A1
Figure 2 Specific carbon dioxide emissions of various fuels. The fuel of interest is Kerosene (Jet A1) (Quaschning & Volker, 2019).
3.1.2 Fuel consumption
Rypdal (n.d) wrote a paper on the current methodologies in the Greenhouse Gas Inventory Reference Manual (GGIRM) to estimate emissions from aviation. The methodologies presented were discussed regarding viability and accuracy. It was concluded that emissions from domestic aviation is uncertain in many countries.
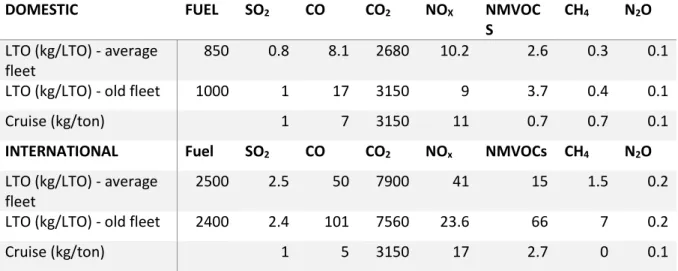
The data in Table 1 presents the amount of emissions for a flight for an average aircraft. It is presented for both domestic and international flight in form of LTO and cruise. LTO stand for
Landing, Taxi/idle and Take-off and cruise represent the period between take-off and landing.
The emissions from LTO is presented as kg per cycle, and the cruise is presented as kg per tonne fuel.
Table 1 Default fuel use and emission factors for average aircraft for LTO cycle (landing, taxi/idle and take-off) and cruise (Rypdal, n.d).
DOMESTIC FUEL SO2 CO CO2 NOX NMVOC
S
CH4 N2O
LTO (kg/LTO) - average fleet
850 0.8 8.1 2680 10.2 2.6 0.3 0.1 LTO (kg/LTO) - old fleet 1000 1 17 3150 9 3.7 0.4 0.1 Cruise (kg/ton) 1 7 3150 11 0.7 0.7 0.1 INTERNATIONAL Fuel SO2 CO CO2 NOx NMVOCs CH4 N2O
LTO (kg/LTO) - average fleet
2500 2.5 50 7900 41 15 1.5 0.2 LTO (kg/LTO) - old fleet 2400 2.4 101 7560 23.6 66 7 0.2 Cruise (kg/ton) 1 5 3150 17 2.7 0 0.1
3.1.3 The individual contribution
Clark and Duncan (2010) suggest the individual person to cut down on air travel to help contribute to reduced emissions. Domestic travel can be done by electric trains, reducing the carbon emissions up to 10 times. The longer the journey the smaller the difference will be. If flight is the only option then choose a daytime flight, with a modern aircraft, with as many people as possible on board.
3.1.4 Electric aircrafts
A benefit of a fully electric aircraft is the potential of greater control of ground-based emissions. Energy production through the electrical grid allows for the use of emission friendly energy sources such as wind, solar and nuclear. Including the total lifecycle CO2, using the US power
grid for charging (456g CO2/kWh) an all-electric aircraft could reduce the overall global
warming impact by 30% (Schäfer, 2018). This assuming the use of upcoming battery technology for energy storage. In Sweden the CO2 emissions from electricity generation is ~13
grams per kilo watt hour (~13g CO2/kWh) (Energirådgivningen, 2018). The average CO2
emission in the Nordic region electricity mix is ~50g CO2/kWh.
3.2 Selection of electrical motor
The most important parameters when choosing an electrical motor for this thesis project were PTWR, efficiency and the total size of the drivetrain. AC motors generally has a higher efficiency than the DC motors, this excludes the DC motor as an alternative. The asynchronous motor also has a lower efficiency which makes the synchronous motor preferable. A challenge with the synchronous motor is the heavy rotor that needs either brushes (increased maintenance) or copper windings coupled with power electronics to magnetize the rotor. This increases the complexity and decreases the reliability of the system. To eliminate these
negative characteristics, the use of permanent magnets instead of windings inside the rotor leads to a more robust, light and effective system. Previous studies have concluded that permanent magnet synchronous machines would be the best choice with its lower losses, superior power to weight ratio and thermal behaviour compared to other electrical machines (Duffy, 2015). Ganev (2015) evaluated multiple types of electrical motors regarding motor-based losses, power density, thermal behaviour, reliability etc. The study concluded that the most favourable machine is the permanent magnet synchronous motor.
One concern with the permanent magnets is the high initial cost. Compared to the drawbacks of other electric motors, the PM-motor is still a preferable choice over other motors and therefore makes the PM-motor a great candidate for further research (Alfredsson & Jacobsson, 2016). The machines considered in this thesis is a size of 1MW operating at a voltage of 700V.
3.3
Losses
There are several losses in the PM-motor that must be considered when designing an aircraft propulsion system. This thesis project will mainly focus on the impact of losses in the electrical motor. The losses that will be discussed are as follow:
• Stator losses ▪ Ohmic loss ▪ Core loss ▪ Hysteresis loss • Rotor losses • Windage losses 3.3.1 Stator losses
An electrical motor generally comprises of 2 main parts, the stator and the rotor. The stator is a static component containing windings of an electrically conductive material and thin lamination plates stacked together. The stator losses may be divided into Ohmic- (copper-), Core- and Hysteresis loss.
3.3.1.1.
Ohmic loss
The ohmic losses are generated by the electrons surging through the conductor. The resistivity in the conductor will lead to heat generation.
Equation 1
𝑃𝑐𝑢 = 𝑚1𝐼2𝑅
To calculate the ohmic losses Equation 1 is used, where m1 is the number of phases, I is the root
3.3.1.2.
Core loss
The core losses (also known as iron losses) is generally the second largest loss in the PMSM. This loss is a result of time-variation in the magnetic flux density throughout the stator core. To lower the eddy current losses (which is the induced current in the core) the thickness of the lamination plates can be decreased. Lowering the thickness t from 0.5 mm to 0.35mm, the total eddy current losses can be reduced to half by using Equation 2 according to Hendershot and Miller (2010). Equation 2 𝐶𝑒= 𝜋2𝑡2𝜎 6𝜌𝑚 Equation 3 𝑃𝑐𝑜𝑟𝑒 = 𝐶𝑒𝐵𝑝𝑘2 𝑓2
The peak magnetic flux density Bpk is assumed to vary from 1.0 to 2.0 Tesla and is derived from
the hysteresis curve. The current state-of-the-art PMs has a Bpk of 1.51 Tesla. According to
Denver et al. (2015) this will increase to 1.65 Tesla in 30 years. Equation 2 calculates the coefficient Ce which is a lamination parameter where t is the lamination thickness, σ is the
3.3.1.3.
Hysteresis curve
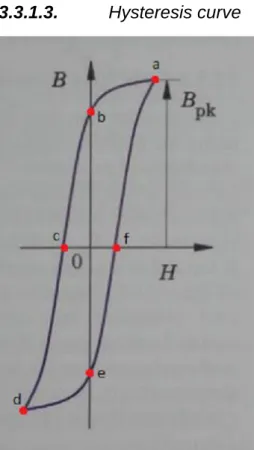
Figure 3 Generalized representation of the Hysteresis curve (B-H curve) (Hendershot & Miller, 2010).
Hendershot and Miller (2010) explains that the hysteresis curve is a correlation between magnetic flux density (B) and the magnetizing force/magnetic field strength (H) and shows the behaviour of the magnetic properties of a material. The magnetic field strength is proportional to the current running through a coil. As seen in Figure 3 the initial magnetic flux of a fully un-magnetized material will follow the dashed line up until point “a”. At this point the material is said to be fully magnetized i.e. saturated and the molecular magnets are aligned. At this point an increase in current will have minimal effect on the magnetic field strength. When reducing the magnetic field strength to zero the magnetic flux density of the material will not follow the dashed line back to the point of origin but will follow the line to point “b”. This is known as residual magnetism/remanence. The magnetic flux will remain in the material due to that the molecular magnets do not fully revert to the non-magnetic state. Applying an AC voltage to the coil will result in a B-H curve that follow the path: a-b-c-d-e-f-a. This is the Magnetic Hysteresis Loop.
When the magnetic field is removed some materials will retain the magnetic flux density better than others resulting in a magnetically hard (high remanence) or magnetically soft (low remanence) material (Alfredsson & Jacobsson, 2016). As a result, a larger current (coercive force) must be applied to counter the residual magnetism. It is this extra work that lead to the hysteresis loss in the permanent magnet motor (Ph).
3.3.2 Windage loss
The windage loss is dependent on the generated heat in the fluid inside the motor (in this case air) and contribute more in high speed motors (Huynh, Zheng, & Acharya, 2009). The windage loss is a function of shaft rotational speed 𝜔 and fluid properties according to Reynolds number (Re) inside the motor.
Equation 4
𝜔 =
2 𝜋 𝑁
𝑓
Equation 5 𝑅𝑒 = 𝜔 𝑟 (𝜌 𝜇) 𝛷 Equation 6 𝑃𝑊= 𝐶𝑑 𝜋 𝜌 𝜔3𝑟4𝜆 Equation 7 𝐶𝑑 ≈ 0.0725 ∗ 𝑅𝑒−0.20Where N is the mechanical frequency and f is the electrical frequency, r is the radius of the rotor, 𝜌 is the density of the fluid, 𝛷 is the radial gap in between the rotor and stator, and 𝜇 is the kinematic viscosity of the fluid and 𝜆 is the total length of the rotor. An approximation of coefficient of friction, Cd, could be made with Equation 7 (Rucker, 2005).
3.3.3 Rotor loss
Huynh, Zheng and Acharya (2009) explains that the most significant causes of the rotor loss are space harmonics due to stator slot openings and winding distribution as well as time harmonics of the phase currents caused by the pulse width modulation. The authors evaluated the losses in a high-speed permanent magnet machine and their study presented a summary of the losses. The rotor loss for a PMSM was estimated to ~0.2% in their study. This value was used when determining the total efficiency of the PMSM for this thesis project.
3.4
Inverters
By using silicon carbide (SiC) inverter technologies the switching frequency can be increased significantly, allowing the use of faster and more light-weight motors (Denver, et al., 2015). Optimized switching methods increases the efficiency and further reduce mass. SiC is more durable than classic compounds. It is resistant to high temperatures and has increased
electrical conductivity. This leads to less heat generation and a decreased temperature sensitivity. Thereby reducing the cooling demand. They also occupy a smaller area which is of great importance to increase overall efficiencies.
Denver et al. (2015) claims that a modern inverter can achieve an efficiency up to 99% which makes the implementation of SiC favourable. Studies show that a SiC inverter enables a 50% reduction in module size and up to 70% reduction in power losses compared to classic compounds.
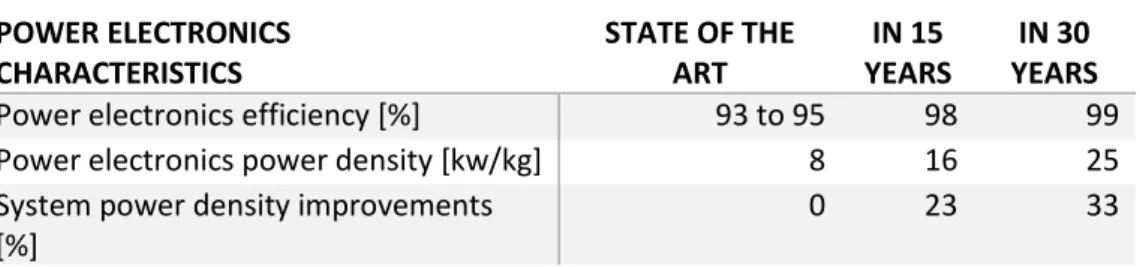
Table 2 Power Electronics Characteristics (Denver, et al., 2015).
POWER ELECTRONICS CHARACTERISTICS STATE OF THE ART IN 15 YEARS IN 30 YEARS Power electronics efficiency [%] 93 to 95 98 99 Power electronics power density [kw/kg] 8 16 25 System power density improvements
[%]
0 23 33
As seen in the Table 2 inverters are expected to improve by a considerable amount in the coming years, achieving an PTWR of 25kW/kg.
3.5 Batteries
To drive the electrical motors a power source is needed, either a generator or a battery-pack. One of the current problems with state-of-the-art batteries are the low power density of the cells, requiring considerably more weight for each kWh of energy compared to fuel.
An important note for the batteries is that the weight remains constant during flight, and not decreasing when consumed, which is the case with regular gas turbine fuel such as Jet A1. As the fuel is consumed during flight, the total weight of the aircraft decreases which in turn leads to reduced fuel consumption over time. A modern battery today has around 0.2 kWh/kg of stored energy, compared to Jet A1 which contain 11.9 kWh/kg (Denver, et al., 2015).
Batteries are expected to improve in the coming years. The predicted increase in power to weight ratio are presented in Table 3 (Denver, et al., 2015).
Table 3 Improvements in battery density. (Denver, et al., 2015)
EXPECTED IMPROVEMENTS OF BATTERY TECHNOLOGY Today 0.2 kWh / kg 15 years 0.5 kWh / kg 30 years 1.2 kWh / kg
3.6
Future technologies
With current technology it is more viable to use a hybrid electric system to reduce emissions of greenhouse gases (Brown, 2011). In the future the use of cryogenics seems more attractive due to the increased efficiency and reduced energy consumption. The inverters for example have shown an increase in both power density and efficiency. This performance improvement is a result of lower temperatures, higher switching frequencies and lower resistance in interconnections. The main drawback is that further research is necessary to implement this technology.
Figure 4 Technology improvement areas for electric propulsion (Denver, et al., 2015).
Improvements needs to be made in all areas illustrated in Figure 4. Some improvements are for example reducing weight and increasing efficiency.
4
CURRENT STUDY
This study focused on the main losses in the PMSM. The losses included are ohmic-, core- and windage losses. An economic comparison of a gas-turbine and the electrical motor was assessed. An estimation of the potential reduction in emissions was conducted.
The ohmic loss was calculated at two different voltage levels as a function of temperature. The core loss was calculated at three different magnetic flux densities as a function of frequency. The windage loss was calculated as a function of rotational speed with air as fluid. The economic assessment was based on fuel price and PTWR. The emissions reduction was estimated during a 2-hour cruise.
4.1.1 Operating voltage
According to Brown (2011) the ohmic losses may be reduced by operating at a higher voltage. This will result in a higher overall efficiency. A voltage of 700V (present) and 1000V (future) has been considered for this thesis. Increasing the voltage requires thicker and costlier insulation and will expedite the degradation of the insulation material due to partial discharge. Corona losses also becomes an issue above 700V. The voltage will probably increase in the coming 30 years when better materials become available.
4.1.2 Operating temperature
Permanent magnets are sensitive to temperature in the way that if it is heated above the Maximum Operation Temperature (MOT) it will lose some of its magnetization. The permanent magnet will lose all its magnetic properties if the temperature increases even further, this temperature is known as the Curie temperature. The MOT for neodymium magnets depends on their classification grade and vary from 80°C to 230°C. Therefore, it is crucial to keep the temperature of the magnets below the MOT (Supermagnete, 2019). This thesis project used a temperature range of 0°C-230°C.
4.1.3 Ohmic losses
To calculate the ohmic losses in the stator the current [A] of the motor had to be known. Since we knew the power output of the motor (1MW) and the operation voltage (700V and 1000V) the current for both voltage levels could be derived by combining Equation 8 and Equation 9.
Equation 8 𝑈 = 𝑅𝐼
Equation 9 𝑃 = 3𝑈𝐼
U is the voltage level, I is the current, R is the resistance of the copper and P is the output power
of the motor. The most common material used in the stator windings is copper. The resistivity
ρ20 of copper at 20°C is 1.725*10-8 Ωm but varies with temperature according to Equation 10.
Equation 10 𝜌 = 𝜌20∗ (1 + 𝛼 ∗ (𝑇 − 20))
Where 𝜌 is the total resistivity, α the increase in resistivity for each degree and T is the temperature of the windings. According to Hendershot and Miller (2010) the total resistance is a function of total length and area of the copper winding.
Equation 11 𝑅 = 𝜌 ∗ 𝑙
𝐴
The total length and area of the windings was calculated to get the total resistance. The cable area A was derived from Equation 12. This could be done by assuming the value of windings in one coil N to 48 (Vratny, Seitz, & Hornung, 2014).
Equation 12 𝑃𝑑𝑒𝑠𝑖𝑔𝑛= 𝑁 ∗ 𝐵 ∗ 𝐴 ∗ 𝐼 ∗ 𝑤𝑚𝑜𝑡𝑜𝑟
The total length l of the conductor could be derived from Equation 13 by substitution.
Equation 13 𝐵 =𝐼 ∗ 𝑁
𝑙
When all parameters of Equation 11 was known the ohmic losses was plotted in a graph using MATLAB. The calculations are made using three-phase windings. The temperature was set to an interval of 0-230°C.
4.1.4 Core losses
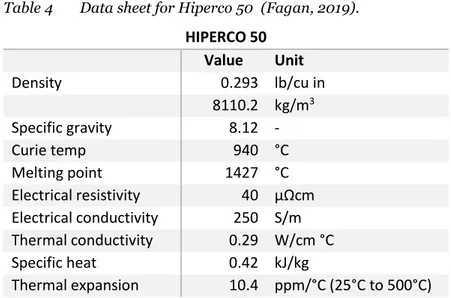
To be able to get a valid result, data from lamination plates used in today’s stators were chosen. The lamination used is Hiperco 50.
Table 4 Data sheet for Hiperco 50 (Fagan, 2019).
HIPERCO 50 Value Unit Density 0.293 lb/cu in 8110.2 kg/m3 Specific gravity 8.12 - Curie temp 940 °C Melting point 1427 °C Electrical resistivity 40 μΩcm Electrical conductivity 250 S/m Thermal conductivity 0.29 W/cm °C Specific heat 0.42 kJ/kg Thermal expansion 10.4 ppm/°C (25°C to 500°C)
From this data sheet in Table 4 the conductivity was set to 250 S/m and the density of the lamination plates to 8110.2 kg/m3. The thickness of the lamination is set to 0.35mm. The
weight of the stator is 58.3kg (Duffy, 2015). With these values as inputs for Equation 3 the coefficient Ce can be calculated. The core loss was calculated by using Equation 2 with input
values of the peak magnetic flux density set to 1.0T, 1.5T and 2.0T with a frequency that vary from 50-1000Hz. The frequency span is chosen to illustrate a wide selection of operating frequencies.
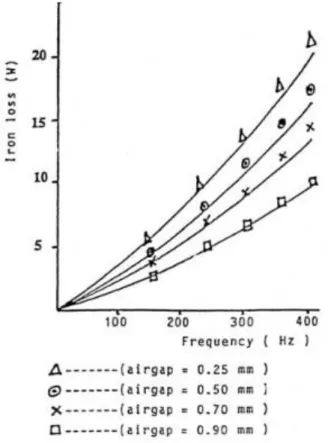
Figure 5 illustrates how the frequency affects the core loss at different airgaps between the rotor and stator. A larger airgap will result in a lower loss. Therefore, this thesis project assumes an airgap of 0.90mm.
Figure 5 Iron loss depending on various frequency at different air gaps (Perrymam & Mhango, 2006).
4.1.5 Windage losses
Table 5 presents the parameters to calculate the windage loss. The kinematic viscosity and the density for air is assumed at atmospheric pressure and 55°C. The width of the airgap between rotor and stator were chosen to 0.9mm. The rotational speed is set to a range between 7000 and 10000 rpm. The length of the rotor was set to 97 mm and the radius of the rotor to 146 mm. These values were chosen with respect to the size of the motor used in the paper written by Duffy (2015), which is a 1MW motor and operating at 7000 rpm.
Table 5 Input data for windage loss calculation (data taken for air at 1 atm and 55 degrees Celsius) (Munson, Okiishi, Huebsch, & Rothmayer, 2013).
4.1.6 Total efficiency
In this thesis project we have assumed that the input power is unknown, and the output is 1MW. Therefore, to calculate the input power, the losses are added to the output. The output of the motor is divided by the input to calculate the efficiency. Pout is 1MW and Pin is the sum
of Pout and all the losses.
Equation 14
𝜂
𝑚𝑜𝑡𝑜𝑟=
𝑃𝑜𝑢𝑡𝑃𝑜𝑢𝑡+𝑃𝑂ℎ𝑚𝑖𝑐+𝑃𝐶𝑜𝑟𝑒+𝑃𝑊𝑖𝑛𝑑𝑎𝑔𝑒
4.2 Emission
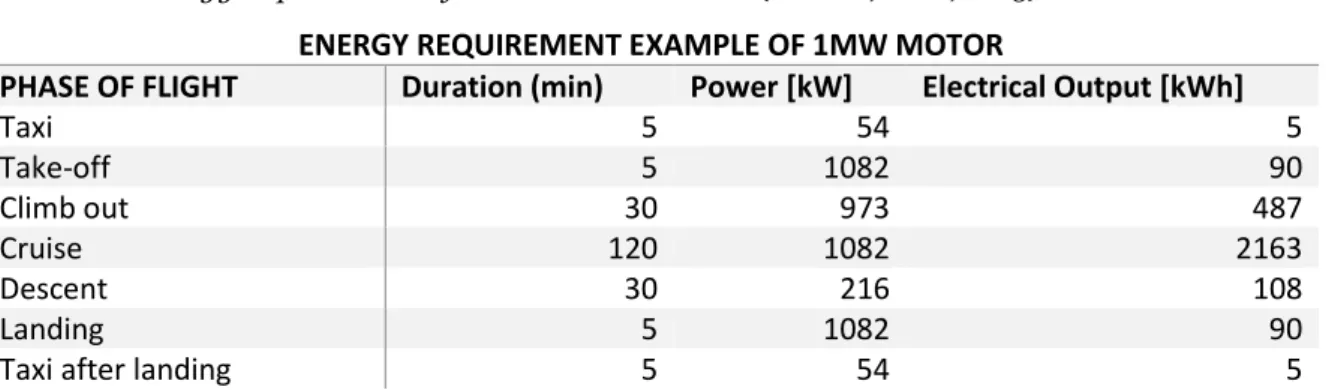
The energy requirement of a 1MW electrical motor is presented in Table 6. Most of the total energy (Wh) demand is during the cruising phase of the flight. Important to notice is the lower electricity consumption during the cruise compared to the LTO (Landing, Taxi/idle, Take-off) cycle.
Table 6 Energy requirements of 1MW electrical motor (Denver, et al., 2015).
ENERGY REQUIREMENT EXAMPLE OF 1MW MOTOR
PHASE OF FLIGHT Duration (min) Power [kW] Electrical Output [kWh]
Taxi 5 54 5 Take-off 5 1082 90 Climb out 30 973 487 Cruise 120 1082 2163 Descent 30 216 108 Landing 5 1082 90
Taxi after landing 5 54 5
The CO2 emissions were calculated using data from Figure 2, Table 5 and the efficiencies of a
gas turbine (60%) and an electrical motor (91%). The power needed during cruise is stated to be 2163 kWh. The emissions per kWh for kerosene (Jet A1) is 0.26 kg CO2. The emission per
PARAMETER VALUE
n: Rotational speed [rpm] 7000-10000 ρ: Density of the fluid (air) [kg/m3] 1.225
µ: Kinematic viscosity of fluid (air) [m2/s] 1.822*10-5
φ: Radial length of the gap between rotor and stator [m]
0.9*10-3
r: Radius of rotor [m] 0.146 λ: Length of rotor [m] 0.097
kWh of electricity in Sweden, the Nordic region, and the USA is 0,013-, 0,050- and 0.456- kg CO2 respectively. The result will be presented in a graph to compare how much CO2 emissions
there would be if the batteries were only charged in a specific region compared to the gas turbine.
4.3 Power to weight ratio
A comparison regarding PTWR of a modern gas turbine and the electrical system (motor, inverter and battery) was made to illustrate the predicted development. Estimated weights in 15 and 30 years was calculated. Data from section 3.2, 3.4 and 3.5 was used. The inverter was included because it will be needed if using a battery, which is the most probable source of energy to be used.
Data from Table 4 and Table 6 was used to make a comparison of the energy storage of the batteries and the energy density of Jet A1. The current state-of-the-art batteries and the 15- and 30-years estimations are used in the comparison.
The total PTWR including motor, inverter and battery was then calculated to be compared with the gas turbine including fuel.
4.4 Economics
The biggest drawback of the electrical drivetrain is the low power to weight ratio compared to a modern turbine (Environment, 2009). The turbine delivers six times more power per kg. By minimizing the total energy loss in the electrical drivetrain, it is possible to reduce the life cycle cost of the system.
A gas turbine is highly complex and requiring large expanses in maintenance (Denver, et al., 2015). The decreased complexity of the electric drivetrain is expected to lower maintenance costs. In 15 years, estimations of maintenance savings are 1 million USD/plane/year, and up to 2 million USD in 30 years. Cost benefits include elimination of oil consumption, reduction of rotor system maintenance costs, lower initial cost at purchase and improvements of electrical motor efficiencies of up to 1%. This assuming a system running on batteries and not a hybrid engine.
4.4.1 Energy price comparison
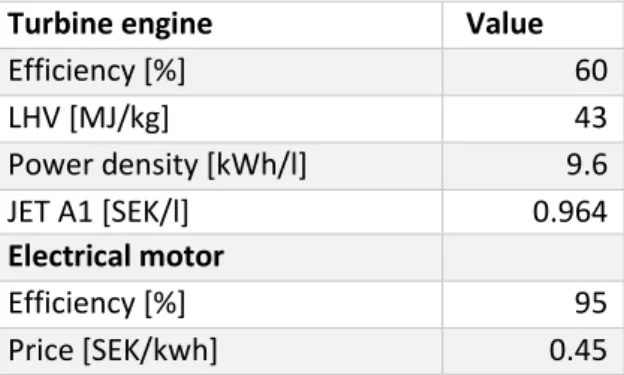
The most common fuel-type used for an airplane turbine is Jet A1 and is therefore used for this comparison. The prices for Jet A1 was taken from Hjelmco (2018) and the electricity price from Nordpool (2019).
Table 7 Comparison of Turbine engine and Electrical motor energy cost. The lower heating value (LHV) is taken from ExxonMobil (2019).
Turbine engine Value
Efficiency [%] 60 LHV [MJ/kg] 43 Power density [kWh/l] 9.6 JET A1 [SEK/l] 0.964 Electrical motor Efficiency [%] 95 Price [SEK/kwh] 0.45
All prices are before taxes in Sweden, and the losses of both motors will be considered in the calculations. The electrical system is assumed to have an efficiency of 91% and the gas turbine 60%. Using Table 7 the price of each kWh of energy was calculated by dividing the price of energy with the efficiency of each engine. The result was plotted in Figure 13 for comparison.
4.4.2 Comparison of gas turbine and electrical propulsion
To be able to compare the operational cost of the gas turbine and electrical motor, the energy price and power to weight ratio was compared. A comparison of the price for 1MW of output power was made by multiplying the energy cost with the weight of each motor. This was done for the PTWR of today, 15 years and 30 year to be able to do an estimation of the break-even point. The results were plotted in Figure 14.
5
RESULTS
The following section presents the results concluded in the current study. The main parameters affecting the losses of the PMSM are presented. The limiting factors of the estimated technology improvements are examined, and the economic viability of a gas-turbine compared to an electrical system is presented.
5.1 Losses
By calculating the main losses of the PMSM, the limiting factors of the motor could be derived. By assessing the graphs of the three losses; ohmic, core and windage, the main parameters to improve of each loss could be concluded.
5.1.1 Ohmic losses
Figure 6 Copper loss as a function of temperature at 700V and 1000V.
The ohmic losses was calculated by using Equation 1 and Equation 8 - Equation 13. What can be derived from Figure 6 is the importance of increasing the input voltage of the system. An increase in voltage from 700V to 1000V can reduce the ohmic losses by up to 49%. As seen in the graph at 700V, an increase in temperature of 50°C will correspond to a ~1.3kW loss. While
at 1000V, the same temperature increase will correspond to a ~0.62kW loss for the 1MW motor.
5.1.2 Core loss
Figure 7 Core loss per kilogram depending on frequency for Hiperco 50 lamination at different magnetic flux densities.
By using Equation 2 and Equation 3 the core losses may be presented in Figure 7 and the losses were calculated at different magnetic flux densities and with varying frequency. Since the magnetic flux density is squared when calculating the core loss, a higher Bpk will result in a
higher loss, as shown in Equation 3. The coefficient Ce is calculated by using Equation 2
dependent on parameters specific to the type of lamination plates and do not change. What can be interpreted is that the core losses will increase with both magnetic flux density and frequency.
5.1.3 Windage losses
Figure 8 How the windage loss increases with the rotational speed of the rotor.
The windage loss is calculated by using Equation 4 - Equation 7. As seen in Figure 8 the windage losses will increase with the rpm of the rotor. The Reynolds number at 7000 rpm is ~4.5*104, which is turbulent flow (Munson, Okiishi, Huebsch, & Rothmayer, 2013). Since
Reynolds number is dependent on the velocity, it will increase along with rpm. What can be interpreted from Figure 8 is that the windage loss increases slightly exponential in the given interval. Therefore, the losses will be larger at higher rotational speed.
5.1.4 Total efficiency
Equation 14 is used to calculate the total efficiency of the PMSM at 1MW. The core-, copper-, windage- and rotor (0.2%) losses was added. The ohmic losses are extracted at 700V and 55°C, the core losses at 890Hz, 1.5T and the windage losses at 8500 rpm. This results in a total efficiency of 91,26%. The same efficiency calculation was done with 1000V and 1.65T and results in an efficiency of 90,2%.
5.2 Power to weight ratio
Figure 9 Power to weight ratio expectance of PMSM. The PTWR of the gas-turbine is assumed to constant (Afework, Hanania, Stenhouse, & Donev, 2018) (Brown, 2011).
The expected PTWR of the PMSM will increase in the future as presented in Figure 9. The red line represents the current PTWR of the gas-turbine, see section 1.1.3. The blue line represents the expected improvement of PTWR of the PMSM from section 1.1.3. Today the PTWR is roughly 16% of the gas-turbine, but in 30 years it will increase to ~81%.
Figure 10 PTWR of the system including electrical motor and inverter.
By combining the PTWR of the PMSM with the inverter we get a better estimate of the total PTWR of the system. Figure 10 shows the estimated PTWR of the electric system (excluding the battery). In 30 years of time the expected PTWR of the combined system is about one third of that of a current gas turbine (31kW/kg), see Figure 9.
0 5 10 15 20 25 30 35 Today 15 30 PT WR [kW /kg] Time [yrs]
Power to weight ratio expectance of PMSM
PMSM Turbine 0 1 2 3 4 5 6 7 8 9 10 0 15 30 PWTR [ kW /kg] Time [yrs]
Figure 11 Comparison in power density of battery PTWR and the improvements with Jet A1.
It can be seen in Figure 11 that the power density of the battery is one-tenth that of Jet A1 in the 30-year estimation. Accounting for effective energy use with an efficiency of 60% for the turbine and 91% of the electrical system we get about one-sixth of effective output in the battery compared to the fossil fuel gas-turbine.
Figure 12 PTWR of motor, inverter and battery combined.
Figure 12 presents the combined PTWR of the PMSM, inverter and the battery. The PTWR got lower when including the battery in the system. With data from Table 7 and section 1.1.3 (PTWR of gas-turbine) the combined PTWR of the gas-turbine and Jet A1 is 8.52kW/kg. This is 8 times higher than the electrical system in 30 years.
11,9 11,9 11,9 0,2 0,5 1,2 0 2 4 6 8 10 12 14 0 15 30 kW h /kg Time [yrs]
Comparison of battery power density with Jet A1
0 0,2 0,4 0,6 0,8 1 1,2 0 15 30 PWTR [ kW /kg] Time [yrs]
5.3 Economics
Figure 13 Price comparison of fuel (Jet A1) and electricity for one kWh of energy used.
The price of a kWh of energy was calculated according to section 4.4.1. As presented in Figure 13 the price of electricity is 30% of the price of Jet A1. However, the power to weight ratio of the turbine is 6 times greater than that of the electrical motor, see Figure 9 (data for today).
Figure 14 Comparison of the flight cost with respect to fuel price (Jet A1 and electricity) and PTWR.
Figure 14 presents the PTWR estimation calculated from Figure 10, combined with the cost of 1 kWh of energy (see Figure 13), as described in section 4.4.2. Using today’s prices for electricity in Sweden combined with the estimated PTWR in 30 years for the electrical system, the difference between gas turbine and electric propulsion is almost gone. The weight of the fuel and the battery is not included in Figure 14.
0 0,2 0,4 0,6 0,8 1 1,2 1,4 1,6 1,8 Price [ SE K]
Price/ kWh of used energy
Jet A1 Electricity 0 50 100 150 200 0 15 30 Price [ SE K]
Time interval [yrs]
Comparison of operation cost
5.4
Emission
Figure 15 The amount of carbon dioxide produced during a 2h cruise for a gas turbine compared to fully electrical charge in Sweden, Nordic region and USA.
Figure 15 represent the CO2 emission during cruise, see Table 6 and section 4.2. The carbon
dioxide emission from gas-turbines using Jet A1 (kerosene) as fuel will produce ~937 kg CO2
during the cruise presented in Table 6. Using electricity from the Swedish market to fully support the cruise will result in ~31 kg CO2 and using the electricity from the Nordic region
will result in ~119 kg of produced CO2 during the cruise. An interesting result is using the
electric grid in the USA, which will result in ~1084kg CO2 during cruise. The CO2 emission from
Jet A1 is ~3000% higher than by using electricity from Sweden, and ~790% by using electricity from the Nordic region.
0 200 400 600 800 1000 1200 Carb o n d ioxid e [kg]
CO
2emission during cruise
6
DISCUSSION
Here we discuss the findings during our period working with the subject of future electrification of aircraft. Both possibilities and limitations are bought up and possible solutions are discussed.
6.1 Motor losses
Exact specifications of a PMSM was troublesome to find and assumptions from previous studies had to be used with appropriate modifications. When calculating the current of the system, the assumption of input power at 1MW will differ from reality.
The core losses will depend exponentially on frequency and scale with magnetic flux density. The loss increases with a higher magnetic flux density but is needed to decrease the total size of the rotor. The lower weight is an important aspect for aircraft application.
When analysing the windage loss and the affecting parameters we can establish that the main contributing factors is rpm, the fluid properties and the size of the rotor. The determined rotor size may cause an over- or under- estimation of the windage loss when relating to a real machine. However, for this project the loss calculation gives a good overview of the windage loss contribution and the parameters of importance. An important factor to keep in mind is that the density and kinematic viscosity of air is taken at specific conditions and will need alteration when calculating the windage loss at varying operating conditions. The resistivity of the windings needs to be lowered, the frequency of the stator needs to be low and the size of the rotor must be designed to be small to lower the windage losses.
6.2 Power to weight ratio
The steady increase of the PTWR of the PMSM looks promising for implementation in aircraft propulsion systems. With the expected improvements in the coming 30 years, the PMSM will have about 81% of the PTWR of the gas-turbine. This if the gas-turbines will not improve in PTWR.
A big challenge to overcome is the storage of energy for the electrical motor. Just one-tenth of the energy can be stored per kilo of weight in a battery compared to Jet A1 30 years from now, if following the estimated increase. Another drawback is that the weight of the aircraft will be the same during both take-off and landing. The amount of fuel decreases during the flights with a gas turbine and limits the potential danger in the event of a malfunction when landing. Because the battery system is much heavier than fuel, the aircraft will not be able to freight as much goods which will limit the economic value of each flight.
A problem with the current suggested system is the use of the DC power delivered required by the battery when the PMSM needs AC to operate. This leads to the required use of an DC/AC inverter, increasing the total weight of the system further. This drastically lowers the total
PTWR of the system to just one-third of that of a gas turbine in 30 years instead of four-fifths. When considering adding the disadvantages of the batteries energy density with that of the electrical system (one-eighth), the PTWR needs to increase drastically.
6.3 Economics
The price of jet fuel is around 3 times greater than that of electricity (including losses) excluding taxes. The incentive to implement a cheap to purchase and cheap to operate electrical/hybrid motor could benefit both customers and companies. If the comparable weight and range of both systems were similar, the prices to operate an airplane could drop considerably.
Because of the low PTWR for the electrical system, tax regulations could be implemented by governments to make the fossil fuel gas turbines less profitable. For example, by increasing the prices of the fuel or implementing CO2 tax regulations. More money could be saved on the
maintenance as mentioned in section 4.4.
A problem to be solved with all types of electrical aircraft propulsion systems is making the systems economically viable. Taxes and government regulations could be a way to make the gas turbines more expensive to operate, while technology need to improve to increase the economic viability of the electrical propulsion system.
6.4 Emissions
The results from the emission calculations are interesting due to the carbon dioxide emissions vary depending on the supplied electricity. Sweden has a high fraction of renewable energy and very low CO2 emission rates compared to the electricity production in USA. An interesting
aspect is that the Nordic region and USA consist of large and fully or partly independent regions which can influence the electricity production. This can result in an increase or decrease in produced carbon dioxide depending on future electricity production. By implementing electric propulsion to a larger extent, and if countries would increase the amount of fossil free energy sources when producing electricity, the amount of emissions in the aircraft industry could also decrease. The reduced overall emissions could allow for more domestic flight, which are releasing the most emissions for a travelled distance today. However not flying at all, choosing other means of transportation will remain the best way to keep the emissions low and minimize an individual’s personal carbon footprint.
7
CONCLUSIONS
The efficiency of the PMSM is calculated to be around 91% and will be a critical parameter to improve. The attention of future development needs to focus on the increase in PTWR and efficiency, finding materials and designs to enable this. The ohmic losses may be further reduced by maintaining a low temperature, operate at an increased voltage and developing materials (conductors, insulators etc.) that can withstand a higher voltage and with lower resistivity. The core losses can be kept at a minimum by keeping the electrical frequency low and using thin lamination plates. The windage loss will have a greater impact on the machine with high rotational speed and there are many factors that play a great role. The size of the rotor is one parameter that is worth to keep in mind since it also affects the weight of the motor, which in turn will affect the PTWR.
Regarding implementing electric propulsion systems for commercial aircraft applications, it is not viable today due to the low PTWR limiting the potential freight weight. For the electric system to be viable the energy density of the batteries needs to increase more than currently estimated or another source needs to be found. By increasing the total efficiency of the electrical system, a smaller battery could be used to improve the PTWR.
The technological limitation to overcome seems to be the energy density of the energy storage. The battery does not come close in the foreseeable future compared to fossil fuels regarding energy density. The energy storage for electrical propulsion will be a big factor to overcome for economic sustainability. Savings in maintenance may serve as a mean to bridge this gap. A life cycle analysis for a hybrid and an electrical system is needed to draw final conclusions. Regarding reduction in emissions, the use of a PMSM in aircraft propulsion would be highly favourable if clean electricity is used. The biggest advantage of the electric system is the potential to lower the emissions. If charging the batteries with clean electricity, reduction of CO2 pollution of up to 3000% could be achieved. While technology is maturing over the coming
30 years, a hybrid motor could be a possible solution to bridge the gap between the gas turbine and the pure electrical propulsion system.
8
SUGGESTIONS FOR FURTHER WORK
An interesting path for further research would be analysing a specific motor with more distinct parameters and operating conditions. This thesis work involved a fictive motor. Therefore, a case with more detailed information would be of interest. Another path would be to delve deeper into what requirements exists for different operating conditions such as aircraft-, naval- or automobile applications for the system. Another path would be to focus on specific losses and make detailed calculations and monitor specific parameter. Looking at alternative energy sources to the battery such as fuel cells or biofuel could be of interest. Lastly, it would be interesting to explore the area of cryogenics to see how this can affect the efficiency of the PMSM and inverter.
REFERENCES
Afework, B., Hanania, J., Stenhouse, K., & Donev, J. (2018, September 3). Specific power. Retrieved from https://energyeducation.ca:
https://energyeducation.ca/encyclopedia/Specific_power
Alfredsson, A., & Jacobsson, K. A. (2016). Elmaskiner och elektriska drivsystem. Liber AB. Brown, G. V. (2011). Weights and Efficiencies of Electric Components of a Torboelectric
Aircraft Propulsion System. Cleveland, Ohio: NASA.
Clark, & Duncan. (2010, April 6). The Guardian. Retrieved from
https://www.theguardian.com/environment/2010/apr/06/aviation-q-and-a Denchak, M. (2018, June 29). NRDC. Retrieved from nrdc.org:
https://www.nrdc.org/stories/fossil-fuels-dirty-facts
Denver, T. P., Duffy, K. P., Provenza, A. J., Loyselle, P. L., Choi, B. B., Morrison, C. R., & Lowe, A. M. (2015). Assessment of Technologies for Noncryogenic Hybrid Electric
Propulsion. Cleveland, Ohio: NASA.
Duffy, K. P. (2015). Electric Motor Considerations for Non-Cryogeneic Hybrid Electric and
Turboelectric Propulsion. Orlando, Florida: Propulsion and Energy Forum.
Energirådgivningen. (2018, September 19). Energi- och Klimatrådgivnignen. Retrieved from energiradgivningen: https://energiradgivningen.se/klimat/miljopaverkan-fran-el Environment, S. F. (2009, June 30). Motorsummit. Retrieved from
https://www.motorsummit.ch/sites/default/files/2017-06/permanent-magnet-motors_en.pdf
European Commission. (n.d.). Reducing emissions from aviation. Retrieved from ec.europa.eu: https://ec.europa.eu/clima/policies/transport/aviation_en ExxonMobil. (2019). exxonmobil.com. Retrieved from
https://www.exxonmobil.com/en/aviation/products-and-services/products/jet-a-jet-a-1
FAA. (2018, November 26). Retrieved from faa.org:
https://www.faa.gov/air_traffic/by_the_numbers/
Fagan, E. (2019). edfagan. Retrieved from edfagan.com: https://edfagan.com/hiperco-50-coil.php
Gaj, E. (2018, September). Techcrunch. Retrieved from techchrunch.org:
https://techcrunch.com/2018/07/08/the-electric-aircraft-is-taking-off/?guccounter=1&guce_referrer_us=aHR0cHM6Ly93d3cuZ29vZ2xlLnNlLw&guce _referrer_cs=aoruB4L7BlWJafXziFuKZg
Ganev, E. (2015). Selecting the Best Electric Machines for Eletrical Power-Generation
Systems. IEEE .
Hendershot, J. R., & Miller, T. J. (2010). Design of brushless permanent-magnet machines. Florida: Motor Design Books LLC.
Hjelmco. (2018, January 01). Hjelmco.com. Retrieved from http://www.hjelmco.com/news.asp?r_id=181270
Huynh, C., Zheng, L., & Acharya, D. (2009). Losses in High Speed Permanent Magnet
Machines Used in Microturbine Applications. Cerritos, California: ASME.
Munson, B. R., Okiishi, T. H., Huebsch, W. W., & Rothmayer, A. P. (2013). Fluid Mechanics. John Wiley & Sons.
Nasir. (2019, May 02). engineering.electrical-equipment.org. Retrieved from
http://engineering.electrical-equipment.org/electrical-distribution/what-is-an-inverter.html
Nordpool. (2019, April 25). Nordpoolgroup.com. Retrieved from https://www.nordpoolgroup.com/
Perrymam, R., & Mhango, L. M. (2006). High Efficiency High Speed PM Motors for the
More Electric Aircraft. Lisbon, Portugal: International Conference on Power Systems.
Quaschning, & Volker. (2019, May 12). Quaschning. Retrieved from
Volker-Quaschning.de: https://www.volker-quaschning.de/datserv/CO2-spez/index_e.php Rucker, J. E. (2005). Design and analysis of a permanent magnet generator for naval
applications. Monterey, California: Calhoun: The NPS institutional Archive.
Rypdal, K. (n.d). Aircraft emissions. IPCC.
Schäfer, A. W. (2018). Technological, economic and environmental prospects of all-electric
aircraft. https://www.nature.com/articles/s41560-018-0294-x. Retrieved from
https://www.nature.com/articles/s41560-018-0294-x
Supermagnete. (2019, May 6). Supermagnete. Retrieved from supermagnete.de: https://www.supermagnete.de/eng/data_table.php
Vratny, P. C., Seitz, A., & Hornung, M. (2014). Investigation of Universally Electric