THEME 7
Transport including
Aeronautics
Project DELTA
C
ONCERTED COORDINATION FOR THE PROMOTION
OF EFFICIENT MULTIMODAL INTERFACES
Coordination Action Grant Agreement No: 218486
Deliverable D4.2
Final (validated) Decision Support
Instrument
Version: Final
Date: December 2010
P
ROJECT
I
NFORMATION
Title: Concerted coordination for the promotion of efficient multimodal interfaces
Acronym: DELTA
Grant Agreement no: 218486
Programme: 7th Framework Programme
Funding Scheme: Coordination Action Start date: 1st January 2009
Duration: 24 months
Web site: www.delta-project.eu
P
ROJECT
P
ARTNERS
No Name Short name Country
1 (coordinator) Centre of Research and Technology Hellas / Hellenic Institute of Transport
CERTH/HIT Greece
2 Swedish National Road and Transport Research Institute VTI Sweden 3 Forschungsgesellschaft Mobilitat GmbH - Austrian Mobility Research FGM-AMOR Austria
4 Trivector Traffic AB Trivector Sweden
5 Budapest University of Technology
and Economics BME Hungary
6 BDO EOS Svetovanje d.o.o. BDO EOS Slovenia
7 MIZAR Automazione S.p.A. MIZAR Italy
8 Università degli Studi di Salerno Usalerno Italy
9 Anatoliki S.A. Development Company REACM Greece
10 Segura Durán Assessors S.A. SD Assessors Spain
11 EAV BUS EAV Italy
12 Municipality of Solcava Solcava Slovenia
D
OCUMENT
P
ROFILE
Document status: Final Deliverable code: D4.2
Deliverable title: Final (validated) Decision Support Instrument Work Package: 4
Preparation date: November 2010 Submission date: December 2010 Total pages: 87
Dissemination level: PU
Author: Evangelos Mitsakis, CERTH/HIT; Kerstin Robertson, VTI; Enzo Galdi and Giovanni Massa, USalerno
Contributors: Annie Korstari and Yannis Tyrinopoulos CERTH/HIT
Abstract: This deliverable contains the final version of the core product of the DELTA project, the Decision Support Instrument (DSI). After its first version, the DSI has undergone a thorough validation process in order to ensure the reliability of its results, to increase its acceptance by the target groups and to facilitate its future potential. The document includes the validation methodology applied, the validation results and a thorough description of the DSI.
E
XECUTIVE
S
UMMARY
One of the most important outcomes of the project DELTA is the Decision Support Instrument (DSI) aiming to assist local transport and other agencies of regions with seasonal varying transport demand profiles in the selection of the most appropriate, in each case, combination of mobility schemes, in the form of a roadmap, in order to manage this demand in a sustainable way. This tool was created in previous stages of the project, as a prototype, and comprised the content of the Deliverable D4.1 “Draft Decision Support Instrument”.
In order to achieve the highest possible efficiency, reliability and acceptance of the system, a wide validation procedure was followed. The goal of this report is to present the final validated version of the (DSI), the methods and results of the extensive validation process, the corrective actions implemented in terms of computational processes and finally its use followed by a discussion on the DSI as the final DELTA project product and the possibilities for its future use and further extensions.
The goal of the validation procedure was to evaluate the system in terms of ease of use, clarity of the variables, and relevance of the mobility schemes and usefulness of the roadmaps. The methodological approach of the validation included 4 subtasks; in the first one representative from 48 regions evaluated the effectiveness of the 10 proposed by the DSI mobility schemes; in the second subtask representatives from 28 regions rated the relevance and/or effect of the 46 mobility schemes; during the third subtask a sensitivity analysis was undertaken in order to identify very sensitive or not all sensitive variables, while the fourth subtask was dedicated to the analysis and consolidation of results of the previous subtasks.
The whole evaluation procedure resulted to several conclusions and recommendations for improvements regarding various aspects of the DSI. Some of these changes included the optimization of the mobility schemes database, the provision of ten proposed mobility schemes to the users instead of five that were provided by the initial version of the DSI, as well as the provision of better explanations on several variables.
Once all the validation results are explained and analyzed, a user’s manual is also provided explaining the actions that the user needs to take in order to use the system. The six steps are concretely presented along with the provided roadmap and its contents.
All the work done in the DSI development and validation process, as well as its presentation to the target groups in several occasions revealed several interesting ideas and suggestions for future improvements and expansion. Among them: transfer of the system to urban environments, interfacing with other existing systems in the target regions (e.g. planning tools), enrichment of the content of the DSI in terms of mobility schemes and variables.
The DSI is accessible to any interested region suffering from congestion problems due to seasonal variations of transport demand through the Delta Network at the link: http://www.delta-network.eu.
C
ONTENTS
1. Introduction__________________________________________________________ 9 1.1. Objectives and role of the DELTA Decision Support Instrument ______ 9 1.2. Aim of the report _________________________________________________ 9 2. DSI Concept ________________________________________________________ 11 2.1. Overview of the DSI _____________________________________________ 11 2.1.1. The overall concept _________________________________________ 11 2.1.2. Region classification_________________________________________ 11 2.1.3. Selection of mobility scheme(s) ______________________________ 12 2.1.4. Examples (best practices) of sustainable mobility______________ 12 2.1.5. Roadmaps formulation ______________________________________ 13 2.2. Implementation aspects _________________________________________ 13 2.2.1. Regions’ classes database___________________________________ 13 2.2.2. Mobility schemes database – First screening process __________ 14 2.2.3. Reference map – Second screening process__________________ 15 2.2.4. Benchmarks database ______________________________________ 16 2.3. Technical specifications, architecture and System requirements ___ 16 2.3.1. Generic requirements _______________________________________ 16 2.3.2. Functional model ___________________________________________ 17 2.3.3. System access control and user management ________________ 21 3. Validation __________________________________________________________ 22 3.1. Objectives and scope ___________________________________________ 22 3.2. Validation Methodology_________________________________________ 22
3.2.1. Validation Subtask 1: Evaluation of mobility schemes and roadmaps suggested by the DSI _____________________________________ 23 3.2.2. Validation Subtask 2: Rating of mobility schemes ______________ 25 3.2.3. Validation Subtask 3: Sensitivity analysis _______________________ 26 3.3. Validation Analysis and Results ___________________________________ 28 3.3.1. Results of Validation Subtask 1: Evaluation of mobility schemes and roadmaps suggested by the DSI _________________________________ 28 3.3.2. Results of Validation Subtask 2: Rating of mobility schemes_____ 36 3.3.3. Results of Validation Subtask 3: Sensitivity analysis _____________ 43 3.3.4. Results of Validation Subtask 4: Adjustments and improvements of the final DSI version __________________________________________________ 46
3.3.5. Comparative analysis results: first (draft) versus final DSI version_ 47 4. Use of the DSI _______________________________________________________ 62 4.1. Overview of the on line tool______________________________________ 62 4.1.1. Language choice ___________________________________________ 62 4.1.2. Welcome ___________________________________________________ 62 4.1.3. DSI Information ______________________________________________ 63 4.1.4. Use the DSI__________________________________________________ 64 4.2. The six steps of the DSI ___________________________________________ 65 4.2.1. Step 1: Region characteristics ________________________________ 65 4.2.2. Step 2: Existing transport and mobility related characteristics of the region __________________________________________________________ 68 4.2.3. Step 3: Existing transport and mobility infrastructures of the region 69
4.2.4. Step 4: Existing services in the region, including Intelligent Transportation Systems_______________________________________________ 70 4.2.5. Step 5: Existing problems and needs, where specific contributions are desired _________________________________________________________ 71 4.2.6. Step 6: Implementation aspects______________________________ 72 4.3. Outcomes of the DSI ____________________________________________ 73 5. Conclusions_________________________________________________________ 79 5.1. The DSI as the DELTA final product________________________________ 79 5.2. Future use of the DSI _____________________________________________ 79 5.2.1. Promotion and upgrading of the tool_________________________ 79 5.2.2. Functional and technical expansions _________________________ 80 ANNEX__________________________________________________________________ 82
L
IST OF
T
ABLES
Table 1: Rules for rating the mobility schemes _____________________________ 14 Table 2: Rule for the definition of ranges for variables of the reference map 15 Table 3: Data entry functions_____________________________________________ 18 Table 4: Data analysis functions __________________________________________ 19 Table 5: Mobility schemes selection functions _____________________________ 19 Table 6: Mobility schemes implementation functions_______________________ 20
Table 7: Regions included as case studies in the Validation Subtask 1 (48 regions) and 2 (28 regions)_______________________________________________ 23 Table 8: Frequencies of appearance of Subtask 1 Mobility Schemes________ 30 Table 9: List of the regions analyzed in Subtask 2___________________________ 36 Table 10: Overall effect and position attributed to the Mobility schemes ____ 37 Table 11: Summary of the comparison between position of the MS and effect attributed to it __________________________________________________________ 40 Table 12: Implemented corrective actions and suggestion for DSI improvement ___________________________________________________________ 46 Table 13: Comparison of overall effect and position attributed to the Mobility schemes between the draft and the final DSI version. _____________________ 55
L
IST OF
F
IGURES
Figure 1: The DELTA DSI concept _________________________________________ 11 Figure 2: Functional diagram of the DELTA DSI_____________________________ 21 Figure 3: Effect attributed to the proposed Mobility Schemes ______________ 32 Figure 4: Overall evaluation of the relevance of the roadmaps_____________ 32 Figure 5: Frequencies of MSs vs. Positive and Highly positive evaluations ____ 33 Figure 6: Frequencies of MSs vs. Relevant and Highly relevant roadmaps ___ 34 Figure 7: Effect of the proposed Ms divided per region type _______________ 35 Figure 8: Average sensitivity related to input variables _____________________ 44 Figure 9: Minimum sensitivity values related to input variables ______________ 45 Figure 10: Comparison of mobility schemes’ frequencies between the draft and the final DSI version _________________________________________________ 49 Figure 11: Comparison of public transport related mobility schemes frequencies between the draft and the final DSI version ___________________ 50 Figure 12: Comparison of bicycling related mobility schemes frequencies between the draft and the final DSI version _______________________________ 51 Figure 13: Comparison of walking related mobility schemes frequencies between the draft and the final DSI version _______________________________ 52 Figure 14: Comparison of information related mobility schemes frequencies between the draft and the final DSI version _______________________________ 53 Figure 15: Comparison of car related mobility schemes frequencies between the draft and the final DSI version ________________________________________ 54 Figure 16: Comparison of overall frequency and effect of the mobility schemes between the draft and the final DSI version ______________________ 57
Figure 17: Frequencies of MS in relation to the expert ratings of subtask 2 with the final DSI version ______________________________________________________ 60 Figure 18: Frequencies of MS in relation to the expert ratings of subtask 2 with the final DSI version ______________________________________________________ 61 Figure 19: The 8 languages of the DSI _____________________________________ 62 Figure 20: The DSI welcome page ________________________________________ 63 Figure 21: The DSI info page______________________________________________ 64 Figure 22: Instructions for the use of the DSI________________________________ 65 Figure 23: Step 1 of the DSI _______________________________________________ 66 Figure 24: Selection of ranges ____________________________________________ 67 Figure 25: Provision of additional information through tooltips ______________ 68 Figure 26: Step 2 of the DSI _______________________________________________ 69 Figure 27: Step 3a of the DSI______________________________________________ 70 Figure 28: Step 3b of the DSI______________________________________________ 70 Figure 29: Step 4 of the DSI _______________________________________________ 71 Figure 30: Step 5 of the DSI _______________________________________________ 72 Figure 31: Step 6 of the DSI _______________________________________________ 73 Figure 32: Provision of results______________________________________________ 74 Figure 33: Roadmap for each mobility scheme____________________________ 75 Figure 34: Provision of detailed information through the roadmap __________ 76 Figure 35: Provision of the user selected data and information at each step 77 Figure 36: PDF report of the DSI results_____________________________________ 78
A
NNEX
1. I
NTRODUCTION
1.1. Objectives and role of the DELTA Decision Support
Instrument
The goal of the DELTA Decision Support Instrument (DSI) is to assist local transport and other agencies of regions with seasonal varying transport demand profiles in the selection of the most appropriate, in each case, combination of mobility schemes, in the form of a roadmap, in order to manage this demand in a sustainable way. The instrument does not terminate its use at the point of the selection of the mobility scheme, but it also provides implementation guidelines, best practices and examples that will facilitate its future adoption.
In the case of a region facing problems of seasonal transport demand management, the DSI is called to answer to three key questions:
o In which class of regions with common characteristics (e.g. type, population, etc.) does the region under consideration belong to?
o Which one of the mobility schemes implemented in regions of this or similar class is the most appropriate in this particular case?
o What are the necessary actions and measures that should be taken in order to implement the selected mobility scheme?
The DELTA DSI answers to the above questions based on the data provided by the target area.
The DSI is an Internet-based application, implemented over an SQL database, where various datasets, such as classes of regions characteristics, mobility schemes and benchmarks, are stored and processed. The results of the DSI and the computational processes have been validated, through related validation activities carried out in fifty regions across Europe, with the cooperation of expert judgments and a series of statistical analyses.
The DSI is accessible to any interested region suffering from congestion problems due to seasonal variations of transport demand through the Delta Network at the link: http://www.delta-network.eu.
1.2. Aim of the report
The aim of this report is to present the final validated version of the DELTA Decision Support Instrument (DSI), the methods and results of the extensive validation process, the corrective actions implemented in terms of computational processes and finally its use followed by a discussion on the DSI as the final DELTA project product and the possibilities for its future use and further extensions.
The main aspects covered within the report and its primary focus lies on the presentation of the validation issues, which aim to present the methodology used for the validation process, the results of the validation, the necessary computational (and other) adjustments that have resulted through the validation activities and the comparative analyses of the improved results of the final (validated) version of the DELTA DSI against the results of the draft DSI version.
2. DSI
C
ONCEPT
2.1. Overview of the DSI
2.1.1. The overall concept
The logic and process of the DSI is composed of four sequential phases, which are presented in Figure 1 below. The figure is divided in three areas: The middle and core one reflects the DSI, as it describes the procedure towards the decision making. The right hand side addresses the input required by the region that is being examined and the output it receives at the end of the process. Finally, the left hand side contains the origin of the information that is used in the process of the selection and implementation of the appropriate mobility scheme for that region.
Selection of mobility scheme(s) Region characteristics Best practices of sustainable mobility Roadmaps formulation Classes of regions Benchmarks Socio‐economic, demographic, tourism and traffic congestion data Handbook for sustainable mobility Transportation infrastructure, mobility services, ITS, seasonal demand/supply data
DSI process
User (Region)
Databases
Reference map Mobility schemesFigure 1: The DELTA DSI concept
In line with Figure 1 above, the four phases in the use of the DELTA DSI are briefly described below.
2.1.2. Region classification
The regions facing problems due to seasonal transport demand do not have the same characteristics in terms of population, density, transport loads,
infrastructure, etc. Therefore, the first step in the use of the DSI is to categorize the region under study in a particular class, to which all regions with similar characteristics belong. The user is asked to provide socio-economic, demographic and traffic related data about the region, which form the criteria that are used in order to classify the region to the class it belongs to.
2.1.3. Selection of mobility scheme(s)
Once the region has been classified, several mobility schemes could be proposed based on the framework of mobility schemes created in DELTA. However, it is easy to understand that, even though two regions may belong to the same class, it is possible that not all of the mobility schemes that could be implemented in the one would be feasible in the other as well. So, the challenge faced in this part of the DSI is the selection of the most appropriate solution. Several issues are taken under consideration in the process of making this decision, some of which are the following:
• Which are the existing transportation infrastructure and mobility elements that should be taken into account?
• What are the local barriers and needs that the proposed solution should address?
• Which ones of the solutions could be more easily implemented in terms of local priorities?
At this point the user is asked to provide more information in terms of available transport infrastructure, as well as information related more to mobility, such as existing transport modes, mobility schemes, ITS services and intermodal elements already existing in the region. On the other hand, the framework of mobility schemes provides information on all possible mobility solutions. These two sets of information result to the actual criteria that serve the selection of the appropriate mobility scheme (or combination of schemes) for the particular region.
2.1.4. Examples (best practices) of sustainable mobility
The operation of the DSI doesn’t stop after the selection of the best solution, but continues with the provision of a series of best practices similar to the proposed mobility schemes that have been implemented elsewhere (including urban cases) and their expected positive effects. The benchmarks (best practices) include a series of factors for sustainable mobility, such as rates of congestion, accident rates, rates of pollutant emissions, etc.
The aim of this action is to give to the target region a feeling of the benefits that can be expected after the implementation of the proposed mobility solution based on the experience of other regions.
2.1.5. Roadmaps formulation
At the final stage, the DSI provides the user with guidelines for the actual implementation of the selected mobility scheme. Some of the issues addressed by these guidelines are the following:
• Detailed description of the proposed mobility scheme.
• The actions and measures that should be taken at various levels (infrastructure, legislative, policy, etc.) before its implementation.
• Supporting horizontal policies that facilitate the implementation of the scheme.
• Examples (best practices) of similar solutions implemented elsewhere. • An indicative time plan that should be followed in order to ensure the
shortest possible implementation duration of the solution.
2.2. Implementation aspects
The DELTA DSI is comprised by several databases and logical statements and constraints, which result to the identification and suggestion of the most appropriate mobility schemes according to the users’ inputs.
2.2.1. Regions’ classes database
DELTA has identified the need to categorize the target regions according to their common characteristics related to seasonal traffic peaks that would facilitate the further definition and suggestion of mobility solutions to regions with common needs, problems, socio-economic characteristics and transportation environments. In order to define these classes of regions, the project has adopted a transport mode driven classification scheme. In particular, the classification of regions has been based on the market and implementation potential of a variety of transport modes to the target areas. This transport mode driven classification served the understanding of the mobility choices in the target areas related to the modes of transport. The transport modes used in this process are: bicycling, walking, local and regional bus, metro, tram/light rail, railway, car, taxi, motorcycling and ferry. Based on the above, a database containing information and datasets for the regions’ characteristics and the implementation potential of transport modes has been created. The database includes implementation potential ratings for twenty-seven variables, which describe various characteristics of the regions. The categories covered by these variables include regions’ general characteristics, transport infrastructure, transport and mobility systems and tourism and visitors’ characteristics. For each variable, ranges of values have been defined and for each range of each variable the implementation potential of the transport modes has been assigned with a rating, which can have the value of high, medium or low. In the present form of the DELTA DSI,
the variables actually used for the computational efforts of the system are the following: - population - size of region - type of region - type of climate
- number of businesses related to tourism activities - traffic congestion duration.
According to the values that the user chooses, as those that best describe the region under study, the system assigns the region to one unique class with respective implementation potential ratings for each transport mode.
2.2.2. Mobility schemes database – First screening process
The mobility schemes database includes detailed data of the mobility schemes and information related to the involvement of the transport modes in each mobility scheme that the database contains. There are currently forty-six mobility schemes and twenty-three supporting (policy) actions stored in this database. For each mobility scheme and supporting action, the database includes ratings of the involvement of the transport modes in each mobility scheme. The method used for the definition of the relationship between the mobility schemes and the transport modes is as follows:
- value 1, if the mobility scheme is related to the transport mode and positively affects it;
- value 0, if the mobility scheme is not related to the transport mode; and - value -1, if the mobility scheme is related to the transport mode and
negatively affects it.
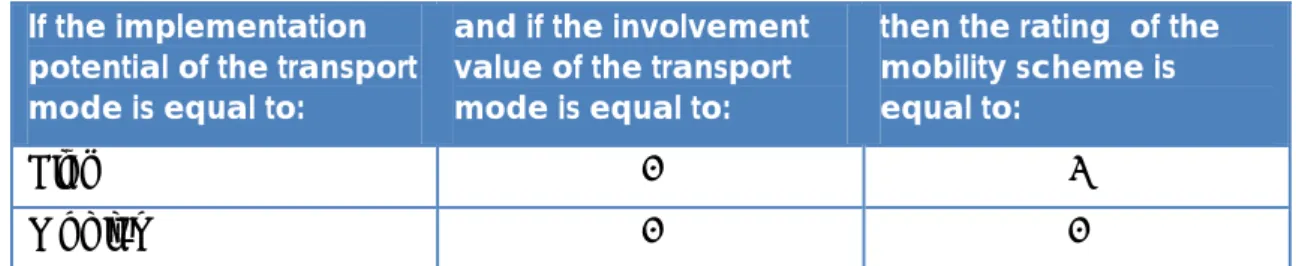
According to the class that the DSI has assigned the region in the previous step and according to the above relationships, the system rates the mobility schemes according to the rules presented in Table 1.
Table 1: Rules for rating the mobility schemes
If the implementation potential of the transport mode is equal to:
and if the involvement value of the transport mode is equal to:
then the rating of the mobility scheme is equal to:
High 1 2
Medium 1 1
All other combinations of implementation potentials of transport modes and values of involvement receive a rating of 0.
All the mobility schemes are rated as the sum of the individual transport modes’ ratings and a temporary database is created, which contains the rated mobility schemes in descending order of the total rating received.
2.2.3. Reference map – Second screening process
The reference map is the third and most significant module‐database of the DELTA DSI, in terms of its role on the selection of the most appropriate mobility schemes. The reference map database contains stored values for the implementation potential of all the mobility schemes, as these have been defined for forty-eight variables by experts and cover the following broad categories:
- mobility characteristics
- seasonal variation characteristics
- existing transport infrastructures in the region
- existing transport infrastructures to and from the region - existing transport services, including ITS
- contribution to existing problems and needs - implementation provisions
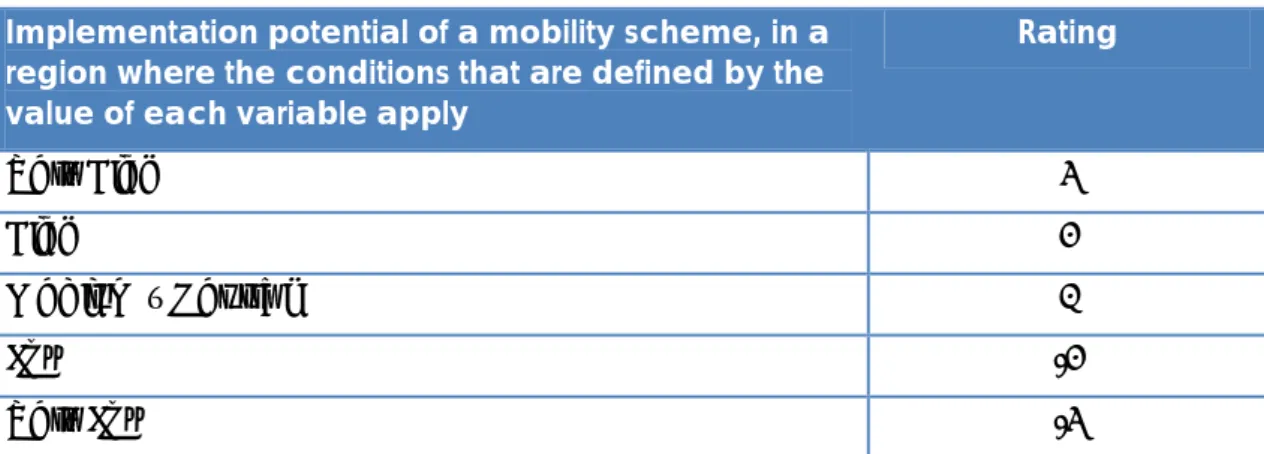
For each variable, ranges have been defined, which are used for the rating of all mobility schemes stored in the respective database. The rating rule is presented in Table 2.
Table 2: Rule for the definition of ranges for variables of the reference map
Implementation potential of a mobility scheme, in a region where the conditions that are defined by the value of each variable apply
Rating Very High 2 High 1 Medium – Neutral 0 Low -1 Very Low -2
All the mobility schemes are rated according to this procedural rule and a second temporary database is created, which contains the mobility schemes in descending order according to their total rating.
The results of this second temporary database are combined with those of the initial temporary database and provide the finally selected and proposed mobility schemes, which are the most appropriate for the region in question, as those that have received the highest total ratings in each process. The
system proposes a maximum of three mobility schemes at each case, which are those that received the highest ratings in the above mentioned procedures. Supporting policy measures associated with the proposed mobility schemes are also presented and proposed for each mobility scheme to the user (region).
2.2.4. Benchmarks database
The last database of the DELTA DSI contains information related to benchmarks for each mobility scheme stored in the mobility schemes database. The values of the benchmarks have been selected after a detailed study of previous research projects’ results and cover the following thematic areas:
- Decrease in car use
- Increase in public transport use - Increase in bicycle use
- Increase in railway use - Increase in vehicle speed - Shift to off-peak hours - Decrease in CO2 emissions - Decrease in accidents
For the finally selected mobility schemes by the DELTA DSI, information related to the benchmarks (relevant best practices) is retrieved from this database and is provided along with other mobility scheme related information to the user.
2.3. Technical specifications, architecture and System
requirements
2.3.1.
Generic requirements
The characteristics of the DSI aim to fulfil the following generic requirements of such a system:
User friendly:
The DSI must be built upon principles of user-friendliness. This will ensure the convenient and unproblematic use of the system by inexperienced users, or users with fewer computer skills. The system will also be built upon principles of W3C regarding accessibility issues of the DSI functions. A user guide will be provided in electronic form to the users together with supportive help functions that will be included in all the steps where interaction with the user is
required. Special attention will be paid on the user-friendliness of the data input forms, in order to assist inexperienced users of the DSI.
Efficient:
The DSI must operate seamlessly online and in real-time, while all internal functions related to the logical computations that the DSI will perform must be executed within maximum a 1-second time step following the users input. This will also ensure that the DSI will operate efficiently over the web, where other sources of delay may occur. The DSI will for that reason be hosted on a dedicated server of CERTH/HIT, ensuring seamless operation and a fast connection line to the web.
Secure:
The DSI must operate in a safe and secure web environment. Although no data related to personal or sensitive information is required, the operation of the system, the input data provided by the end users and the output data returned to them must be all exchanged in a safe and secure environment. Trustworthy safety and security features will be analyzed and appropriate ones will be used by the DSI.
The user access is controlled through a user-specific username and password to hinder unauthorized use and data manipulation.
Expandable & upgradable:
The DSI must also be built upon principles of expandability and upgradeability. These will ensure that the DSI will not be a one-time product with limited application time frame, but will constantly be able to be upgraded, expanded and fine tuned according to the feedback that will be received by the end users and by new ideas of the DELTA consortium members as well. The last section of this deliverable contains recommendations and suggestions for the expansion of the DSI.
2.3.2. Functional model
A specific functions model has been defined containing all the functions that the DSI will perform in order to serve its role. The model is described below. F1: Data entry about the existing situation
Before defining any mobility scheme to effectively handle the seasonal traffic peaks in a particular region, information is required about the local conditions and situation. This information should contain socio-economic, transport, mobility, seasonal and other characteristics. The function is divided into sub-functions according to the required data sets, as described below:
Table 3: Data entry functions
F1.1: Socio-economic data Sub-function related to the entry of socio-economic characteristics, such as population, type and number of businesses acting in the region related to tourism activities.
F1.2: Transport demand and seasonal characteristics
Sub-function related to the entry of transport
demand and seasonal variation characteristics, such as the profile and the duration of the seasonal demand variation.
F1.3: Transport infrastructure Sub-function related to the entry of transport infrastructure related characteristics, such as road, rail, waterway and air transport networks. Specific information to be collected per mode include length of the networks, conditions, etc.
F1.4: Mobility infrastructure Sub-function related to the entry of mobility infrastructures characteristics, such as means of public transport (bus, metro, tram), car, regional or shuttle bus systems, taxis and infrastructures for motorcycles/mopeds.
F1.5: Mobility management
measures Sub-function related to the entry of existing mobility management measures/schemes, such as Park&Ride, Bike&Ride, Intermodal public transport tickets, Public transport express lines, Bicycle rental systems, Traffic restrictions, Parking restrictions and others.
F1.6: Problems, needs and
requirements Sub-function related to the entry of existing problems, needs or requirements of the region, such as Congestion in the main road networks, Low quality of the road network, Low quality of public transport, Crowed public transport, Minor coverage of the region by public transport, Accidents in the main road networks, Environmental pollution, Lack of parking areas, and others.
F1.7: ITS data Sub-function related to the entry of existing ITS solutions and systems already implemented in the region, such as electronic passenger information systems at public transport stops, mobility centres with e-services, online booking systems for tickets, tourist information kiosks and others.
F2: Analysis of the existing situation
This function is related to the analysis of the existing situation of the region in question. The analysis is comprised by an initial classification of the concerned region based on several parameters and by the identification of the main causes and effects of traffic peaks in the region. The analysis is performed in three sub-functions as described below:
Table 4: Data analysis functions
F2.1: Region classification Sub-function related to the classification of the concerned region based on several parameters, which results on the categorization of the target region into a unique class with unique parameters and characteristics. These parameters include socio-economic characteristics, such as region population and number of businesses related to tourism
activities, the type of the concerned region and the characteristics of traffic peaks and traffic
congestion. F2.2: Identification of the main
causes of traffic peaks Sub-function related to the identification of the main causes and reasons for traffic peaks in the region. The analysis of the existing information will give useful information about the key parameters that
contribute to the seasonal traffic peaks. Indicative causes may be the bad condition of the road network, the lack of coordination between the existing modes of transport, and others.
F2.3: Identification of the main effects of traffic peaks
Sub-function related to the identification of the main effects of traffic peaks in the region. The analysis of the existing information will also provide useful input about the effects and impacts of tragic peaks, which may be accidents, severe congestion in the road networks, increased travel times, etc.
F3: Selection of the suitable mobility scheme(s)
The third function is concerned with the selection of one or more most suitable mobility schemes for the concerned region. The selection is executed based on the review of all available mobility schemes and on procedures related to the identification and selection of the most appropriate ones among all the available. The selection of the suitable mobility scheme(s) is performed in four sub-functions as described below:
Table 5: Mobility schemes selection functions
F3.1: Review of the mobilityschemes
Sub-function related to the review of all available mobility schemes. The specific characteristics of all mobility schemes will be examined and the ones responding to the needs and conditions of the target regions will be screened.
F3.2: Selection of the appropriate mobility scheme(s)
Sub-function related to the selection of the appropriate mobility scheme or schemes for the concerned region. From all mobility schemes
screened in the previous sub-function, the system will define and propose the one(s) appropriate for the handling of seasonal traffic peaks in the target region.
F3.3: Presentation of the
mobility solution Sub-function related to the presentation of the selected mobility scheme(s). All important characteristics of the mobility scheme(s) will be presented.
F4: Guidelines for mobility solution implementation
This function refers to the implementation of the selected mobility scheme(s) by the region in question in the future. First, best practices (benchmarks) of similar mobility solutions implemented elsewhere will be presented. Then, guidelines and recommendations for the implementation of the solution will be proposed.
Table 6: Mobility schemes implementation functions
F4.1: Set of targets forsustainable mobility Sub-function related to the provision of a series of targets for sustainable mobility for the particular solution. The system will provide benchmarks, such as rates of congestion, load rates, rates of pollutant emissions that could be achieved after the implementation of the mobility solution. F4.2: Creation of roadmap for
the solution implementation
Sub-function related to the generation of roadmap including guidelines for the actual implementation of the selected mobility scheme(s). The roadmap will contain a description of the proposed mobility scheme, actions and measures that should be taken at various levels (infrastructure, legislative, policy, etc.) before its implementation, mechanism for the monitoring of the sustainability factors, and others. F4.3: Roadmap
communication Sub-function related to the communication of the roadmap created in the previous sub-function to the target regions in different formats, such as pdf, printable version, etc.
The functional diagram of the DELTA DSI, which includes all the functions described above, is presented next:
Figure 2: Functional diagram of the DELTA DSI
2.3.3. System access control and user management
The control of the access to the system is twofold:
1. Access is granted through correct username and password input by the user in the welcome screen of the DELTA DSI.
2. Access is granted automatically in case that the user is already member of the DELTA network, has gained access to the DELTA network members section and then points to the use of the DSI as a registered member of the network. In that case, the user is not asked to provide login information again for the use of the DSI.
The user management mechanism of the system ensures that all information provided by the user as input and by the system as output is stored and that the user can view the data provided by him/her as well as the results provided by the DSI each time he/she accesses the DSI.
3. V
ALIDATION
3.1. Objectives and scope
The main objective of the validation is to evaluate the performance and to suggest improvements of the prototype version DSI. The following aspects of the DSI have been included in the validation:
• Ease of use
• Clarity/understanding and proper interpretation of input variables • Relevance of mobility schemes proposed
• Usefulness of roadmap output information
The validation methodology of the DSI has been designed with the aim to improve the consistency of the mobility schemes and roadmaps suggested by the DSI. This activity has been carried out by investigating the relevance and implementation feasibility of the suggested mobility schemes and roadmaps as well as the relevance and feasibility of the input variables.
The validation has been performed through case studies and has been applied to some of the regions that participated in the project, but mostly to additional touristic regions. These regions represent different profiles with respect to tourism and different transport demand characteristics. The results of the validation have been used for further adjustment and refinement of the DSI and the roadmaps.
3.2. Validation Methodology
Based on the above objective and scope, the validation methodology has been designed so as to evaluate a number of aspects of the DSI, such as: • uncertainties regarding data and information to insert into the DSI, • evaluated effectiveness of the first 10 (out of the total 46) suggested
mobility schemes and the relevance of the roadmaps provided,
• independent rating of the relevance/effect of all 46 mobility schemes, and
• sensitivity (or insensitivity) analysis of the DSI regarding different input variables.
These aspects are broken down in three different subtasks that are further described below. A fourth subtask has been designed, in order to analyse and consolidate the results from the three previous subtasks and to suggest adjustments and improvements of the DSI. This is further described in Section 3.3.
3.2.1. Validation Subtask 1: Evaluation of mobility schemes and
roadmaps suggested by the DSI
The aim of Subtask 1 has been to validate the DSI by evaluating the effectiveness of the 10 suggested mobility schemes and the relevance of the roadmaps provided. Subtask 1 has been carried out in 48 Regions (Table 1), by one or two representatives (from different organisations involved in the transport planning activities), in each region.
Table 7: Regions included as case studies in the Validation Subtask 1 (48
regions) and 2 (28 regions)
Country Regions Subtask 1 Subtask 2
Sweden Lysekil Sälen x x Italy Bologna ReggioEmilia Torino Ischia Island Sorrento Flegrean Area Cilento Coast Amalfi Coast x x x x x x x x x x x x x France Bayonne Cauterets Coban Iledere LaGrandeMotte LaRochelle Lourdes Oleron x x x x x x x x
Spain Balearic Islands x x
Greece East Olympus
Kassandra Moudania Naoussa Thassos Thermaikos Vyssa x x x x x x x x x x x x x x Slovenia Bled Bohinj Bovec Brezice Cerklje Izola x x x x x x x x x x x x
Kamnik Koper Kranjska Gora Maribor Piran Postojna RogaskaSlatina Zrece x x x x x x x x x x x x x x x x Hungary Danube-bend Eger Gyula Kapolcs LakeBalaton LakeTisza LakeVelence Sopron x x x x x x x x x x x x x x x x
Subtask 1 included the following steps in each region: • Data collection and running of the DSI.
• Evaluation of mobility schemes (10) and roadmaps delivered by the DSI from representatives of different organisations in the regions. The evaluation has been performed either at a meeting, for example in the region, or by telephone.
• Reporting of Roadmaps (results of DSI runs) and filled-in validation forms. The evaluation of the mobility schemes has been executed according to the following scale:
Negative
effect No effect positive effect Somewhat Positive effect Highly positive effect
- 0 + ++ +++
“Effect” refers to the impact of the proposed mobility scheme (measure) on the tourist-related transport problems associated with seasonal peak traffic, as evaluated by the regions representatives. A negative effect means that the mobility scheme may worsen the problem, zero means that the mobility scheme has no impact on the tourist traffic peaks and a positive effect means that the mobility scheme will positively contribute to reducing the problems caused by seasonal traffic peaks.
The relevance of the roadmaps (information) provided by the DSI have been evaluated using a four-graded scale:
Not relevant Some relevance Relevant Highly relevant Only one grade has been assigned to the roadmap. Additionally, more detailed, information could be added as a comment if necessary.
The results of the validation have been reported in forms (See Annex). Besides the evaluation of the mobility schemes and the roadmaps, uncertainties regarding the data/information input to the DSI could also be specified in the form, for example difficulties to understand or interpret the alternatives for variables or difficulties to find the right alternative for a specific region. Also difficulties to collect accurate data and the use of estimations could be stated here.
The roadmaps (the result of the DSI-runs as a pdf-file), including the mobility schemes suggested by the DSI, and the data input have also been included in the reporting of results.
3.2.2. Validation Subtask 2: Rating of mobility schemes
The aim of Subtask 2 has been to perform an independent rating of the relevance and/or effect of all 46 mobility schemes that are included in the DSI. Subtask 2 has been carried out in 28 Regions (Table 1), by one or two representatives from different organisations involved in transport planning in each region. Subtask 2 has been carried out in coordination with Subtask 1. Subtask 2 included the following steps in each region:
• Data collection and running of the DSI (if not already done in Subtask 1). • Evaluation of potential relevance and effect of all 46 possible mobility
schemes by a rating procedure carried out by representatives from different organisations in the regions. The evaluation has been executed either at a meeting, for example in the region, or by telephone.
• Reporting of Roadmaps (results of DSI runs) and filled-in validation forms. The result from the DSI has only been used as a reference and comparison to the ratings suggested by the regions representatives. It was not discussed or presented to the region representatives.
In a first step, the rating of the mobility schemes has been done according to the following scale:
Negative
effect No effect positive effect Somewhat Positive effect Highly positive effect
- 0 + ++ +++
“Effect” refers to the impact of the mobility scheme (measure) on the tourist-related transport problems associated with seasonal peak traffics as evaluated by the regions representatives. A negative effect means that the mobility scheme may worsen the problem, zero means that the mobility scheme has no impact on the tourist traffic peaks and a positive effect means that the mobility scheme will positively contribute to reducing the problems with seasonal traffic peaks.
In a second step, all mobility schemes rated “+++” have been sorted into an order of descending relevance/effect, followed by the “++” and the “+”
mobility schemes sorted in the same order. The “0” and “–” mobility schemes have not been sorted.
The results of the validation have been reported in forms (See Annex) that included the evaluation of the potential relevance or effect of the mobility schemes included in the DSI.
The roadmaps (the result of the CSI-runs as a pdf-file) including the rating of all 46 mobility schemes suggested by the DSI, and the data input has also been included in the reporting.
3.2.3. Validation Subtask 3: Sensitivity analysis
The aim of Subtask 3 has been to perform a sensitivity analysis of the input variables in the DSI. It is desirable to have an appropriate degree of sensitivity (or stability) of the DSI. A low sensitivity, with respect to the chosen value of a specific input variable, means that the variable does not influence much the output (mobility schemes). This is however not a serious defect or problem. A high sensitivity to the value of a certain input variable may be more considered more serious, in that it results to major differences at the output of the DSI. The appropriate level of sensitivity is difficult to define a priori. However, it is desirable that the input variables affect the output to an equal, or at least to a similar degree.
For the sensitivity analyses, a specially prepared version of the DSI providing more detailed output data has been used. When computing the results a new page is shown displaying all relevant output data. It contains three lists of mobility schemes and their ratings:
• The final list of mobility schemes.
• The list of mobility schemes produced by Step 1 (first screening process, section 2.2.2) in the DSI algorithm.
• The list of mobility schemes produced by Steps 2-6 (second screening process, section 2.2.3 - Reference map) in the DSI algorithm.
All three lists of mobility schemes and their ratings have been stored in a database for each run. Also the input data for each run has been stored in the database.
Base case (BC)
In total, 7 regions of different character, included in Subtask 2, have been used for the sensitivity analysis (Table 7). The given input data for the region constituted the “base case”. This was found in the results delivered form Subtask 1. The base case for each region has been run in the modified DSI and saved in the database. The output included the three output lists of mobility schemes (see above) as well as the rank (the position in the lists) and ratings of the 46 mobility schemes.
Perturbed cases
Starting with the base case, for one input variable at a time, the value was run through all possible alternatives and for each such run the output lists have been stored in the database (in the same way as for the base case). Once the output from the DSI has been collected in the database, a comparison of the results from the base case and each individual perturbed case has been done. The result from each case consists of three lists of mobility schemes and the perturbed input value. In order to enable the evaluation of the difference between one list of mobility schemes against another, metrics have bee defined and applied.
Metrics
In order to compare the results of the different runs of the DSI, a number of metrics have been defined.
Metric 1
M(list1, list2) = 10 – (number of mobility schemes being among the top 10 in both list1 and list2).
The metric M1 reflects very well the output from the DSI. It does not take into account the order in which the mobility schemes are presented, which is of minor importance. The metric M1 ignores the contents of the list after the 10th
mobility scheme. Metric 2
M2(list1,list2) =
where:
the rank (or position) of mobility scheme m within list1. a fixed coefficient (usually=1)
cm suitable weight coefficients
The metric M2 is a measure of the deviation in the positions of the mobility schemes between the two lists. By increasing the coefficient α, a larger penalty is imposed on larger deviations. The weight coefficients, cm, can be
used to put a larger weight on the mobility schemes in the beginning of the list, i.e. those having a better chance to be proposed by the DSI.
Metric 3
M3(list1,list2) =
the score for mobility scheme m within list1.
A disadvantage using the position or rank of the metric M2 is that in many cases different mobility schemes may have equal scores and that their rank for these mobility schemes is somewhat random or unstable. A small change in the score may lead to a dramatic change in rank and the consequences of the little change in score are dramatically overestimated by M2. Therefore, metric 3 is proposed.
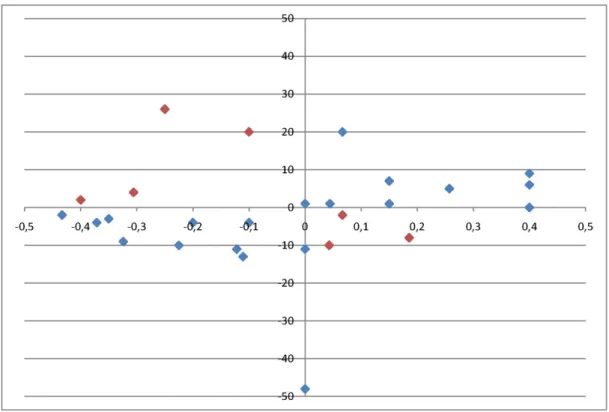
Metric 4
The Spearman's rank correlation coefficient shows the correlation between all the mobility schemes’ rank order numbers in the base case and in each case of perturbed values changing.
Spearman's rank correlation coefficient or Spearman's rho is a non-parametric measure of statistical dependence between two variables. It assesses how well the relationship between two variables can be described using a monotonic function. If there are no repeated data values, a perfect Spearman correlation of +1 (or −1) occurs when each of the variables is a perfect monotone function of the other. The metric takes values between 0 and 1. These extreme values mean:
1: the respective variable has no influence at all to the results of the system or that the results of the system are not affected at all by changes in this variable.
0: the respective variable has major influence to the results of the system or that the results of the system are greatly affected by changes in this variable.
3.3. Validation Analysis and Results
According to the methodological approach presented in the previous section, the validation procedure has been performed in three steps. The data has been stored into a single database, in a useful manner for the analysis objectives. The results collected from the validation procedure have been utilized in order to improve the performances of the DSI and to estimate the global evaluation about the usefulness of the tool furnished by the experts. These results are summarized into the next paragraphs.
3.3.1. Results of Validation Subtask 1: Evaluation of mobility
schemes and roadmaps suggested by the DSI
Analysing the results obtained from the 50 runs of the DSI (composed by two different runs for each one of the Sweden regions and one single running for the remaining 46 regions) it has been showed that 16 mobility schemes had never been proposed by the DSI throughout the 50 cases. The frequencies of
appearance of each mobility scheme in the list proposed by the DSI in this subtask are presented in Table 8.
Table 8: Frequencies of appearance of Subtask 1 Mobility Schemes
MS Description Frequency Category
1 Grant discounts on entrance fees for public transport users 3
2 Create package offers 0
3 Intermodal public transport tickets for one or several days 7 4 Introduction of public transport express lines to major tourist areas 0 5 Modernization and attractiveness of public transport vehicles 0 6 Flexible timetables for different seasons, increase of frequency during peak season 7 7 Introduction of dedicated lanes for public transport to major tourist areas 0
8 Offer special tourist shuttle services 5
9 Luggage door-to-door service 1
10 Alternatively propelled vehicles for public transport 1
11 Call a Bus 0
12 Provide left-luggage offices 5
13 Increase the attractivenes of package offers 2
14 Offer historical or local traditional/typical transport means for short trips in region 0
15 Offer tours by public transport in the region 0
PUB
LIC TRAN
SP
ORT
16 Offer bike transportation facilities in public transport 20
17 Free bicycle rental for hotel guests and tourists 0
18 Create bicycle parking / locking possibilities 3
19 Provide information about existing cycling network 0
20 Create a regional bicycle rental system 0
21 Electro Bike rental 0
22 Offer cycling tours 0
BICYC
LI
N
G
23 Pedestrian signposting 12
24 Create a walking map / paths for the region 6
25 Offer walking tours in the region 0 WA
LK
IN
G
26 Creation of annual traffic forecasts to influence travel dates of tourists 29 27 Information about alternative routes off the main / common travel routes 5 28 Online, mobile and on-street real time information about traffic conditions 4
29 Online multimodal journey planner 49
30 Mobility centres and info points for sustainable mobility 47
31 Mobile Tourist Information (with bike repair facilities) 0
INFORMATIO
32 Include sustainable arrival information 50
33 Provide GPS guidance for tourists 15
34 Provide information on sustainable transport modes directly in hotels 47 35 Display / announcement of travel times (compared to public transport) 13 36 Parking restrictions for individual motorized transport means 9
37 Create zones to which only permitted vehicles are allowed 45
38 Create zones to which motorized traffic is generally banned 1 39 Create zones to which motorized traffic allowed but requested to pay when entering 40
40 Increase fees for motorized vehicles 35
41 Use, rent and promote non-polluting vehicles in sensitive areas (e.g. nature parks, historic city centres…) 4
42 Provide car-sharing to enable mobility within the region 0
43 Parking management system 4
44 Speed limits zones 17
45 Park and Ride 14
46 Car Pooling 0
CAR
Reviewing the above table, it can be extracted that the mobility schemes appeared more frequently by the DSI runs are related to information and car categories. Moreover, very few bicycling related mobility schemes have been proposed.
The proposed by the DSI mobility schemes have also been evaluated as to their effect. The schemes received ‘Some positive effect’, ‘Positive effect’ or ‘High positive effect’ ratings for the mobility problems of the touristic regions account for 76% of the cases, as shown below.
3% 21% 27% 32% 17% Negative No effect
Some positive effect Positive effect Highly positive effect
Figure 3: Effect attributed to the proposed Mobility Schemes
The roadmaps have been evaluated quite positively, also, as depicted below.
9%
28%
63%
Not Relevant Some Relevance Relevant or Highly relevant
Figure 4: Overall evaluation of the relevance of the roadmaps
The detailed analysis of the effect and the relevance of the roadmaps attributed to each mobility scheme revealed that the experts’ evaluations have been in agreement with the frequencies of appearance of the mobility schemes from the DSI runs, as depicted in the following two figures.
Figure 6: Frequencies of MSs vs. Relevant and Highly relevant roadmaps
Island small Island large Coastal area Country side Lake side Mountain 0 2 4 6 8 10 12 Negativ e effect No effect Some positi… Positiv e effect Very positi… Region type Regi ons per cen ta g e s [ % ] Effect Overall effect per region type
Figure 7: Effect of the proposed Ms divided per region type
From the previous evaluations, it is has been concluded that the mobility schemes and the roadmaps proposed by the DSI have been generally evaluated positively.
Some interesting results have been derived from the analysis of the uncertainties underlined by the users during subtask 1 DSI runs and related to problems and needs of improvement of the tool:
1. Improve the explanation for the ‘region’ extend, before the user actually starts to use the DSI;
2. Provide a better description of necessary data in order to use the DSI, preferably at the ‘DSI info’ section;
3. Improve the descriptions of the ‘Climate conditions’ variable at Step 1; 4. Improve the ‘region extend’ description at Step 3;
5. Improve the descriptions and provide more user friendly explanations of the systems mentioned at Step 4;
6. Enable the possibility of allowing the user to select both options at the environmental impacts variable of Step 5;
7. The user selections for the variable ‘Envisioned areas of improvement’ at Step 6 will exclude all not relevant solutions from the list of the finally proposed mobility schemes;
8. The user selections for the variable ‘Investments’ at Step 6 will exclude all not relevant solutions from the list of the finally proposed mobility schemes, as the choice of the user is indicating the total available budget;
9. The user selections for the variable ‘Implementation period’ at Step 6 will exclude all not relevant solutions from the list of the finally proposed mobility schemes, as the choice of the user is indicating the desired time frame for implementing the mobility scheme;
10. The importance of the user selections at step 6 mentioned above will be added at the DSI info section.
3.3.2. Results of Validation Subtask 2: Rating of mobility schemes
In order to perform the rating of mobility schemes, the experts of 35 regions have been interviewed and the furnished data collected.
The data of the 28 regions, listed in Table 8Table 9, have been accepted as correct and have been analysed in order to compare the relevance attributed by the DSI to each mobility scheme and the effect attributed to it by the experts of the regions. This analysis was necessary to compare the effect attributed to each mobility scheme with the position attributed to it by the DSI throughout the 28 cases.
Table 9: List of the regions analyzed in Subtask 2
ID
Name of the region Type of region Country
1 Municipality of East Olympus Coastal area 2 Municipality of Kassandra Coastal area 3 Municipality of Moudania Coastal area
4 Municipality of Naousa Mountain
5 Island of Thassos Island (small)
6 Municipality of Thermaikos Coastal area 7 Municipality of Vyssa, Ardas Music Festival Country side
Greece
8 Bled Lake side
9 Bohinj Lake side
10 Bovec Mountain
11 Bre
žice Country side
12 Cerklje na Gorenjskem - Krvavec Country side
ID
Name of the region Type of region Country
13 Izola Coastal area
14 Kamnik – Velika planina Mountain
15 Koper Coastal area
16 Maribor - Pohorje Country side
17 Piran Coastal area
18 Postojna Country side
19 Rogaška Slatina Country side
20 Zreče – Rogla Mountain
21 Danube-bend Country side
22 Eger Mountain
23 Gyula Country side
24 Kapolcs Country side
25 Lake Balaton Lake side
26 Lake Tisza Lake side
27 Lake Velence Lake side
28 Sopron Country side
Hungary
Table 10 contains the data of effect evaluations and average positions of each one of the mobility schemes listed in Positive & Highly positive evaluations decreasing order with the aim to compare congruence between the experts evaluations and the DSI proposed positions.
Table 10: Overall effect and position attributed to the Mobility schemes
MS Negative effect No effect positive Someeffect Positive effect Very positive effect Positive & Highly positive effect Number of positions between the first ten
Average position by DSI runs 20 0,00% 7,14 % 0,00% 53,57% 39,29% 92,86% 0 32,61 45 0,00% 10,71 % 3,57% 32,14% 53,57% 85,71% 7 23,07 19 0,00% 17,86 % 3,57% 64,29% 14,29% 78,57% 0 30,57 6 0,00% 7,14 % 17,86% 60,71% 14,29% 75,00% 1 25,29 5 0,00% 7,14 % 21,43% 42,86% 28,57% 71,43% 0 38,25 17 0,00% 3,57 % 25,00% 50,00% 21,43% 71,43% 0 34,43 16 0,00% 10,71 % 21,43% 35,71% 32,14% 67,86% 9 14,61 23 0,00% 32,14 % 0,00% 60,71% 7,14% 67,86% 10 15,57 24 0,00% 7,14 % 25,00% 53,57% 14,29% 67,86% 4 18,18 37 3,57% 14,29 % 14,29% 35,71% 32,14% 67,86% 24 7,07 38 7,14% 25,00 % 0,00% 60,71% 7,14% 67,86% 0 28,75
MS Negative effect No effect positive Some effect Positive effect Very positive effect Positive & Highly positive effect Number of positions between the first ten
Average position by DSI runs 2 0,00% 7,14 % 28,57% 39,29% 25,00% 64,29% 0 34,36 13 0,00% 7,14 % 28,57% 50,00% 14,29% 64,29% 0 20,50 18 0,00% 7,14 % 28,57% 42,86% 21,43% 64,29% 3 22,14 3 0,00% 21,43 % 17,86% 39,29% 21,43% 60,71% 0 26,04 22 0,00% 7,14 % 32,14% 53,57% 7,14% 60,71% 0 36,18 29 0,00% 14,29% 25,00% 32,14% 28,57% 60,71% 28 3,11 8 0,00% 10,71% 32,14% 25,00% 32,14% 57,14% 3 23,36 43 0,00% 21,43% 21,43% 28,57% 28,57% 57,14% 1 30,07 30 0,00% 7,14% 39,29% 39,29% 14,29% 53,57% 25 5,11 32 0,00% 7,14% 39,29% 35,71% 17,86% 53,57% 28 2,32 33 0,00% 10,71% 35,71% 39,29% 14,29% 53,57% 10 16,39 36 14,29% 10,71% 21,43% 32,14% 21,43% 53,57% 3 18,64 4 0,00% 10,71% 39,29% 25,00% 25,00% 50,00% 0 36,54 25 0,00% 21,43% 28,57% 46,43% 3,57% 50,00% 1 22,82 34 0,00% 10,71% 39,29% 46,43% 3,57% 50,00% 28 4,14 1 0,00% 17,86% 35,71% 35,71% 10,71% 46,43% 3 26,89 15 0,00% 21,43% 32,14% 35,71% 10,71% 46,43% 0 33,93 28 0,00% 32,14% 21,43% 21,43% 25,00% 46,43% 1 23,39 11 0,00% 35,71% 21,43% 28,57% 14,29% 42,86% 0 34,79 21 0,00% 7,14% 50,00% 39,29% 3,57% 42,86% 0 34,04 27 3,57% 35,71% 17,86% 32,14% 10,71% 42,86% 3 18,14 26 3,57% 21,43% 35,71% 21,43% 17,86% 39,29% 19 10,61 44 0,00% 35,71% 25,00% 28,57% 10,71% 39,29% 14 13,68 14 0,00% 39,29% 25,00% 28,57% 7,14% 35,71% 0 37,50 39 7,14% 39,29% 17,86% 14,29% 21,43% 35,71% 18 10,32 46 0,00% 28,57% 35,71% 17,86% 17,86% 35,71% 0 27,57 9 0,00% 46,43% 21,43% 25,00% 7,14% 32,14% 1 32,04 41 0,00% 42,86% 25,00% 21,43% 10,71% 32,14% 6 13,54 35 7,14% 42,86% 21,43% 14,29% 14,29% 28,57% 5 22,39 12 0,00% 35,71% 39,29% 17,86% 7,14% 25,00% 4 19,14 40 10,71% 53,57% 17,86% 14,29% 3,57% 17,86% 20 9,11 10 0,00% 57,14% 28,57% 10,71% 3,57% 14,29% 0 34,82 31 0,00% 21,43% 64,29% 14,29% 0,00% 14,29% 0 40,11 42 0,00% 53,57% 32,14% 7,14% 7,14% 14,29% 1 26,54 7 28,57% 50,00% 14,29% 7,14% 0,00% 7,14% 0 42,36
The above table highlights the fact that bicycling and walking related mobility schemes have been attributed with high ratings regarding their positive effects by the experts (e.g. 6 out of the first ten mobility schemes belong to these two categories). In contrast, information related mobility
schemes have been attributed with lower ratings regarding their positive effect. However, the number of occurrences of the respective mobility schemes seems not to follow strictly the related effect ratings by the experts. For instance, high numbers of occurrences appear for information and private car related mobility schemes. This is considered a major finding of the validation analysis procedures and is taken into account during the improvement phase of the DSI, which follows.
Finally, the next table summarizes the results of the comparison between the experts’ evaluations and the positions attributed to each mobility scheme by the DSI. The table can be read as follows:
The comparison between position proposed by the DSI and the effect attributed to the MS for each region referring to the following conditions:
Intervals:
• Very positive effect – Positions 1÷10; • Positive effect – Positions 1÷20;
• Some positive effect – Positions 15÷35; • No effect – Positions 36÷46;
• Negative effect – Positions 40÷46. Symbols:
• If the position proposed by the DSI is higher than the interval assigned to the effect evaluation rated by the expert: >;
• If the position proposed by the DSI is lower than the interval assigned to the effect evaluation rated by the expert: <;
• If the position proposed by the DSI is contained in the interval assigned to the effect evaluation rated by the expert: ok;
• If the position proposed by the DSI is contained in the top ten positions and the expert evaluation is of Positive or Very positive effect: √.