SCREENING OF POPULATION
DYNAMICS AND HYDROGEN
PRODUCTION IN CO-CULTURES
OF CALDICELLULOSIRUPTOR
SPECIES GROWING ON
TREATED WHEAT STRAW
SCREENING OF POPULATION DYNAMICS
AND HYDROGEN PRODUCTION IN
CO-CULTURES OF
CALDICELLULOSIRUPTOR
SPECIES
GROWING ON TREATED WHEAT
STRAW
SELMA SMRKOVIC
Smrkovic, S. Screening of population dynamics and hydrogen production in co-cultures of Caldicellulosiruptor species growing on treated wheat straw. Degree
project in Biomedical Laboratory Science, 15 credit points. Malmö University:
Faculty of Health and Society, Department of Science, 2019.
In 2017, 96% of hydrogen productionworldwide derived from fossil fuels while 4% was produced from electrolysis of water. To reach the goal of a fossil-free future more methods for hydrogen production is needed. Therefore, bacteria with the ability to produce hydrogen by fermentation at higher temperatures, i.e. thermophilic fermentation, are studied. One of the bacteria that is of interest belongs to the genus Caldicellulosiruptor. These species possess the ability to ferment lignocellulosic biomass, such as wheat straw, at higher temperatures to produce hydrogen. The amount of hydrogen produced by Caldicellulosiruptor has not yet been enough to be industrially effective. Co-cultures of different species have been seen to increase hydrogen production in comparison to pure cultures. Therefore, the aim of this study was to screen population dynamics and hydrogen production in co-cultures of Caldicellulosiruptor species while growing on treated wheat straw. The species used were C. saccharolyticus, C. owensensis, C.
kronotskyensis and C. bescii. This was done by screening combinations in serum
flasks and then analyzing one of the co-cultures in the bioreactor. From the screening, it could be seen that C. saccharolyticus was the dominant specie in all the co-cultures it was present in. The co-culture analyzed in the bioreactor was a cocktail of the four species, showing C. saccharolyticus as the most dominant specie as well as acetate as the main by-product. Production of propionate could also be seen in the bioreactor and hydrogen production was noted to be low compared to previous studies. Due to the many parameters that could not be controlled in the screening, the results are difficult to draw any conclusions from. The dominance of C. saccharolyticus in the bioreactor is however thought to be due to better adaptation ability as well as possibly higher cell number from the beginning.
SCREENING AV POPULATIONSDYNAMIK
OCH VÄTGASPRODUKTION I SAMODLINGAR
AV
CALDICELLULOSIRUPTOR
-ARTER
VÄXANDE PÅ BEHANDLAD HALM
SELMA SMRKOVIC
Smrkovic, S. Screening av populationsdynamik och vätgasproduktion i samodlingar av Caldicellulosiruptor-arter växande på behandlad halm.
Examensarbete i Biomedicinsk laboratorievetenskap, 15 högskolepoäng. Malmö
Universitet: Fakulteten för hälsa och samhälle, Institutionen för Biomedicinsk vetenskap, 2019.
År 2017 framställdes 96% av vätgasproduktionen världen över från fossila bränslen medan de resterande 4% producerades av elektrolys av vatten. För att nå målet om en fossilfri framtid behövs fler metoder för vätgasproduktion, därför studeras bakterier med förmågan att framställa vätgas genom fermentering vid högre temperaturer, så kallad termofil fermentering. En av de bakterier som är av intresse tillhör släktet Caldicellulosiruptor. Dessa arter har förmågan att
fermentera lignocellulistisk biomassa, såsom halm, vid högre temperaturer för att producera vätgas. Mängden vätgas som framställts av Caldicellulosiruptor har inte varit tillräcklig för att vara industriellt effektiv. Samodlingar av olika arter har visat sig öka vätgasproduktionen i jämförelse med rena kulturer. Syftet med denna studie var därför att screena populationsdynamiken och vätgasproduktionen av samodlingar från Caldicellulosiruptor-arter växande på behandlad halm. De använda arterna var C. saccharolyticus, C. owensensis, C. kronotskyensis och C.
bescii. Detta gjordes genom screening av kombinationer av ovanstående bakterier
i serumflaskor där sedan en av samodlingarna analyserade i bioreaktorn. Från screeningen sågs det att C. saccharolyticus var den dominerade arten i alla
samodlingar den var med i. Den samodling som analyserades i bioreaktorn var en cocktail av de fyra arterna som visade att C. saccharolyticus var den dominerande arten och att acetat huvudsakligen producerades. Produktionen av propionat kunde också ses i bioreaktorn och vätgasproduktionen noterades vara låg i jämförelse med andra studier. Till följd av flertalet parametrar i screeningen som inte kunde kontrolleras är det svårt att dra några slutsatser från screeningen. I bioreaktorn tros dock dominansen av C. saccharolyticus bero på bättre adaptionsförmåga samt eventuellt högre cellantal från början.
Nyckelord: Caldicellulosiruptor, C. bescii, C. kronotskyensis, C. owensensis, C. saccharolyticus, lignocellulistisk biomassa, vätgas.
TABLE OF CONTENTS
Introduction 4
Caldicellulosiruptor 4
Growth in batch culture 6
Lignocellulosic biomass 7
Hydrogen 8
Aim 8
Material and method 8
Preculture 9
Treatment of wheat straw 9
Co-culture 9 Bioreactor 10 Hydrogen samples 11 Liquid samples 11 DNA-extraction 11 qPCR 11 HPLC 12 Statistical analysis 12 Ethical considerations 12 Results 12
Population dynamics in screening 12
Hydrogen production 14 Fermentation products 14 Bioreactor 14 Discussion 15 Conclusion 18 Acknowledgements 19 References 20 Appendix 23
INTRODUCTION
Fossil fuels, such as oil, coal and natural gas, have for a long time been necessary for the development of countries and is today a major part in electricity
production worldwide. The pollutants, such as methane and carbon dioxide (CO2),
have for decades been released into the atmosphere, contributing to global warming as well as respiratory problems, especially in children [1]. The ever-going search for a substitute for fossil fuel has not stopped, however, according to some the energy of the future is hydrogen (H2) [2-4]. Hydrogen does not only
have a high energy density but also does not contribute to pollution of the environment. This is due to the conversion to mainly water when oxidized. Although H2 is seen as the natural substitute for fossil fuels, the hydrogen
produced today is mainly derived from fossil fuels [2]. Several new methods for H2-production is on the rise, amongst these are the process of hydrolyzing water
through wind- and solar power [5].
To reach the goal of a fossil-free future more methods for H2-production are
needed, therefore bacteria with the ability to produce H2 by fermentation at higher
temperatures, i.e. thermophilic fermentation, are studied [5]. The genus
Caldicellulosiruptor is of interest due to its ability to ferment lignocellulosic
biomass, such as wheat straw, at higher temperatures to produce H2. The amount
of H2 produced from Caldicellulosiruptor has to be increased 10-folds to be seen
as cost-effective for the industrial market [6]. Co-cultures of different species have been seen to increase hydrogen production in comparison to pure cultures [5].
Caldicellulosiruptor
Caldicellulosiruptor is an extremely thermophilic, gram-positive, strictly
anaerobic, non-spore-forming bacterium with the ability to degrade cellulose [7].
Caldicellulosiruptor species are rod-shaped and while some are immobile, such as C. owensensis, others, for instance, C. kronotskyensis, have a flagellum. Although
most of the species are found in geothermal hot springs, the geographical places in which they first were isolated, are spread all over the world; C. kronotskyensis and
C. bescii were found in Kamchatka, Russia whereas C. saccharolyticus and C. owensensis were found in Taupo, New Zealand, and Owens Lake, USA,
respectively. The genus Caldicellulosiruptor has an ability to ferment a wide variety of simple and complex sugars. These include glucose, xylose, mannose, pectine, cellulose, and hemicellulose. This is done via dark fermentation to mainly produce H2, CO2, acetate, and lactate [8-11]. Dark fermentation is also referred to
as anaerobic fermentation and is the process in which carbohydrates are degraded in the absence of solar energy [12].
C. saccharolyticus, C. kronotskyensis, and C. bescii are all classed as highly
cellulolytic species due to the vast presence of degrading enzymes. C. owensensis, however, is not known for its degrading abilities, more so for its ability to produce biofilm. The biofilm production is due to the presence of high levels of the
intracellular biomolecule Bis-(3′-5′)-cyclic dimeric guanosine monophosphate (c-di-GMP). C. saccharolyticus has the genes for production of c-di-GMP but is unable to produce any biofilm in pure cultures due to low intracellular levels [5,
Caldicellulosiruptor physically attaches to the substrate being degraded. This is
done by surface layer (S-layer) proteins, tāpirins, and glycoside hydrolases (GHs), which cover the surface of the bacteria [14-16]. GHs are lignocellulosic biomass-specific degrading enzymes, e.g. cellulases and hemicellulases and is produced by Caldicellulosiruptor in a diverse set. These enzymes degrade the glycosidic bonds in complex sugars. GHs exist in two forms; cell-anchored and free. In addition to the catalytic domains of the GHs, there is also a carbohydrate-binding domain. These domains bind specifically to carbohydrates, such as cellulose and xylan, resulting in enhanced catalysis due to the catalytic domain being close to the substrate as well as providing anchoring to the substrate [16-17]. S-layer proteins are covalently bound to the cell wall of the bacteria and have specialized domains at the end, allowing adherence to substrates. In some cases, the S-layered proteins contain GHs, with the ability to degrade the cellulose directly. These domains are called carbohydrate-active enzymes (CAZymes) [15]. Tāpirins, on the other hand, are non-catalytic cellulose binding proteins that bind to cellulose with high affinity [16].
Following degradation, the monomeric sugars are transported into the cell through membrane-bound ATP-binding cassette transporters (ABC-transporters). These are uniport, primary active transporters that use the energy provided from hydrolyzed ATP to move one monomeric sugar from outside to the inside of the cell. The ABC-transporter consists of two ATP-binding domains and a substrate-binding protein. Firstly, the substrate-substrate-binding protein attached to the transporter, binds to the monomeric sugar and then ATP is hydrolyzed to ADP and the energy received assists the sugar transportation against the gradient concentration of the membrane [18].
The main pathway used by Caldicellulosiruptor species for glucose degradation is the glycolysis, with a theoretical H2-yield of 4 mol/mol hexose (Figure 1).
Glycolysis, also referred to as the Embden-Meyerhof pathway, is present in the cytoplasm of the bacterium. A large set of enzymes catabolizes the glucose. To obtain hydrogen, the sugar is oxidized resulting in the gain of four electrons and protons. These are picked up by electron carrier nicotinamide adenine
dinucleotide (NAD+) giving NADH. Adenosine triphosphate(ATP) is produced by substrate-level phosphorylation thereby producing two pyruvate molecules. The by-products of the pyruvates are many. For maximal H2-yield, the preferred
outcome is the formation of acetic acid as a by-product. In this process the electron carrier flavin adenine dinucleotide (FADH2) is reduced, contributing to
two H2. During the formation of acetate two ATP are gained. In a closed
environment, the system can become thermodynamically saturated with hydrogen making the reaction go backward, producing lactic acid or propionic acid [18-19].
Figure 1: A schematic picture of the fermentation of sugars and possible outcomes. The picture is taken from [20].
Growth in batch culture
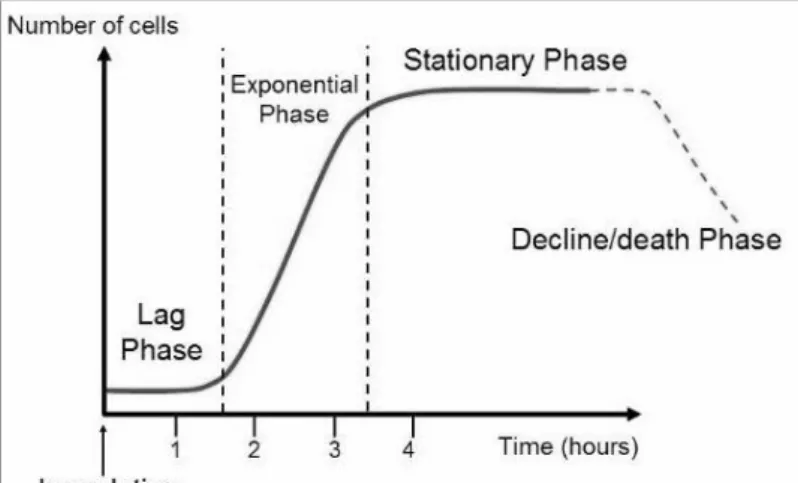
Population growth of microbes is often studied in closed systems where only a single batch of the medium is presented. These conditions are called batch cultures, and over time provides a decline in nutrient as well as an increase in waste concentration. Batch cultures are used when the different phases of cell growth (Figure 2) and fermentation products are being analyzed. A
microorganism that is introduced to fresh medium need a bit of time before an increase in cell number can occur. This period is called the lag phase and is not necessarily an indication of inactivity of the microbes. Sometimes the microbes are old and ATP-depleted or lack essential cofactors, enzymes, and ribosomes, which all first need to be synthesized before growth can begin. Eventually, growth is a factum, and the population begins to increase as a result of cell division. When microbes are growing and dividing at the maximal rate possible, the exponential (log) phase is reached. During the log phase, the rate of growth is high due to the high nutrient concentration. Eventually, the nutrition in the batch culture will reduce and population growth will slow down and thereafter stop. When a balance between cell division and cell death is achieved, the microbes have reached the stationary phase. Other reasons that the stationary phase is reached is an accumulation of waste products, for example, lactic acid which inhibits growth due to that the medium becomes acidic. After the stationary phase, the cells reach a death phase, where the cell number decline exponentially.
Reasons for this are irreparable harm to the cells due to nutrition deprivation as well as the buildup of toxic waste [18-19].
Figure 2: A schematic picture of the cell’s life cycle in batch culture. The time for the different phases is not representative for the bacterium used in this project. The picture is taken from [18].
Lignocellulosic biomass
Lignocellulosic biomass is the most abundant raw material worldwide and refers to plant biomass consisting mainly of three polymers; cellulose, hemicellulose, and lignin, but also very small amounts of the polysaccharide pectin, proteins, non-structural components (extractives), and ash. The content of cellulose, hemicellulose, and lignin varies from one plant species to another. Wheat straw consists of 30% cellulose, 50% hemicellulose and 15% lignin. To make microbial degradation of lignocellulosic biomass more effective, it is often pretreated (Figure 3). Pretreatment is done physically by e.g. milling, chemically with acids/alkaline or biologically with bacteria/fungi. Although many pretreatment techniques are very expensive (stands for 40% of the total processing cost in some cases), the main purpose is to make microbial degradation easier by disrupting the structure to increase the surface area and the enzyme accessibility of sugars [21-22].
Cellulose is composed of repeating units of cellobiose. Cellobiose is a
disaccharide with repeating units of beta-D-glucose which are linked together through beta-1,4 glycosidic bonds. Glycosidic bonds occur when sugar is bound to other functional groups. Cellobiose chains that are grouped together form microfibrils. These microfibrils are then bundled together to form cellulose fibers. Hydrogen, as well as van der Waals bonds, hold the cellulose structure together. Cellulose is present in two forms; crystalline and amorphous. These two forms are determined from interchains of hydrogen bonds within the microfibrils.
Amorphous cellulose regions refer to unorganized regions and are more susceptible to enzyme degradation, whereas crystalline regions are organized regions of cellulose. Cellulose primarily consists of crystalline regions, whereas amorphous regions only make up a small percentage [21-22].
Hemicellulose and lignin are covering the cellulose, protecting the cellulose from enzyme degradation, see Figure 3. Hemicellulose differs in composition and consist of different kind of sugar monomers such as xylose, glucose, galactose, and arabinose. In wheat straw the sugar monomer is mainly xylose, therefore the hemicellulose is called xylan. Just as cellulose, the sugars are connected with beta-1,4 glycosidic bonds. Lignin is made up of cross-linked phenolic monomers that are bound together by ether bonds. Lignin is present in the cell wall and gives
cellulose its rigid structure and prevents the cellulose from microbial attacks [21-22].
Figure 3: A schematic picture of the overview of the structure of lignocellulosic biomass before and after pretreatment. The picture is taken from [23].
Hydrogen
Hydrogenis the lightest element in the periodic table and the most abundant element in the universe. Three-quarters of all matter consists of hydrogen. The interest in hydrogen comes from the high energy yield that hydrogen possesses and that the exclusive product that is obtained from combustion is water, making it harmless to both humans and the environment [4]. Even though the combustion of H2 produces more energy per mass in comparison to fossil fuel, H2 contains
fewer particles per volume. It also lacks a volumetric energy density, making it difficult to store and distribute in comparison to fossil fuels. H2 in its molecular
form is not present in nature, therefore it has to be produced. In 2017, 96% of H2
-productionworldwide derived from fossil fuels, whereas 4% was produced from electrolysis of water [2-3].
Aim
The aim of this study was to screen population dynamics and hydrogen production in co-cultures of Caldicellulosiruptor species while growing on treated wheat straw. The species used were C. saccharolyticus, C. owensensis, C. kronotskyensis and C. bescii.
MATERIAL AND METHOD
Screening of population dynamics and hydrogen production in co-cultures was done in 50 ml serum flasks. Samples were taken daily for hydrogen analysis and liquid samples were taken day 3, 5 and 7 for analysis of metabolic compounds and population dynamics. One experiment was performed in a bioreactor on a co-culture cocktail. The strains used were C. saccharolyticus DSM 8903, C.
owensensis DSM 13100, C. kronotskyensis DSM 2002 and C. bescii DSM 6725
obtained from Deutsche Sammlung von Mikroorganismen und Zellkulturen (Braunschweig, Germany). All chemicals originated from Sigma Aldrich (Saint Louis, Missouri, USA) if nothing else is stated.
Preculture
Preculture medium was made by dissolving 1 ml Resazurin (0.5mg/L), 0.9 g NH4Cl, 0.75 g KH2PO4, 1.5 g K2HPO4, 1 ml trace element solution SL-10 and
11.9 g HEPES in 880 ml of MQ-water and the pH was adjusted to 7 using 10 M sodium hydroxide. The liquid was sparged with nitrogen until a color change to pink was seen. The preculture medium was autoclaved and 44 ml of preculture medium was complemented with 1 ml yeast extract, 0.5 ml MgCl2, 0.5 ml vitamin
solution, 1 ml glucose (500g/L) and 1 ml cysteine. Trace element solution SL-10 and vitamin solution was made according to the instructions from Deutsche Sammlung von Mikroorganismen und Zellkulturen [24]. The flasks were placed in a 70℃ Termaks incubator (Bergen, Norway) until the medium turned colorless. An amount of 2 ml bacteria of each strain was inoculated and incubated at 70℃ for 12 hours.
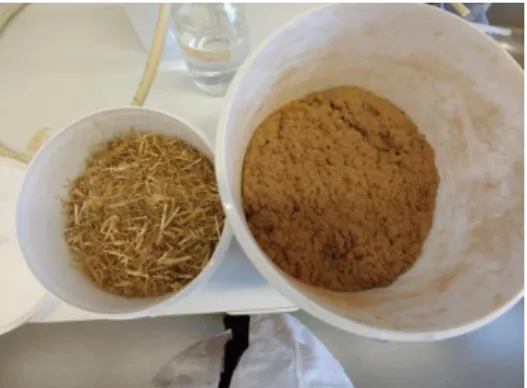
Treatment of wheat straw
Wheat straw (Figure 4) was obtained from Lund University, Department of Chemical Engineering. The wheat straw was soaked in 2% sulfuric acid. The slurry was pressed and thereafter steamed at 190℃ for 10 minutes. The dry treated wheat straw contained 0.646 g glucan and 0.08 g xylan per g.
Figure 4: Wheat straw on the left before pretreatment and on the right after treatment.
Co-culture
Co-culture medium was made by mixing 2 ml Resazurin, 2 ml Trace element solution, 23.8 g HEPES and 16 g treated wheat straw. The pH was adjusted to 7 and the medium was sparged with nitrogen at 10 ml/min for 40 minutes. The medium was then autoclaved, and 80 ml of medium was complemented with 10 ml anaerobic water, 1 ml MgCl2, 1 ml vitamin solution, 2 ml salt mixture and 2 ml
cysteine. The salt mixture consisted of 2.25 g NH4Cl, 1.875 g KH2PO4 and 3.75 g
K2HPO4 in 50 ml MQ-water. Before inoculation of precultured bacteria, the
optical density (OD) was measured at 620 nm with Ultrospec 2100 pro
UV/Visible spectrophotometer (Massachusetts, USA). A total of 4 ml of bacteria suspension with the OD 0.250 was inoculated according to table 1. Differences in OD between strains was equalized with anaerobic water and every case was made in duplicates. After inoculation, the cases were placed in a 70°C water bath with lid and stirring (Figure 5) for seven days. The headspace of each flask was continuously sparged with nitrogen at 0.67 ml/min through a 23G x 1” needle.
Table 1: The different cases studied in the screening. Case Specie 1 C. owensensis + C. saccharolyticus 2 C. owensensis + C. kronotskyensis 3 C. owensensis + C. bescii 4 C. saccharolyticus + C. kronotskyensis 5 C. bescii + C. saccharolyticus 6 C. bescii + C. kronotskyensis
7 Cocktail of all four
Figure 5: Illustration of the co-culturing at 70℃ for 7 days with continuously nitrogen sparge.
Bioreactor
From the bioreactor, hydrogen and liquid samples were taken directly after inoculation as well as 24, 30, 48, 54, 72. 78, 96, 102, 127 and 192 hours. In the bioreactor (Figure 6), 10g of treated wheat straw and 350 ml of MQ-water was mixed. The mixture was autoclaved and 100 ml of preculture medium without HEPES and 1 ml of vitamin stock solution as well as 0.4 g MgCl2, 1 g yeast
extract and 1 g cysteine, each dissolved in 50 ml MQ-water, was added. The temperature of the bioreactor was set to 70℃, pH 7 and stirring 80 rpm. Nitrogen was sparged at 5-6 ml/min. From the preculture medium, 2 flasks were taken giving a total of 100 ml each of the four species. This gave a working volume of 1L.
Hydrogen samples
Hydrogen was analyzed in gas phase samples taken at different time points during co-culturing using isothermal gas chromatography (200°C) on a 2 m packed ShinCarbon ST G3591-8118 culomn, 50/80 mesh with a thermal conductivity detector (Aligent 7890B,Aligent Technlogies, California,USA).
Liquid samples
Liquid samples (10ml) were taken from the serum flasks and 5 ml were taken from the bioreactor at given time points. Samples were vortexed and 2 ml was transferred to a new tube, following centrifugation at 20,000xg for 2 minutes. The supernatants were analyzed for metabolites using high-pressure liquid
chromatography (HPLC) while the pellets were analyzed for population dynamics using quantitative polymerase chain reaction (qPCR).
DNA-extraction
Cell pellets were resuspended in 100 μl of fresh lysozyme in TE-buffer (10 mmol Tris-HCl; 1mmol EDTA, pH 8). After incubation at 37℃ for 30 min, cells were lysed with 0.5 ml guanidium thiocyanate, EDTA and Sarkosyl solution, which was prepared according to Pitcher et al. [25]. The cell suspension was incubated at 37℃ for 30 min following a 10 min incubation on ice. To the suspension 400 μl of 4 M ammonium acetate was added and the suspension was kept on ice for an additional 10 min, thereafter 0.5 ml phenol:chloroform:isoamyl alcohol (ratio 25:24:1) was added and mixed thoroughly before centrifugation at 20,000xg for 10 min, following the subsequent transfer of the supernatant to a new Eppendorf tube. To the supernatant 0.5 ml Chloroform:isoamyl alcohol (ratio 24:1) was added following centrifugation at 20,000xg for 10 min. The supernatant was transferred to a new tube and an equal volume (⁓1 ml) of cold isopropanol was added to precipitate the DNA and incubation at room temperature for 10 min before centrifugation at 20,000xg for 10 min. The supernatant was discarded and the pellet was washed with 800 μl 99.5% cold ethanol and incubated in room temperature for 15 min, prior to centrifugation at 20,000xg for 15 min. The pellet was rinsed in 1 ml 70% ethanol following a 2 min incubation in room temperature and centrifugation at 20,000xg. The pellet was dried in a Savant automatic
environmental SpeedVac 2000 (Hyderabad, India) on high drying with radiant covering heating for 10 minutes.
qPCR
The concentration of DNA in samples was measured with BioDrop (Cambridge, UK) using μLite 0.5 mm. Samples obtained from the DNA-extraction was diluted to 10 ng/μl with autoclaved water. A master mix containing autoclaved MQ-water, 1x EvaGreen in water (Biotium, California, USA), Taq-polymerase buffer (Thermo Scientific, Vilnius, Lithuania), 0.1 mM dNTP’s, 0.3μM of both reverse and forward primers (Table 2) and Taq-polymerase in 20 mM MgCl2 was made.
In PCR-tubes, 19μl of master mix was added to 1μl of standards, samples, and no template controls (water). Standards were made by serial dilutions of DNA-extractions of pure culture bacteria to a concentration from 1ng/μl to 0.1pg/μl. To detect and quantify extracted DNA, the instrument Bio-Rad CFX96 real-time PCR (California, USA) was used together with the software Bio-Rad CFX 3.1. The PCR-program for the 4 species were almost the same, with only the annealing temperature variating. The PCR-program started with a 7 min heat-activation at 95℃, following 32 cycles of 30 sec of denaturation at 95℃, annealing for 30 sec and elongation at 72℃ for 20 sec. The annealing temperature for C. bescii was
55℃, C. saccharolyticus 53.5℃, C. kronotskyensis and C. owensensis 61℃. After the 32 cycles, the program ended with a melt curve analysis, starting at 65℃ with an increase of 0.5℃ per 30 sec to 95℃.
Table 2: Primers used in the master mix for the different species. Amplified regions are shown in appendix.
Primer Nucleotide sequence (5’-3’) Melt
temperature (℃) Base pair (bp) C. owensensis F GGCAAGTGGGAAGAAGATGA 54.8 190 R CTCCGCAAGACTTGAACACA 55.3 C. bescii F CAAATGGTGATGTTGCTCCA 53.5 201 R TGAGGCACGACAACTACCTG 56.9 C. saccharolyticus F TATTATGGGGATTGGGACGA 52.8 207 R CTGGCGCACCAAAGATAAAT 53.6 C. kronotskyensis F CAGGAGATGGAACGTGGATT 54.5 224 R CCATGGAGCAGTCCCACTAT 56.5 HPLC
Supernatants obtained from centrifugation of the liquid samples were filtered through a 20 μm sterile filter. Samples were diluted with equal volume of MQ-water. A standard mix containing glucose (10 g/L), xylose (5 g/L), lactate (5 g/L), acetate (6 g/L), propionate (2 g/L) and ethanol (2.29 g/L) was serial diluted 100x with MQ-water to give seven standards. The samples were analyzed using an Aminex HPX-87H ion exclusion column (300x7.8 mm) from Bio-Rad, California, USA at a flow rate of 0.6 ml/min and 5mM sulfuric acid as mobile phase. The HPLC used was a Waters 717 plus autosampler (Artisan Technology group, Illinois, USA). The detectors used were Waters 2487 Dual λ Absorbance Detector (Artisan Technology group, Illinois, USA) at 254 nm and Refractive Index
Detector 6A (Shimadzu Corporation, Kyoto, Japan).
Statistical analysis
The results are present as the mean of duplicates with the standard deviation for the means as error bars.
Ethical considerations
The bacteria used are wild type bacteria and does not originate from the human. Therefore, no ethical review was needed for this project.
RESULTS
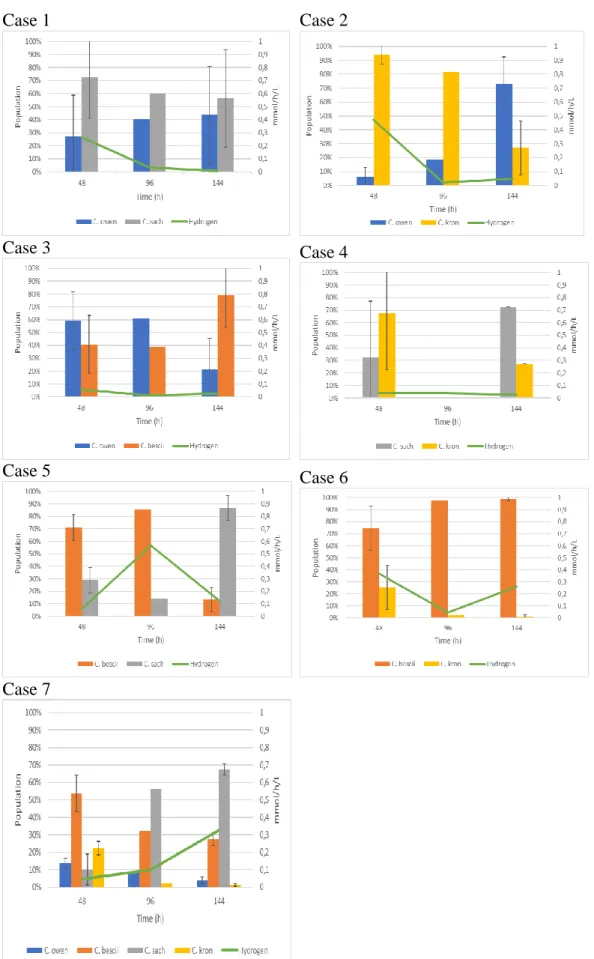
Population dynamics in screening
Co-cultures in which C. kronotskyensis was coupled with C. saccharolyticus and
C. owensensis showed an immense push-back of the specie after 144 hours. C. bescii showed a dominance when coupled with C. kronotskyensis and C. owensensis after 144 hours, in comparison to when coupled with C.
saccharolyticus where it was pushed back after 144 hours. The population of C. owensensis fluctuated in all of the flasks, with the least fluctuation when coupled
with C. saccharolyticus. Interestingly, C. saccharolyticus was the dominant specie after 144 hours in all the cases it was present in. However, when coupled with C.
Case 1 Case 2
Case 3 Case 4
Case 5 Case 6
Case 7
Figure 7: Overlook of the different population dynamics and hydrogen production in the flasks for screening.
Hydrogen production
The first case showed a decreasing hydrogen production with the hydrogen measuring to 0.009 mmol/h/L after 144 hours. Case 2 also showed a decrease in hydrogen production over time, with 0.045 mmol/h/L after 144 hours. Case 3 and 4 gave a hydrogen production of 0.025 and 0.027 mmol/h/L, respectively after 144 hours. Case 5 and 6 showed higher hydrogen production reaching 0.119 and 0.262 mmol/h/L after 144 hours. Case 7 showed the steadiest increase of
hydrogen production reaching 0.327 mmol/h/L after 144 hours.
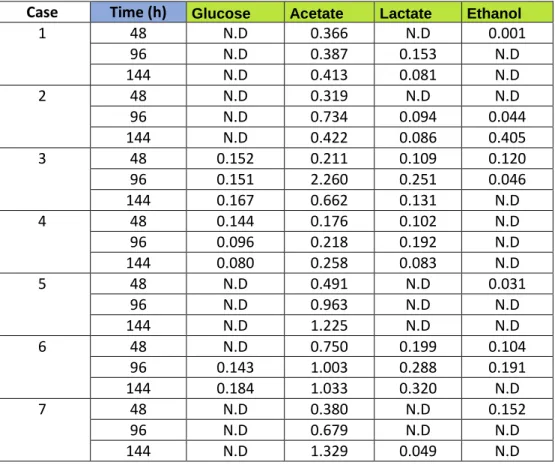
Fermentation products
Glucose were only found in 3 of the flasks, namely case 3, 4 and 6. Xylose could not be detected in any of the flasks. Production of acetate was the major
fermentation product throughout the experiment. Propionate could only be found in case 1 after 144 hours and was then the main fermentation product. Production of lactate and ethanol could be seen throughout the experiment as shown in Table 3.
Table 3: Fermentation products (g/L) produced during incubation at 70℃ from
the co-cultures in 50 ml serum flasks. Values found below the detection limit is set as not detected (N.D).
Case Time (h) Glucose Acetate Lactate Ethanol
1 48 N.D 0.366 N.D 0.001 96 N.D 0.387 0.153 N.D 144 N.D 0.413 0.081 N.D 2 48 N.D 0.319 N.D N.D 96 N.D 0.734 0.094 0.044 144 N.D 0.422 0.086 0.405 3 48 0.152 0.211 0.109 0.120 96 0.151 2.260 0.251 0.046 144 0.167 0.662 0.131 N.D 4 48 0.144 0.176 0.102 N.D 96 0.096 0.218 0.192 N.D 144 0.080 0.258 0.083 N.D 5 48 N.D 0.491 N.D 0.031 96 N.D 0.963 N.D N.D 144 N.D 1.225 N.D N.D 6 48 N.D 0.750 0.199 0.104 96 0.143 1.003 0.288 0.191 144 0.184 1.033 0.320 N.D 7 48 N.D 0.380 N.D 0.152 96 N.D 0.679 N.D N.D 144 N.D 1.329 0.049 N.D Bioreactor
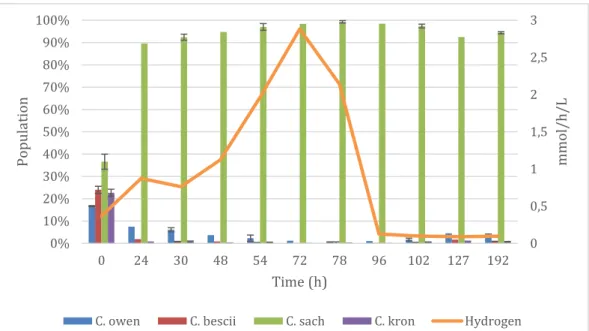
In the bioreactor, C. saccharolyticus took over after 24 hours (Figure 8) and stayed the dominant species during the experiment. C. bescii and C.
kronotskyensis was pushed back almost immediately, while the increase of C. owensensis could be seen by the end as depicted in Figure 8. Hydrogen production
increased steadily up to 72h and thereafter a dramatic decrease occurred from then onward as illustrated in Figure 8. At 72 hours the hydrogen production reached 2.9 mmol/h/L and at 192 hours it was 0.095 mmol/h/L. Glucose was initially present and decreased throughout the experiment and was not detected at 78
hours as shown in Table 4. The main by-product was acetate which increased by a factor of 10 during the experiment. The production of both lactate and propionate showed a 50% increase. Ethanol was initially detected and was not found again until after 4 days (72h) and thereafter showed a biphasic production. The presence of xylose was not detected.
Figure 8: Hydrogen production and population dynamics in the cocktail analyzed in the bioreactor.
Table 4: Fermentation products (g/L) produced during incubation at 70℃ from the cocktail analyzed in the bioreactor. Values found below the detection limit is set as not detected (N.D).
Time (h) Glucose Acetate Lactate Propionate Ethanol
0 5.387 0.230 0.210 0.113 0.127 24 4.372 0.746 0.295 0.162 N.D 30 4.169 0.887 0.299 0.163 N.D 48 3.549 1.175 0.313 0.170 N.D 54 2.850 1.330 0.321 0.180 N.D 72 0.823 2.203 0.340 0.201 0.050 78 N.D 2.482 0.330 0.160 0.020 96 N.D 2.592 0.333 0.192 0.081 102 N.D 2.615 0.333 0.162 0.030 127 N.D 2.623 0.328 0.173 0.025 192 N.D 2.725 0.334 0.169 0.076
DISCUSSION
The use of Caldicellulosiruptor species for hydrogen production is due to the genus’ promising abilities to ferment lignocellulosic biomass and their ability to give a hydrogen yield near the theoretical maximum of 4mol/mol hexose [6]. Previous studies have shown an increase in hydrogen-yield from co-cultures in comparison to pure cultures of the same species [5-6]. Therefore, in this project,
0 0,5 1 1,5 2 2,5 3 0% 10% 20% 30% 40% 50% 60% 70% 80% 90% 100% 0 24 30 48 54 72 78 96 102 127 192 mmol /h/ L Pop ul ation Time (h)
cultures of the Caldicellulosiruptor species C. saccharolyticus, C. bescii, C.
owensensis and C. kronotskyensis, while growing on treated wheat straw. This
was done by screening co-cultures in serum flasks and thereafter analyzing one co-culture in the bioreactor. To determinate the hydrogen production over time, hydrogen was analyzed with GC and population dynamics with qPCR.
In theory, one Caldicellulosiruptor specie should compete with another one due to their ability to ferment the same sugars [26]. Co-cultures of Caldicellulosiruptor species have, however, previously shown that they in some cases even help one another grow. This has previously been done by analyzing co-cultures of C.
kristjansonii and C. saccharolyticus, a combination that not only showed a higher
hydrogen yield in comparison to pure culture growth but also a shortened lag phase for C. kristjansonii in the presence of the supernatant of C. saccharolyticus. The reason for this is believed to be due to the release of growth compounds or signaling molecules produced by C. saccharolyticus [27]. Previous studies of C.
owensensis and C. saccharolyticus have also shown improved growth and
hydrogen production in one another’s presence [5].
The results obtained from the screening of co-cultures in serum flasks are difficult to draw any conclusions from, due to the large error bars and the many parameters that could not be controlled, such as pH and partial pressure of hydrogen and carbon dioxide. Still, possible competition between species and population dynamics, but also by-products from fermentation can be seen from the serum flasks. From the serum flasks, it seems as if competition for sugars between highly cellulolytic bacteria occurs, with the most prominent being C.
saccharolyticus and C. kronotskyensis. In the flask with C. saccharolyticus and C. owensensis propionate was discovered. Production of propionate has not been
seen before in cultures of Caldicellulosiruptor species. The database of Kyoto encyclopedia of genes and genomes (KEGG) [28-31] show that C. owensensis, C.
kronotskyensis, C. saccharolyticus and C. bescii, however, have the gene for
conversion of pyruvate to propionate. Even though the composition of the treated wheat straw is not fully known, a HPLC analysis of only the wheat straw medium showed no propionic acid present in the medium which indicates that the
bacterium is producing the propionic acid. It can not be ruled out that it is another metabolite that is produced with the same retention time as propionate. According to Zeppa et al [32], propionate and acetoin have the same retention time. Acetoin is a common metabolic product produced by a variety of bacteria growing in environments containing glucose and other fermentable carbon sources that are degraded via the glycolysis pathway [33]. If this is the by-product instead of propionate is yet to be further investigated.
The cocktail mix was tried in the bioreactor due to the rapidly shifting population dynamics, the steady increase in hydrogen production over time and the low error bars of the population dynamics in comparison to the other graphs. In the
bioreactor, the temperature, nitrogen flow, stirring speed and pH are monitored, making the environment more controlled than in the serum flasks. There is also a sample port for liquid samples, which make it more reliable for population dynamics comparison over time. Pawar et al’s study [5] analyzed population dynamics in biofilm samples obtained from different places in the bioreactor. This showed that depending on where you take the sample the population dynamics variate. This stresses the importance to take the sample from the same spot every time to be able to compare population dynamics over time. In the serum flasks, the goal was to take the liquid samples from the middle. This, however, was very
difficult due to the color of the liquid as well as the needle getting plugged by wheat straw. When taking the liquid sample, not only the liquid was taken, but also wheat straw followed. This can be argued to give a clearer picture of the population dynamics since both free and attached cells to the substrate are
examined. There are not, however, many studies done on the population dynamics of Caldicellulosiruptor species in co-cultures, less so on treated wheat straw.
In the bioreactor, it can be seen that hydrogen production during the first 72 hours is mainly due to glucose consumption. To obtain a high hydrogen production, the primary by-product is acetate [34]. The production of hydrogen in the bioreactor is low compared to that observed by Pawar et al [5]. The reason why this is so and why C. saccharolyticus was dominant in the co-cultures remains unknown. It could be that it contains some metabolic advantages over the other
Caldicellulosiruptor species. One reason could be that it possesses sugar
transporters with higher affinity for xylose and glucose compared to the other species in the culture. C. saccharolyticus has shown to prefer fermentation of xylose over glucose [35] and this was also recently found for C. kronotskyensis (Vongkampang et al unpublished results) and may be a trait of other
Caldicellulosiruptor species. C. kronotskyensis, C. bescii and C. saccharolyticus
are the three strongest cellulolytic species in the Caldicellulosiruptor genus. C.
saccharolyticus is capable to degrade a broad variety of polysaccharides as well as
metabolize a variety of sugars. In comparison to the other species this gives C.
saccharolyticus an advantage in adapting to new environments [36].
From the fermentation products in the bioreactor it can be seen that ethanol was initially detected and was not found again until 4 days and thereafter showed a biphasic production. The reason to this can be ethanol’s boiling point at 78℃ and its property as a volatile compound [37]. At 70℃ ethanol gets a higher volatility and since the fermentation products are analyzed in the liquid phase this would give a lower ethanol concentration. The nitrogen flushing through the system might also have carried out some of the volatile ethanol.
C. kronotskyensis has the biggest set of CAZymes, making it a particularly good
degrader of lignocellulosic biomass, as well as the largest set of ABC-transporters [38]. All the strong saccharolytic bacteria also have two sets of tāpirins, which make them even stronger attached to the substrate to be degraded, while C.
owensensis produces related proteins but does not have any tāpirins present [14].
Therefore, it is surprising that the other highly cellulolytic bacteria did not compete more with C. saccharolyticus. This can be due to the uneven number of bacteria that were inoculated since the thermophilic bacterium
Caldicellulosiruptor is known for its low cell density [6]. In the serum flasks, this
was more controlled due to the measuring of OD before inoculation. Even though the OD does not give any measurements of viable cells, having the same cell number, in the beginning, makes it easier to get an overview of population dynamics over time, especially when the species used have a low cell density to begin with. Interestingly, a steady production of propionate and lactate can be seen throughout the experiment. Propionic acid bacteria have been seen to be able to produce propionate by the formula 3 Lactate → 2 Propionate + 1 Acetate + CO2
+ H2O [39]. Whether the Caldicellulosiruptor species ferment lactate to
Screening of population in serum flasks is an easy way to get an overlook of hydrogen production and population dynamics. In this project, the set-up used for the serum flasks (Figure 5) enabled 15 flasks to be run at the same time. This made the set-up very time efficient. The problems with the set-up were that the only parameters that could be controlled was the temperature and stirring speed. Other parameters such as pH, nitrogen flow and anaerobic environment in the flask could not be controlled. pH was not stable due to the production of acids from growing bacteria. To prevent an immediate pH-drop, HEPES was used due to its ability to work as a strong buffer. Even though HEPES was used, it cannot be confirmed that the pH stayed at 7. Something that could have been done is controlling the pH, after the last liquid sample was taken, with a pH-probe to see whether a pH-change in the flask occurred. Usually, to know whether the
conditions in the flasks are anaerobic, oxygen indicator resazurin is used. Resazurin shows the oxygen level by color changes where blue indicates high oxygen level, and pink and colorless indicate low respectively no oxygen in the liquid. Nitrogen sparging is, however, an effective method for oxygen removal and cysteine was used due to its ability to bind to the remaining oxygen in the bottle. The wheat straw, however, has a brown color, therefore no color change could be seen, and it can not be said for sure that an anaerobic environment was obtained.
Accumulation of hydrogen in the headspace acts as an inhibitor for the hydrogen production pathway. Therefore, keeping the hydrogen partial pressure low in the system will increase hydrogen production. Nitrogen was sparged into the system to remove oxygen [40] and increase hydrogen yield [41]. The amount of nitrogen that was sparged into the serum flask could not be controlled due to water vapor into the filter inlet of gas, back pressure of the system, as well as, the desire of gas’ to choose the pathway with the lowest resistance. The stirring is important for the bacteria to be able to degrade the substrate from many different angles and for the cell population to be homogeneous throughout the medium. If the stirring speed is too high the species will have it difficult to attach to the substrate and, for some species, form biofilm. To overcome the difficulties from the serum flasks, one co-culture was analyzed in the bioreactor. By using the bioreactor, pH, temperature, stirring, and nitrogen flow could be controlled. The sampling was also easier with a stationary sampling port. The extraction method is a further development of Pitcher et al’s protocol [25] for extraction of gram-positive bacteria. Extraction columns could not be used due to the wheat straw particles that polluted the pellet.
Conclusion
The aim of this study was to screen population dynamics and hydrogen production in co-cultures of Caldicellulosiruptor species growing on treated wheat straw. In conclusion, the results from the serum flasks give a good overview of possible population dynamics and production of by-products. No further conclusions can be drawn from the results from the serum flasks due to the many parameters in the environment that can not be controlled. In the bioreactor, the cocktail showed a dominance of the specie C. saccharolyticus producing mainly acetate. This can be due to the higher cell number in the beginning, as well as C. saccharolyticus being possibly better adapted to the new environment. Not many conclusions can be drawn from the hydrogen production, due to that only one co-culture was tested in the bioreactor. The hydrogen obtained is however lower than seen in previous
studies. The propionate seen from the HPLC data, on the other hand, is an interesting found that needs to be further analyzed.
ACKNOWLEDGMENTS
I would like to express my gratitude to my supervisor Thitiwut Vongkampang for his guidance throughout the work. Thanks to Krishnan Sreenivas for his valuable input in optimizing the methods. I am also very grateful to Ed van Niel for the input and feedback on this paper. A huge thanks to the Department of Applied Microbiology at Lund University where the lab work took place for the great hospitality. Lastly, I would like to thank Lennart Ljunggren at Malmö University for taking his time to read through and give me valuable feedback on this paper.
REFERENCES
1. Perera F, (2018) Pollution from Fossil-fuel combustion is the leading environmental threat to global pediatric health and equity. International
Journal of Environmental Research and Public Health, 15 (1), 1-16.
2. Tuller L, (2017) Solar to fuels conversion technologies: a perspective.
Materials for renewable and sustainable energy, 6 (1), 1-16.
3. Gomez X, Fernandez C, Fierro J, Sanchez M.E, Escapa A, Moran A, (2011) Hydrogen production: Two stage processes for waste degradation.
Bioresource Technology, 102 (18), 8621-8627.
4. Das D, Veziroglu N, (2001) Hydrogen production by biological processes: a survey of literature. International journal of hydrogen energy, 26 (1), 13-28.
5. Pawar S, Vongkumpeang T, Grey C, van Niel E, (2015) Biofilm formation by designed co-cultures of Caldicellulosiruptor species as a means to improve hydrogen productivity. Biotechnology for Biofuels, 8 (19), 1-12. 6. Willquist K, Zeidan A, van Niel E, (2010) Physiological characteristics of
the extreme thermophile Caldicellulosiruptor saccharolyticus: an efficient hydrogen cell factory. Microbial cell factories, 9, 1-17.
7. Peng X, Su H, Mi S, Han Y, (2016) A multifunctional thermophilic glycoside hydrolase from Caldicellulosiruptor owensensis with potential applications in production of biofuels and biochemicals. Biotechnology for
Biofuels, 9 (98), 1-13.
8. Yang S, Kataeva I, Wiegel J, Yin Y, Dam P, Xu Y, Westpheling J, Adams W, (2010) Classification of ‘Anaerocellum thermophilum’ strain DSM 6725 as Caldicellulosiruptor bescii sp. nov.. International journal of
systematic and evolutionary microbiology, 60, 2011-2015.
9. Miroshnichenko L, Kublanov V, Kostrikina A, Tourova P, Kolganova V, Birkeland N, Bonch-Osmolovskaya A, (2008) Caldicellulosiruptor
kronotskyensis sp. nov. and Caldicellulosiruptor hydrothermalis sp. nov.
two extremely thermophilic, cellulolytic, anaerobic bacteria from Kamchatka thermal springs. International Journal of systematic and
evolutionary microbiology, 58, 1492-1496.
10. Huang C, Patel K, Mah A, Baresi L, (1998) Caldicellulosiruptor
owensensis sp. nov., an anaerobic, extremely thermophilic, xylanolytic
bacterium. International journal of systematic bacteriology, 48, 91-97. 11. Rainey A, Donnison M, Janssen H, Saul D, Rodrigo A, Bergquist L,
Daniel M, Stackebrandt E, Morgan W, (1994) Description of
Caldicellulosiruptor saccharolyticus gen. nov., sp. nov: An obligately
anaerobic, extremely thermophilic, cellulolytic bacterium. FEMS
Microbiology Letters, 120, 263-266.
12. Rittmann S, Herwig C, (2012) A comprehensive and quantitative review of dark fermentative biohydrogen production. Microbial cell factories, 11 (115), 1-18.
13. Peintner C, Zeidan A, Schnitzhofer W, (2010) Bioreactor systems for thermophilic fermentative hydrogen production: evaluation and
comparison of appropriate systems. Journal of cleaner production, 18 (1), 15-22.
14. Blumer-Schuette E, Alahuhta M, Conway M, Lee L, (2015) Discrete and structurally unique proteins (Tāpirins) mediate attachment to extremely thermophilic Caldicellulosiruptor species to cellulose. The Journal of
biological chemistry, 290 (17), 10645-10656.
15. Conway M, Pierce S, Le H, Harper W, (2016) Multidomain, surface layer-associated glycoside hydrolases contribute to plant polysaccharide
degradation by Caldicellulosiruptor species. The journal of biological
chemistry, 291 (13), 6732-6747.
16. VanFossen L, Ozdemir I, Zelin L, Kelly M, (2011) Glycoside hydrolases inventory drives plant polysaccharide deconstruction by the extremely thermophilic bacterium Caldicellulosiruptor saccharolyticus.
Biotechnology and bioengineering, 108 (7), 1559-1569.
17. Guillén D, Sánchez S, Rodriguez-Sanoja R, (2009) Carbohydrate-binding domains: multiplicity of biological roles. Applied microbiology and
biotechnology, 85, 1241-1249.
18. Harley J, Willey J, Prescott L, (2014) Prescott’s microbiology. New York, USA: McGraw-Hill Education.
19. Hardin J, Bertoni G, Kleinsmith J, Becker W, (2016) Becker’s world of the
cell: technology update. Essex, England; Pearson education limited.
20. Barrera-Quintero V, Davila-Gomez A, Rizo-Acosta P, Hernandez-Rojas E, Baez-Pimiento S, (2017) Gompertz Equation’s First and Second Derivatives for Kinetics Analysis of Batch Dark Fermentation on
BioHydrogen Production. European Journal of Engineering Research and
Science, 2 (11), 18-22.
21. Bajpai P, (2016) Structure of lignocellulosic biomass. I Bajpai P, (Eds)
Pretreatment of lignocellulosic biomass for biofuel production (1st
edition). Singapore, Singapore: Singapore springer, s 7-12.
22. Zhang Y, Berson E, Sarkanen S, Dale E, (2009) Pretreatment and biomass recalcitrance: fundamentals and progress. Applied biochemistry and
biotechnology, 153, 80-83.
23. Boldor D, Muley D, (2017) Advances in biomass pretreatment and
cellulosic bioethanol production using microwave heating. Proceedings of
SEEP, 27-30.
24. DSMZ, (2010) 461. Mineral medium (Nagel and Andreesen).
>https://www.dsmz.de/microorganisms/medium/pdf/DSMZ_Medium461. pdf< PDF (8/6-19).
25. Pitcher G, Saunders A, Owen J, (1989) Rapid extraction of bacterial genomic DNA with guanidium thiocyanate. Letters in Applied
Microbiologi, 8, 151-156.
26. Hardin G, (1960) The competitive exclusion principle. American
association for the advancement of science, 131, 1292-1297.
27. Zeidan A, Rådström P, van Niel E, (2010) Stable coexistence of two
Caldicellulosiruptor species in a de novo constructed hydrogen-producing
co-culture. Microbial cell factories, 9 (102), 1-13.
28. Kyoto encyclopedia of genes and genomes (KEGG), (2019) Propanoate
metabolism – Caldicellulosiruptor saccharolyticus.
>https://www.genome.jp/kegg-bin/show_pathway?csc00640< HTML (27/3-19).
29. Kyoto encyclopedia of genes and genomes (KEGG), (2019) Propanoate
metabolism - Caldicellulosiruptor bescii.
>https://www.genome.jp/kegg-bin/show_pathway?ate00640< HTML
(27/3-19).
30. Kyoto encyclopedia of genes and genomes (KEGG), (2019) Propanoate
metabolism – Caldicellulosiruptor owensensis.
>https://www.genome.jp/kegg-bin/show_pathway?cow00640< HTML (27/3-19).
31. Kyoto encyclopedia of genes and genomes (KEGG), (2019) Propanoate
metabolism – Caldicellulosiruptor kronotskyensis.
>https://www.genome.jp/kegg-bin/show_pathway?ckn00640< HTML (27/3-19).
32. Zeppa G, Conterno L, Gerbi V, (2001) Determination of Organic Acids, sugars, diacetyl and acetoin in cheese by high-performance liquid
chromatography. Journal of agricultural and food chemistry, 49 (6), 2722-2726.
33. Xiao Z, Xu P, (2007) Acetoin metabolism in bacteria. Critical reviews in
microbiology, 33 (2), 127-140.
34. Martinez-Merino V, Gil J, Cornejo A, (2013) Biomass sources for hydrogen production. Renewable hydrogen technologies, 87-110. 35. VanFossen L, Verhaart A, Kengen W, Kelly M, (2009) Carbohydrate
utilization patterns for the extremely thermophilic bacterium
Caldicellulosiruptor saccharolyticus reveal broad growth substrate
preferences. Applied and environmental microbiology, 75 (24), 7718-7724.
36. van de Werken G. Verhaart A, VanFossen L, Willquist K, (2008) Hydrogenomics of the extremely thermophilic bacterium
Caldicellulosiruptor saccharolyticus. Applied and environmental microbiology, 74 (21), 6720-6729.
37. U.S. National Library of Medicine, (2019) Compound summary Ethanol. >https://pubchem.ncbi.nlm.nih.gov/compound/Ethanol< HTML (8/6-19). 38. Zurawski V, Conway M, Lee L, Simpson J, (2015) Comparative analysis of extremely thermophilic Caldicellulosiruptor species reveals common and unique cellular strategies for plant biomass utilization. Applied and
environmental microbiology, 81 (20), 7159-7170.
39. Phelps A, Johnson J, Peterson H, (1939) The production and utilization of lactic acid by certain propionic acid bacteria. Biochemical journal, 1606-1610.
40. Butler I, Schoonen A, Rickard D, (1994) Removal of dissolved oxygen from water: a comparison of four common techniques. Elsevier science, 41 (2), 211-215.
41. Balachandar G, Khanna N, Das D (2013) Biohydrogen production from
organic wastes by dark fermentation. I: Pandey A, Chang J, Hallenbeck P,
Larroche C, (Eds) Biohydrogen (1st edition). Amsterdam, Holland: Elsevier, s. 103-135.
APPENDIX
Amplified regions by primers
Caldicellulosiruptor bescii CAAATGGTGATGTTGCTCCATGTGATGGTTTTTTTACTTTTCCTGAGTATATTG CAGGAAACATAAGAGAATCTTCTGTCTTGGATATATGGGAAAGGTCTAATGT ATTTTCAAAGTTGTCCGAACTAAATAGATTAGATATTAAAGGTGTTTGTAGTA AATGTATATTTCTAAGTACATGTGCAGGTAGTTGTCGTGCCTCA Caldicellulosiruptor kronotskyensis CAGGAGATGGAACGTGGATTAATGGAGGATTCTTTGTTTTAGAACCAGAAAT TTTTAATTATATTAAAGATGACTCTACAATTTTTGAAAGAGAACCATTAGAAA GATTGGCAAAGGAAAATCAATTGAATGCATATAAACATTATGGGTTTTGGAA AGCAATGGATACACTAAGAGACAAAATTGAATTAGAAAATTTGTGGAATAGT GGGACTGCTCCATGG Caldicellulosiruptor owensensis GGCAAGTGGGAAGAAGATGAAAAAAATTGCAGGCTATTTTTATTCCAATCAT CTGCAAAAGTCAGGTTGCATAGCTTCCTGCCAATCCAGTTTGACAACGCTTCT TTTGGGCATAAAAAAGACCACCTCTCGCAAAGTTTTTGACTTTGCGATTGGTG GCCGTGGCTTACTGTGTTCAAGTCTTGCGGAG Caldicellulosiruptor saccharolyticus TATTATGGGGATTGGGACGAGGTTATACTGATACTATCGTAATCAAAAATAA GTTTCGCCAATCTAATAATGGTAAACTCATGGAATTTAAGCCTGTTAAGATAA TGTCAAATGTTATGTTGGCATCTGGTAAATTAGCAGTGACGAAAGATAAAAA GTTATACATTTTTTGCAATAACACTGGACCATTTATCTTTGGTGCGCCAG
![Figure 1: A schematic picture of the fermentation of sugars and possible outcomes. The picture is taken from [20]](https://thumb-eu.123doks.com/thumbv2/5dokorg/4210994.92503/7.892.145.745.84.405/figure-schematic-picture-fermentation-sugars-possible-outcomes-picture.webp)