GEOtop/OMS3 - Model Integration and Case Study
Giuseppe Formetta1, Matteo Dall’Amico, Riccardo Rigon University of Trento, 77 Mesiano St., Trento, 38123, ItalyOlaf David, Luis Garcia
Department of Civil and Environmental Engineering Department, Colorado State University Giovanna Capparelli, Pasquale Versace
University of Calabria - Arcavacata Campus - via P. Bucci - 87036 Arcavacata di Rende (CS), Italy
Abstract. The paper presents the integration of the GEOtop model into the Object Modeling Sys-tem version 3.0 (OMS3) and its application. GEOtop is a physically based spatially distributed rainfall-runoff model, performing water and energy budgets. The OMS3 integration widened the application range of GEOtop as presented in the paper. By running GEOtop as an OMS3 model component it can interact with the GIS uDig-JGrass to utilize other geo-processing, visualization, and modeling components. Furthermore, OMS3 components for automatic calibration, sensitivity analysis, or meteorological interpolation can now interact with GEOtop. Finally, a case study of the model application is presented. Results in terms of soil water content and suction are compared with measured data. Model performance is evaluated by computing traditional goodness of fit indi-ces such as Nash Sutcliffe and percent bias.
1. Introduction
Due to the work of Freeze and Harlan (1969) and the development of the SHE model (e.g. Abbot, 1986) it became obvious that complex models that account for many interac-tions of fluxes of the hydrological cycle at small scale require lot of information. These models are not very flexible to adapt to statistical approaches despite the considerable number of parameters. They reveal easily inconsistencies within the data making it even more trick difficult to use them.
Examples of such models are CATHY (Paniconi et al., 2003), TRibs (Garrote and Bras, 1995), Catflow (Zehe and Blöschl, 2004), DHSVM (Wigmosta and Lettenmaier, 1994), and GEOtop (Rigon et al., 2006). GEOtop is unique in this regard since it solves simultaneously the water and energy budget similar to other models (Wang et al., 2009; Niu Guo Yue et al., 2012). Calibration of their water budgets affects the energy fluxes and vice-versa, therefore making this process more challenging than traditional models.
Another big constraint of many of the above models is their monolithic structure that makes it difficult to study, improve, and test them collaboratively among developers. For these reasons, enhancing GEOtop with a set of tools that simplify its use and prepare it for a future "modularization" is necessary.
The first phase of this effort by integrating GEOtop as a black-box component into OMS3 was accomplished with the work presented in this paper.
1 Giuseppe Formetta
University of Trento, 77 Mesiano St., Trento, 38123, Italy email: giuseppeform@libero.it
2. Methods
In this section we briefly present GEOtop and OMS3. The value of their integration is presented.
2.1. The GEOtop Model
GEOtop (Rigon et al., 2006) is a 3D, physically based, spatially distributed, finite-difference model which performs water and energy budgets. It models subsurface saturated and unsaturated flows, surface runoff, channel flows, and turbulent fluxes across the soil-atmosphere interface (e.g. latent and sensible heat fluxes).
As a terrain and grid based model GEOtop takes into account the complex topography of a watershed by using inputs such as a digital elevation model, aspect, local slope, and sky view factor maps when simulating each grid cell of the basin.
As a rainfall-runoff model it calculates the discharge at the outlet of the basin. Moreo-ver, it estimates the surface and subsurface water flows, the depth of the water table, and it solves the Richards equations in a fully 3D mode.
GEOtop as a land-surface model estimates the distribution of numerous
hydro-meteorological variables like soil moisture, surface temperature, radiative fluxes, and heat fluxes into the soil (Bertoldi et al., 2006).
Moreover, it is able to estimate snow depth, surface snow temperature, snow water equivalent, and snow density for each grid cell taking into account the snow metamor-phisms as presented in Dall’Amico et al. (2009).
2.2. The Object Modeling System OMS3
The Object Modeling System (v 3.0) is a Java based modeling framework (David et al., 2002). OMS3 promotes component based modeling by building complex modeling solu-tions based on scientific building blocks called components. Such models are “components assemblies” rather than complex monolithic systems. Each component is a self-contained software unit implemented with a well-defined purpose and interaction in mind. The sys-tem is well described in David et al. (2002) and several applications are shown in (Formet-ta et al., 2011; Formet(Formet-ta et al., 2012). OMS3 simulations (model applications with da(Formet-ta) can be executed either from the graphical interface (OMS3 console) or they can be linked together and invoked within the uDig console.
This study OMS3 is used with the GEOtop legacy code. GEOtop was developed using the native programming language C/C++ without using object oriented principles. Howev-er, the future goal is the subsequent substitution of the GEOtop monolithic code base with components.
2.3. GEOtop - OMS3 Integration Goals
There are valid reasons for integrating GEOtop into OMS3. The terrain-based structure of GEOtop model makes it seamlessly work with a GIS system. The current version 1.3.1 of uDig GIS (User friendly Desktop Internet GIS) with its embedded Spatial Toolbox is already based on OMS3. uDig runs under different operating systems (Windows, Mac OS/X, and Linux). It is internet oriented and is able to use geospatial standards such as Web Feature Services (WFS), Web Map Services (WMS), and Web Coverage Services (WCS). De-facto standards such as GeoRSS, KML, and tiles are also supported. With such underlying platform a GEOtop integration in OMS3 system allows to: i) compute the
GE-Otop input maps automatically using uDig ii) generate the GEGE-Otop output maps within the GIS and automatically visualise them, (iii) execute the model via the Spatial Toolbox, and (iv) display spatial model output as maps.
Furthermore, OMS3 provides already tools for automatic model parameter calibration of any OMS3 component or model. GEOtop itself does not offer any calibration features or tools. Two OMS3 calibration methods that were used in this study together with GEOtop are:
• LUCA (Hay et al., 2006) is a multiple-objective, stepwise, automated procedure based on the Shuffled Complex Evolution global search algorithm (Duan et al., 1992).
• Particle Swarm Optimization PSO (Kennedy et al., 1995) is a population based stochastic optimization technique which was inspired by social behavior of bird flocking. Potential PSO solutions called particles fly through the problem space by following the current optimum particles.
GEOtop can also exploit other sets of tools that are included in the NewAge (Formetta et al., 2011) models, like “goodness of fit” analysis (GOFs). Hence, the direct comparison of different modelling solutions inside the same framework or different kind of meteoro-logical interpolation algorithms such as ordinary kriging, detrended kriging, or inverse dis-tance weighted is feasible.
2.4. Results
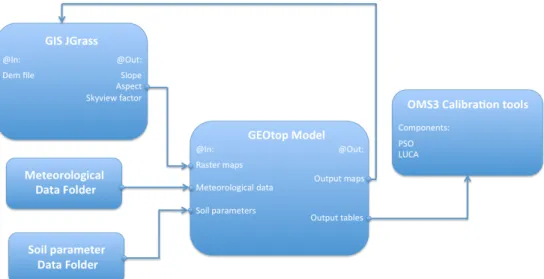
The GEOtop model was integrated into OMS3 by wrapping it as a whole black box in-to a component. Its original input/output structure was modified and the integration result is presented in figure 1. The raster input maps are computed by the uDig OMS3 based GIS. By using an OMS3 simulation script maps such as aspect, slope, and sky view factor are created as input for GEOtop. Figure 2 shows a screenshot of the OMSConsole and the GIS uDig.
Figure 1. GEOtop/OMS3 Integration
The GEOtop executable was wrapped into an OMS3 component and all platform spe-cific binaries for various operating systems were bundled with it. GEOtop parameter such
as soil water retention curve parameter, initial conditions, hydraulic and geotechnical soil characteristics of the soils were exposed as OMS3 Parameter by annotating the associated component fields with (@Role (Parameter)). This way they are accessible and getting managed by any OMS3 calibration algorithm, including PSO and LUCA.
After reading the meteorological input data such as rainfall, air temperature, and rela-tive humidity the GEOtop OMS3 component is executed using the OMS3Console. Finally, outputs maps of soil moisture and are generated directly into the uDig location.
Figure 2. The OMSConsole (left) and uDig GIS interface (right).
3. Application 3.1. Case Study
The first application of the integrated model involves the simulation of the soil mois-ture profile which is located in Sarno (Italy) within the upper Tuostolo basin. Peculiar for this area is the presence of loose pyroclastic soils that were produced by explosive phases of the Somma-Vesuvius’ volcanic activity. Pumiceous and ashy deposits can be attributed to at least five different eruptions. These materials have a relatively high hydraulic conduc-tivity although they are not saturated.
The vegetation in most of the study area can be classified as degraded chestnut and oak coppice.
In-situ and in laboratory tests were performed in order to determine the stratigraphy of the area (figure 3) and the hydraulic and geotechnical soil characteristics (table 1).
Figure 2. Soil Stratigraphy used for the application of GEOtop in the Toustolo basin.
Table 1. Hydraulic and geotechnical characteristics of the soils. ϑs [-] is the the saturated moisture content, ϑr [-] is residual moisture content and ks [m/s] is the saturated hydraulic conductivity Soil type ϑs [-] ϑr [-] ks [m/s] Top Soil Pumice 1631 A.D. Paleosoil 1 Pomice 472 A.D Paleosoil 2 0.55 0.82 0.61 0.68 0.61 0.14 0.23 0.18 0.005 0.18 3.21E-5 3.30E-4 4.00E-6 1.60E-4 4.00E-6
“Jetfill”-type tensiometers and TDR probes were installed in the Toustolo study area.
Real-time data acquisition and transmission systems were used to submit the collected da-ta. The instruments were placed at depths of 0.35 m of the topsoil and at 1.00 and 1.70 m of the two paleosols, respectively.
Moreover, a meteorological station was installed to collect rainfall and air temperature data in hourly intervals.
3.2. Model Setup
The following data was used for model input:
• a digital elevation model with five meters resolution of the area;
• six months of measured hourly rainfall and air temperature (December 2007 to May 2008);
• hydraulic and geotechnical characteristics of the soils.
GEOtop input maps (slope, aspect, sky view factor) were created with OMS3 simula-tion scripts using uDig geo-processing components.
A soil map was produced with the assumption of a uniform stratigraphy across the sub-basin. The resulting model was executed using the OMSConsole. Both, energy and water balance were computed. Model output maps of water content and soil water pressure were generated in uDig.
3.3. Results.
A total of six months of hourly model simulation were performed. The first 10 days were considered warm-up period for the model. In order to evaluate the model perfor-mance measured and modeled soil water pressure and soil water content were compared.
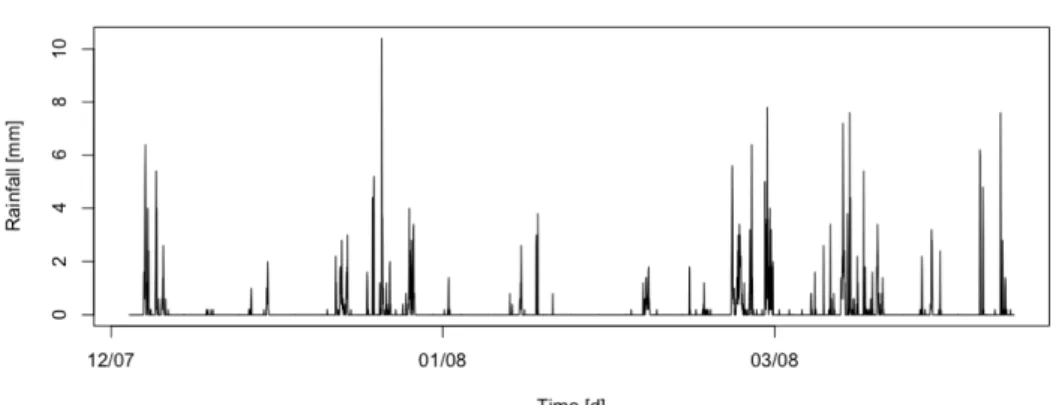
The results are presented in figure 4 and figure 5, respectively. Figure 4 shows at the top hourly rainfall and at the bottom the comparison between the measured (gray dots) and simulated (black solid line) suction estimated at 0.35 m depth. Figure 5 depicts the com-parison between the measured and simulated soil water content at the same depth.
For a quantitative assessment three goodness of fitness indices were computed: Index of agreement (IOA), Kling-Gupta Efficiency (KGE), and percentage bias (PBIAS).
Figure 4. Rainfall measurement [mm], at the top. Suction [KPa] simulation at 0.35 m depth from 01-12-2007 to 01-05-2008
An IOA (Willmott et al.,1985) equals to one means a perfect fit between simulated and measured data. One of the advantages in using IOA is its sensitivity to extreme values.
The PBIAS is the percentage bias. While positive values indicate an overestimation of the model negative values represent an underestimation. The PBIAS is also an indicator of the mass conservation in the model.
Figure 5. Rainfall measurement [mm], at the top. Soil moisture simulation at 0.35 m depth from 01-12-2007 to 01-05-2008: the black solid line is the simulated soil moisture and the gray dots are the meas-urements, at the bottom.
The Kling-Gupta efficiency (KGE) function (Gupta et al., 2009) tries to quantify three important aspects: (i) the correlation between simulated and observed values, (ii) the rela-tive variability in the simulated and observed values, and (iii) the bias error. All goodness of fit indices were computed by using the NewAge-V component (Formetta et al., 2011). The indices show: i) the percentage bias for the simulations of suction and soil moisture is lower than 5%. According to Marechal (2004) it indicates excellent model performance. Positive PBIAS values for both simulations indicate that the model tends to slightly over predict.
After the warm-up period the model is able to reproduce the measured suction and the soil moisture. Towards the end of the simulation period the peak values are somewhat un-derestimated. This is confirmed by lower KGE and IOA values with respect to the suction simulation.
Table 2. Goodness of fit indices between modeled and measured variables
Variables IOA KGE PBIAS
Soil moisture Suction 0.75 0.83 0.70 0.86 2.1 1.90
4. Conclusions
This paper presents the application of the fully distributed hydrological model GEOtop into OMS3 framework. The three main goals of the work were accomplished. The GIS uDig was used to facilitate input maps computation and output visualization for GEOtop. The GEOtop model was linked to OMS3 to utilize automatic calibration, sensitivity analy-sis, and meteorological interpolation tools. By porting the model into OMS3 yet another model was made available to the modeling library, adding GEOtop to other lumped and semi-distributed hydrological models such as PRMS or NewAge. A modeler may select the appropriate model according to his/her needs and the process to be simulated.
Finally, an application in a sub-basin of the Tuostolo basin is presented. Soil moisture and soil suctions are simulated in order to reproduce the measured values and verify the model. Qualitative and quantitative results show the capability of the model to capture the dynamics of measured variables. Peak values for soil moisture were slightly underestimat-ed. However, automatic calibration tools improved the model performance.
Acknowledgements. This research is supported by the Hydroalp and the Ambito/Settore Ambiente e Sicurezza (PON01_01503) project.
References
Abbott, M. B., et al. (1986): An introduction to the European Hydrological System—Systeme Hydrologique Europeen, SHE, 2: Structure of a physically-based, distributed modelling system, Journal of Hydrology 87.1 (1986): 61-77.
Bertoldi, G., Rigon R., and Over T.M. (2006): Impact of watershed geomorphic characteristics on the energy and water budgets. Journal of Hydrometeorology 7.3 (2006): 389-403.
Dall'Amico, M. (2009): Energy conservative algorithm for phase change in freezing unsaturated soils using the hydrological model GEOtop., EGU General Assembly Conference Abstracts. Vol. 11. 2009. David, O., Markstrom, S., Rojas, K., Ahuja, L., and Schneider, I. (2002): The Object Modeling System,
Ag-ricultural system models in field research and technology transfer, pp. 317–331, 2002
Duan, Q., Sorooshian S., and Gupta V(1992): Effective and efficient global optimization for conceptual rain-fall-runoff models. Water Resources Research 28.4 (1992): 1015-1031.
Formetta, G., R. Mantilla, Franceschi S., Antonello A., and Rigon R. (2011): The JGrass-Newage system for forecasting and managing the hydrological budgets at the basin scale: models of flow generation and propagation/routing. Geoscientific Model Development, 4(4): 943–955, 2011.
Formetta G., Rigon R., Chávez J. L. , and David, O. (2012): Modeling short wave solar radiation using the JGrass-NewAge System, Geosci. Model Dev. Discuss., 5, 4355-4393, 2012 www.geosci-model-dev-discuss.net/5/4355/2012/ doi:10.5194/gmdd-5-4355-2012, 2013.
Freeze, R. Allan, and R. L. Harlan (1969) : Blueprint for a physically-based, digitally-simulated hydrologic response model. Journal of Hydrology 9.3 (1969): 237-258.
Garrote, L. and Bras, R. L. (1995): A Distributed Model for Real-time Flood Forecasting using Digital Eleva-tion Models. Journal of Hydrology. 167: 279-306.
Gupta, H., Kling, H., Yilmaz, K., and Martinez, G. (2009): Decomposition of the mean squared error and NSE performance criteria: Implications for improving hydrological modelling, J. Hydrol., 377,80–91, 2009
Hay, L.E., G.H. Leavesley, M.P. Clark, S.L. Markstrom, R.J. Viger, and M. Umemoto (2006). Step-Wise, Multiple-Objective Calibration of a Hydrologic Model for a Snowmelt-Dominated Basin. Journal of the American Water Resources Association 42:877-890, 2006
Kennedy, J., and Eberhart R.(1995): Particle swarm optimization. Neural Networks, 1995. Proceedings., IEEE International Conference on. Vol. 4. IEEE, 1995.
Marechal, D. (2004): A soil-based approach to rainfall-runoff modelling in ungauged catchments for England and Wales, 2004.
Niu, Guo‐Yue, et al. An integrated modelling framework of catchment‐scale ecohydrological processes: 1. Model description and tests over an energy‐limited watershed. Ecohydrology (2013).
Paniconi, C., et al. (2003): Newtonian nudging for a Richards equation-based distributed hydrological model.
Advances in Water Resources 26.2 (2003): 161-178.
Rigon, R., Bertoldi, G., and. Over T.M. (2006) GEOtop: A distributed hydrological model with coupled wa-ter and energy budgets. Journal of Hydrometeorology 7.3 (2006): 371-388.
Wang, Lei, et al. (2009): Assessment of a distributed biosphere hydrological model against streamflow and MODIS land surface temperature in the upper Tone River Basin, Journal of Hydrology 377.1 (2009): 21-34.
Wigmosta, M., Vail, L. and Lettenmaier, D. (1994): A distributed hydrology-vegetation model for complex terrain. Water Resources Research 30(6):1665-1679
Willmott, C., Ackleson, S., Davis, R., Feddema, J., Klink, K., Legates, D., O’Donnell, J., and Rowe, C. (1985) : Statistics for the evaluation and comparison of models, J. Geophys. Res., 90, 8995–9005, 1985 Zehe E., and Blöschl G. (2004): Predictability of hydrologic response at the plot and catchment scales: Role

![Table 1. Hydraulic and geotechnical characteristics of the soils. ϑ s [-] is the the saturated moisture content, ϑr [-] is residual moisture content and ks [m/s] is the saturated hydraulic conductivity Soil type ϑ s [-] ϑ r [-] k s [m/s] Top Soi](https://thumb-eu.123doks.com/thumbv2/5dokorg/4343068.98899/5.918.188.730.547.709/hydraulic-geotechnical-characteristics-saturated-moisture-saturated-hydraulic-conductivity.webp)
![Figure 4. Rainfall measurement [mm], at the top. Suction [KPa] simulation at 0.35 m depth from 01-12- 01-12-2007 to 01-05-2008](https://thumb-eu.123doks.com/thumbv2/5dokorg/4343068.98899/6.918.163.715.447.906/figure-rainfall-measurement-mm-suction-kpa-simulation-depth.webp)