Trade Creation or Diversion?
An ASEAN Perspective
A Panel Gravity Model Approach
MASTER THESIS WITHIN: Economics NUMBER OF CREDITS: 30
PROGRAMME OF STUDY: Economic Analysis AUTHOR: Nithin Gopalakrishnan
i
Master Thesis in Economics
Title: Trade Creation or Diversion? An ASEAN Perspective Authors: Nithin Gopalakrishnan
Tutor: Johan Klaesson & Emma Lappi Date: 2020-05-18
Key terms: Bilateral trade, regional trade agreement, trade creation, trade diversion, ASEAN, AFTA
Abstract
The objective of this paper is to assess the bilateral exports from an origin to a destination, in the context of countries belonging to the Association of South-East Asian Nations (ASEAN), and whether or not the ASEAN Free Trade Agreement (AFTA) leads to trade creation or trade diversion, or both. To study this, a panel gravity model is employed with 135 countries, from 2000-2014, using a Poisson Pseudo-Maximum Likelihood method (PPML). To study the impact of AFTA on trade creation/diversion, a set of three dummy variables are used, denoting whether the origin country belongs to ASEAN, whether the destination country belongs to ASEAN and finally, whether both origin and the destination countries belong to ASEAN. Along with AFTA, five other Regional Trade Agreements (RTA) are also taken into account. The main finding of this paper is that there is no pure trade creation nor pure trade diversion due to AFTA, but rather a significant export trade creation, that is, ASEAN’s exports to the rest of the world is positive and significant. Future policy implications could include measures to strengthen the regional economic cooperation amongst the members of ASEAN.
ii
Table of Contents
1. Introduction ... 1
2. Background ... 4
2.1. RTA, Intra- and Extra- Trade Patterns... 5
3. Theory and Hypothesis ... 9
3.1. International Trade Theory ... 9
3.1.1. From the beginning to the 19th Century ... 10
3.1.2. The 20th Century: Customs Union Issue and H-O Theory ... 11
3.1.3. Post Vinerian 20th Century: Gravity Model and New Trade Theory ... 12
3.1.4. The Empirical Gravity Model ... 14
3.2. Previous Literature ... 16
4. Data and Methodology ... 19
4.1. Variables ... 20
4.2. Methodology ... 24
5. Results and Discussions ... 28
5.1. AFTA and other RTA Estimates ... 28
5.2. The Traditional Gravity Estimates ... 33
6. Conclusion ... 36
References List... 37
iii
Figures
Figure 1 - ASEAN’s top export partners in 2018 ... 5
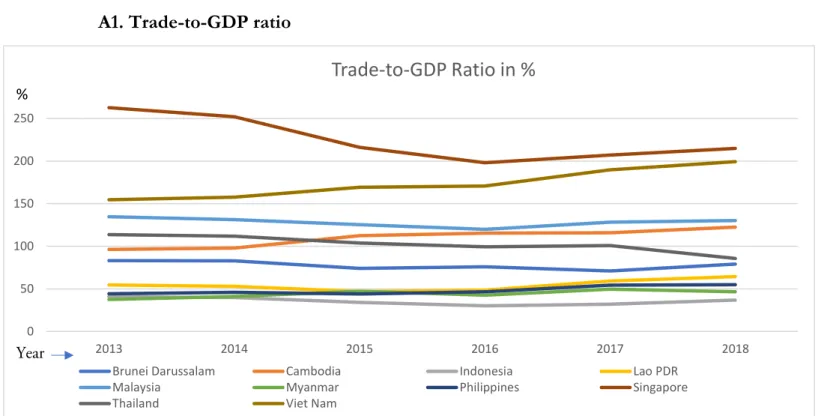
Figure 2 - Trade-to-GDP ratios of ASEAN members (in %) ... 43
Figure 3 – Relationship between trade and GDP of origin and destination... 45
Figure 4 – Relationship between trade and Geographical Proximity (Distance)... 46
Tables
Table 1 - Intraregional trade concentration index, 2000-2018 ... 4Table 2 - List of variables used in the gravity model, and their sources and brief description .... 16
Table 3 - Descriptive Statistics of the time-variant variables ... 19
Table 4 - Regression results... 23
Table 5 - Shifts in ASEAN’s top 10 export destinations…... 40
Table 6 - List of countries used in the sample, along with which FTA they belong to ... 41
Table 7 - Correlation matrix of the variables ... 42
1
1. Introduction
This section covers the background of the study, and briefly touches upon the purpose of the study. The background includes the reasons for studying international trade patterns in the light of Regional Trade Agreements (RTA), and narrows the study to the Association of South East Asian Nations (ASEAN) trade bloc – AFTA (ASEAN Free Trade Agreement). This is followed by the description of the purpose of the research, and what the intended findings are.
An important international trade theorist, Jacob Viner, in his 1950 book The Customs Union Issue first used the words “trade diversion (creation)” (TD/TC), about the impact of preferential trade agreements in light of post-world war 2 international politics1
. Viner’s (1950) book laid the ground works of the contemporary debate over the effect of trade creation and trade diversion due to regional trade agreements (RTA) such as the European Union, North American Free Trade Agreement (NAFTA) and the Asia-Pacific Trade Agreement (APTA). This paper will compare and analyse in brief the studies that were conducted on the post-establishment impact of RTAs. Regional trade agreements (RTAs) are formed with the intention of expanding economic cooperation between different countries, or in a geographical region, through eliminating barriers to trade. Trading agreements enable countries to substitute local production of goods that they do not have a comparative advantage with, with imports (Ricardo, 1817). This enabling is boosted by RTAs in the sense that the additional tariffs and non-tariff barriers to trade that are associated with a trading transaction is eliminated, and ensures smooth flow of goods into the trading countries in an agreement (Medvedev, 2006). Coming closer in history, RTAs enable countries to exploit the varieties of manufactured goods from different countries. Regional Trade Agreements support the “love of variety” effect that is associated with a monopolistically competitive economy (Krugman, 1979).
Several authors have studied a post-establishment impact of an RTA, and how it has contributed to increased FDI and economic growth (Vamvakidis, 1998; Hur & Park, 2012; Liu, 2015). In the international trade context, several authors have used the gravity model in order to study the
post-1 Note that the first Customs Union in the world was formed in 1910 in Southern Africa. This explains why
2 establishment impact of RTAs on bilateral trade itself (Endoh, 1999; Soloaga & Winters, 2001; Egger, 2002; Carrere, 2006; Kien, 2009). These studies are about the trade creation and trade diversion effects of establishment of an RTA. Trade creation translates to an increased welfare for both the members of the RTA and the rest of the world. Trade diversion however, is an increased welfare amongst the member countries of the RTA, often at the expense of the rest of the world. There have been very few numbers of studies (Carrere, 2006; Kien, 2009) on the trade creation/diversion effects of AFTA in a more recent time frame.
ASEAN as a region has a geopolitical and strategic importance. It contains one of the most important hub (Singapore) through which a large share of world trade passes. ASEAN consists of diverse economies in terms of development, and this directly characterizes which region each member trades the most with. The developed ASEAN members trade more with the EU, USA, Japan, etc. and the least developed ASEAN members (Cambodia, Laos, Myanmar, etc.) trade with China, and the geopolitical importance of China has started to dictate trade flows in and out of ASEAN. ASEAN is a fast-growing economy, and in the coming decades, is expected to be the 4th
largest economy (by 2030) (United Nations, 2020). In 2013, the ASEAN-5 (Indonesia, Malaysia, Singapore, Philippines and Thailand) attracted more FDI ($128 billion) than China ($117 billion) (IMF DoTS, 2020). Chinese companies have since been relocating production facilities in ASEAN countries. China, as the primary competitor of the United States of America in terms of foreign geopolitical and economic importance, sees ASEAN as its biggest enabler of trade, as a regional partner, and economic stronghold neighbour.
Chart 1 and Table 5 in Appendix A2 show that China is the biggest trading partner for ASEAN in 2018. This is why ASEAN plays an important role in world trade, as a growing economic region. This study aims to study ASEAN’s trade, and whether or not ASEAN Free Trade Agreement leads to trade creation or diversion. As mentioned above, the growing ASEAN importance in Asia and the world is expected to translate into increase in welfare for the members of ASEAN, as well as the rest of the world. This study however, will not examine who in “rest of the world” this increase in “welfare” attributes to.
3 Table 1 shows the intensity of intraregional trade between the members of ASEAN, and other RTAs. With ASEAN’s lingering pattern of intraregional trade in the most recent decade, it is interesting to see the effects of AFTA on a more recent time period, for a panel of countries. This study adopts a panel RTA analysis with 135 countries from the time period of 2000 to 2014, with a spotlight on the Asia-Pacific Free Trade Agreement (AFTA).
Thereby, the objective of this paper is to assess whether AFTA has led to trade creation (TC) or trade diversion (TD), or both, in terms of exports. This could be pure trade creation, pure trade diversion or both creation and diversion. With the aim in mind, a gravity equation is estimated using the PPML method in order to find out the relative importance and influence of regional trade agreements (preferential trade agreements) in explaining bilateral trade, along with the traditional gravity equation determinants such as the origin (exporter) and destination (importer) incomes, geographical proximities, origin and destination per capita incomes, common borders and languages, etc. The final finding is the expected trade creation (TC) or trade diversion (TD) due to AFTA. There is pure trade creation if the intra-AFTA trade and the AFTA’s exports to the rest of the world are positive and significant. There is pure trade diversion when the intra-AFTA trade is positive and significant, and AFTA exports to the rest of the world is negative significant; and this negative value is greater than the positive intra-AFTA estimate. There is only export trade creation (diversion), if the intra-AFTA trade is not significantly different from zero, and there is an increase (decrease) in AFTA exports to the rest of the world.
The following sections are as follows: introduction – background, free trade agreements and its importance, theoretical anchoring – international trade theories and the connection to the gravity model, previous literature and the gravity model – summaries of literature on regional trade agreements and determinants of trade flows, “theoretical” and econometric foundations of the gravity model, data and methodology – data and variables, motivating the methodology and the study-specific gravity equation, results and discussions -, and conclusions.
4
2. Background
One of the most important international trade blocs and economic integration measures in the continent of Asia, is the formation of ASEAN. Since the beginning of the establishment of the ASEAN Free Trade Area (AFTA) in 1992 in Singapore with the aim to promote local manufacturing and trade in the ASEAN countries (the ASEAN group consisted of 6 members when AFTA was signed – Singapore, Indonesia, Malaysia, Brunei, Philippines and Thailand), the members of ASEAN agreed to eliminate tariffs and non-tariff barriers to bilateral trade. The primary goal of AFTA was to increase the region’s competitive edge. By 1999, all the 10 countries of today’s ASEAN were part of AFTA (Vietnam joined in 1995, Myanmar and Laos in 1997, and Cambodia in 1999)2
. Perhaps the most interesting feature of the ASEAN group is that there is no “leader”, and the decision-making roles and powers are evenly split among the members, making it a resilient economic cooperation (ASEAN Stats, 2020). In today’s globalized world, a common feature among developed (high-income) economies is that the smaller the country is, the more it indulges in external trade. Singapore and Malaysia are good examples.
By trade volume of blocs in the world, ASEAN’s total trade in 2017 was worth $2.57 trillion (ASEAN Stats, 2020), only behind NAFTA ($22 trillion), European Union ($16 trillion) and the Southern Common Market in South America (MERCOSUR3
) ($2.9 trillion), making ASEAN the 4th
largest trading bloc in the world (IMF-DoTS, 2020)4
. ASEAN has also led the formation of the forum APT (ASEAN Plus Three) which includes all ASEAN members, China, Japan and Republic of Korea. This integrated effort of economic cooperation strengthened especially post the Asian Financial Crisis (1997 – 1999).
The gravity model, which uses the ideology that the importer and exporter country trade more with each other based positively on their economic sizes and negatively on their geographic distance
2 Brunei Darussalam and Viet Nam are the official names respectively, but referred as Brunei & Vietnam in this
paper. Brunei is the only country with a sultanate, and is also one of the safest South East Asian countries, thanks to heavy infrastructural spending due to the preferential trade agreement with ASEAN members (Kien, 2009).
3 MERCOSUR, NAFTA & APEC – Southern Common Market (South American trade bloc), North American
Free Trade Agreement and the Asia-Pacific Economic Cooperation, respectively.
4 IMF’s Direction of Trade Statistics is among the most comprehensive databases for bilateral trade. Other data
5 (Tinbergen, 1962), can also be used to assess the increase or decrease in bilateral trade based on formation of an RTA (Egger, 2002). Several studies have been done as an ex-post assessment of trade creation/diversion effects of RTAs (Frankel, 1997; Soloaga & Winters, 2001; Carrere, 2006). Carrere (2006) summarizes the impact of an RTA on the bilateral trade flows as follows: trade creation due to an RTA must increase intra-regional (example, intra-AFTA) trade and the imports from the rest of the world remain the same; and under trade diversion, the increase in intra-regional trade is offset by a larger decrease in imports from the rest of the world. Celine Carrere (2006) advocates the appropriate introduction of dummy variables in the gravity model in order to account for the effects of trade creation and diversion, which will be covered later in this study.
2.1. RTA, Intra- and Extra- Trade Patterns
Table 1 shows the intraregional trade concentration index of select RTAs, over time. The meaning of the index ratio is given below.
Table 1: Intraregional trade concentration index, 2000-2018
Source: Author’s Calculations based on data derived from UNCTAD5
This index shows a more meaningful version of just the share of each region’s intra-trade with respect to the region’s total trade. The intraregional trade concentration index is calculated as the
5 United Nations Conference on Trade and Development (UNCTAD) data for each region’s intraregional
imports and exports are added to get total intra-trade, and the basic share of intra-regional trade is derived using total trade of region; this data is then combined with the regional trade’s share of total world’s trade. The latter becomes the denominator for the intensity/concentration index. Concentration of each region’s intra-trade = (𝑥𝑖𝑡/𝑋𝑖𝑡)/(
𝑅𝑡
𝑊𝑡), where 𝑥𝑖𝑡 is the intraregional trade of RTA, 𝑋𝑖𝑡 is the total trade of RTA; 𝑅𝑡
𝑊𝑡 is the share of the
RTA’s trade with respect to total world trade.
Year ---> 2000 2002 2004 2006 2008 2010 2012 2014 2016 2018 Asia-Pacific Trade Agreement (APTA) 1.09 1.09 1.05 0.92 0.90 0.82 0.72 0.66 0.65 0.70
Association of Southeast Asian Nations 3.44 3.62 3.83 3.78 4.09 3.55 3.74 3.69 3.28 3.17
ASEAN Plus Three 1.63 1.70 1.64 1.51 1.53 1.40 1.43 1.36 1.26 1.32
Andean Community 19.50 24.60 20.52 14.76 12.95 12.15 9.33 10.73 13.69 11.91 Common Market for Southern and Eastern
Africa (COMESA) 11.05 13.13 9.09 8.31 7.12 8.39 9.57 16.35 18.35 17.19 European Free Trade Agreement (EFTA) 0.27 0.24 0.24 0.25 0.33 0.29 0.24 0.24 0.20 0.22
European Union 1.74 1.57 1.61 1.73 1.73 1.84 1.88 1.81 1.74 1.77
Mercado Común del Sur (MERCOSUR) 9.76 6.28 5.99 6.09 5.92 6.45 5.66 6.48 7.35 6.74 North American Free Trade Agreement 2.94 3.30 3.92 3.92 3.93 3.80 3.79 3.83 3.64 3.75
South Asian Association for Regional
6 ratio of each region’s intra-trade as a share of its total trade, with respect to that region’s share of total world trade. If a member of an RTA has a propensity to trade with its fellow member the same as it does with any non-member, the ratio is close to 1. If there is higher propensity to trade with its own member than with a non-member, the ratio exceeds 1 and exhibits higher values (UNCTAD, 2020). This ratio is better in explaining intraregional trade than just the share of intra-trade with whole intra-trade of a region in a crucial way: the simple share of intra-intra-trade may be skewed by the number of members in an RTA, as well as the size of the trading member in an RTA. The intraregional trade concentration however, shows the actual intensity of intra-trade within a region, adjusted for the whole region’s size in international trade.
Table 1 is relevant to this study because, it shows the trend of intraregional trade concentration, and tells us if an RTA is intra- trade oriented or extra- trade oriented, and this should reflect in the regression results later on, with the dummy variable indicating both the origin and the destination countries belonging to the RTA. If the intraregional trade concentration index is greater than 1, indicating a higher intensity for the members of an RTA to trade among themselves, the dummy variable indicating both the origin and the destination belonging in the RTA will be positive and significant. For example, the ratio for COMESA in 2014 is 16.35, indicating an intra-overtrading among the members of COMESA, and this reflects in the regression results through the dummy variable, where both the origin and destination belonging to COMESA increases trade by 182% than otherwise, and the COMESA’s exports to the rest of the world show a negative significant estimate. The same reflection can be expected for all the other RTAs used in the regression analysis as well, including AFTA, for the ASEAN countries.
The Asia-Pacific Trade Agreement (APTA) and the European Free Trade Agreement (EFTA) are the only RTAs with concentration ratios lower than 1. The Andean Community and the Common Market for Eastern and Southern Africa (COMESA) exhibit extremely high values, indicating an “intense” intraregional trading relationship. ASEAN exhibits a moderately intense value. These values are attributed to several factors influencing the intraregional trade intensities. Similar income, for example, is an important factor. The higher the income of an RTA, the lesser they are inclined to have higher intra- intensities. Similar incomes call for similar demand in the type of
7 goods, for example, COMESA (Afesorgbor, 2016) and hence higher intraregional trade. This is comparable with Krugman’s (1979) new trade theory of higher trade between similar income economies, due to translated similar demand for goods. The varying intensity of ASEAN’s intraregional trade is of particular interest to this paper. Even if ASEAN has an index value of 3.69, which is greater than 1, the time trend shows no increase or decrease.
Another disadvantage of the table is that, it does not provide the same concentration index for extra-trade. The reason for not including extra-regional concentration index is due to the fact that the study is about trade creation and diversion based on post-establishment of an RTA, and the increase in intraregional trade is of primary importance, than increase in the members of the RTA’s exports/imports to the rest of the world. Contextually, in light of recent efforts to seal a trade pact named the “Regional Comprehensive Economic Partnership” (RCEP) which is set to consist of all 10 ASEAN members, Australia, China, India, Japan, New Zealand and South Korea. The gravity model is able to analyse the “anticipation effect” (Carrere, 2006) of a trade pact using historical trade patterns. The “anticipation effect” is the fact that formation of some RTAs can be predicted based on existing trade patterns and volume of trade. ASEAN as a whole merging as RCEP could be a result of existing high trade with the other 5 members for ASEAN, and vice versa. There is pure trade diversion when and if, there is an increase in intra-regional trade, but it is entirely offset by a decrease in exports to the rest of the world. There is trade creation, if there is an increase in intraregional exports as well as an unchanged or increased export to rest of the world. It is worth to note that with ASEAN, the incomes and demands from outside ASEAN have a big impact on ASEAN’s exports (example, ASEAN plus Three – China, Japan and South Korea) (Elliott & Ikemoto, 2004). This is a possible indication to the insignificant intra-regional trade variable coefficient taken in the analysis.
Formation of an RTA may be due to existing high or low levels of trade between a group of countries. Countries with political similarities enter into an RTA and thereby eliminate tariffs amongst them, promoting intra-trade, for example. The AFTA today shares 6.4% of the total world’s trade (ASEAN, 2020). Baldwin et al. (2011) predicted that the increase in the number of RTAs in the world in the future will lead to multilateral liberalization, and hence further
8 fragmentation of production in all the countries. One other motivation for testing whether intra-trade in ASEAN due to AFTA has been significant or not, could stem from findings of Baldwin & Taglioni (2006) and Manchin & Pelkmans-Balaoing (2007). They find that since Asia’s manufacturing sector was led by trade of parts and components in the 2000s (it is still the highest exported good of Singapore – 2018), they found using sectoral disaggregated data, that the intra-regional trade among the members of ASEAN was largely led by parts and components trade, with further industrialization in the ASEAN countries. However, the administrative cost of facilitating a transaction amongst the members is very high in ASEAN (Baldwin & Taglioni, 2006), and hence the cost of complying to administrative rules make underutilising the RTA more preferable. This, however will not be the focus of this study, as the focus is more on economic patterns of regional trade agreements.
9
3. Theory and Hypothesis
This section is devoted to a groundwork understanding of why two economic entities trade with each other. This section covers how the theories of international trade have progressed since the beginning of economic literature, and how the empirical gravity equation sums up the trade theories. Among the two sections in this chapter, the first section covers the evolution of the international trade theory through time. The chapter concludes with the previous research made regarding the gravity model and Regional Trade Agreements, and subsequently, providing motivation for the research hypothesis.
3.1. International Trade Theory
International trade theory’s evolution is not so complicated to be explained meticulously, but it isn’t simple either. But no matter what it is, it is interesting. Post mercantilism came the classical international trade theory, by Adam Smith, in 1776, and David Ricardo, in 1817 – with absolute and comparative advantage theories, respectively. John Stuart Mill in 1848 was the next in line to make another breakthrough, by understanding the demand side of international trade, and how it is possible for gains from trade to be unbalanced. Then came the proposal that trade is based on factor endowments, in 1919, by Eli Heckscher, and further developed by his student Bertil Ohlin in 1933. Assuming an economy is more labour intensive than capital intensive, that economy would export only those goods which are labour intensive. Perhaps the key trade theorist pertaining to this study, is Jacob Viner. Viner in his 1950s book Customs Union Issue first discussed the benefits of free trade agreements post world war 2, in terms of welfare for the trading economies. Going by the timeline, the gravity model was proposed in 1962 by Jan Tinbergen, as an empirical method to test international trade flows and the determinants of it. A new trade theory, aiding this successful empirical invention is the New Trade Theory, by Paul Krugman in 1979. Similar income economies trade more with each other, as well as facilitating intra-industry trade, due to monopolistic competition. This seminal work is still empirically valid, and thus began the rise of modern geographical economics. The gravity model is still empirically successful in explaining bilateral trade flows.
10 3.1.1. From the beginning to the 19th Century
The basis for international trade theory has been existing since the times of proto-industrialization period (16th to 18th
century), when mercantilism was prominent. Using protectionism, an economy must acquire wealth through exports, which must be larger than the imports. The first classical development regarding the international trade theory came from the book The Wealth of Nations, by Adam Smith (1776), who argues that increase in the output can be possible through division of labour and specialization, and international trade was one of the special cases of the specialization. A country, in a larger global setting with scarce resources and unlimited demand, would produce only that product which can be produced with the lowest absolute cost. These goods would then be traded with other countries for a product with lowest absolute cost to them, and so on (Blonigen & Wilson, 2013). Relative cost of production is the next major development in this theory given by David Ricardo in 1817. Contrary to mercantilism, where international trade is a zero-sum game, and the only way a nation’s welfare is gained, is at the loss of another’s, Ricardo’s (1817) comparative advantage theory gave that two countries can engage in mutually beneficial trade with each other.
The comparative advantage model also introduced the concept of the direction of trade – who exports and who imports, and what do they export/import. In his two-country, two-goods theory, the country with lower opportunity cost of production of a good, relative to the other country, is the country with comparative advantage of production of the said good. The comparative advantage theory has now been extended in its usage to a multi-product trade theory as well as multi-product and multi-county trade and production theory (Dornbusch, Fisher & Samuelson, 1977; Bernard et al., 2003). Once it was established, by Adam Smith in his absolute advantage theory, that discouraging imports and promoting exports, like under the mercantilist ideology, is not the most optimal solution for welfare in an economy, Ricardo’s (1817) comparative advantage models paved the way for many extensions, that would develop and take further the trade and production theories. The first of demand-based trade theories came from John Stuart Mill. Mill (1848) stated that it is possible for the gains from trade to be in favour of one country more than the other. Mill (1848) stated that the terms of trade between two countries will depend on the
11 reciprocal demand for the goods considered, in their exchange ratio. So, these terms could change based on the changes in the intensity of demand from each country, and any potential barriers to trade. Mill’s theory diverted from Smith and Ricardo’s theories, in terms of international trade being a positive-sum game, which diverted from the mercantilism theory that trade is a zero-sum game. In Mill’s theory, international trade can be a fixed-sum-game, where the gains from trade can be divided in favour of one country, in a two-country trade’s exchange ratio.
3.1.2. The 20th century: The Customs Union Issue and the H-O theory
The terms trade creation and trade diversion are closely associated to Jacob Viner (1950) in his seminal book, The Customs Union Issue, in which he summarizes the welfare effects of new members joining a customs union/trade agreement and non-members of the union. This effect is particularly well seen doing a pre- and post- analysis of trade and welfare for a new member, and comparing those effects with a non-member. Trade creation and diversion is studied using comparative advantage (Ricardo, 1817). A country with comparative advantage over a product, over other countries, may still suffer welfare losses due to a union formed by some of the inefficient producers. This is due to that fact that any previous tariffs, are now reduced amongst the members, and the efficient producer’s goods are no longer demanded. This is called trade diversion. Yeats (1998) found in his study about MERCOSUR that the growth in intraregional trade in MERCOSUR was for those products for which the members did not have a comparative advantage. Moreover, the discriminatory tariffs of MERCOSUR against non-members further proves trade diversion within the RTA.
Trade creation due to an RTA, results in an increase in welfare for the members of the RTA as well as the rest of the world, where trade diversion results in an increase in the welfare of the members of the RTA, but a reduction in the welfare of the rest of the world. Pure trade creation, is when the inefficient producer in the union eliminates the tariffs to import a product from a more efficient producer, thereby decreasing the average price of the product for its citizens, and thereby increasing demand and consumption. Trade creation is a long-term welfare result of formation of a union, for its members. However, many studies including RTAs as an explanation to bilateral trade omit
12 the effects of trade creation and trade diversion, and focus only on the intra-trade levels of members belonging to an RTA (Batra, 2006). Moving further on the theoretical foundation of international trade, the Heckscher-Ohlin trade theory would now dominate it for decades to come.
The Heckscher-Ohlin trade theory, which would become a pathbreaking international trade theory, which states that two countries will trade with each other based on their relative factor endowments. Ohlin (1967) stated that given labour and capital, a country with relatively higher endowment in capital must produce capital-intensive goods and then export them, in order to gain that said comparative advantage in the Ricardo model. Ohlin’s professor, Heckscher (1919), developed the factor endowments theory initially, which was then revised by his student. The H-O theory is still considered to be empirically accurate, apart from the so-called “undermining” research by Leontief (1953), who proved empirically, that the United States, being the most capital abundant country, exported more labour-intensive goods, contradicting the H-O model. Leamer (1980), however, gave an answer to the “Leontief Paradox”, by taking a multi-sector model of the same analysis as Leontief (1953) using a model developed by Vanek (1968), and proved that the factor-endowments theory worked. The H-O model, still remains to be empirically accurate and valid, in explaining the causes of comparative advantage (Maneschi, 1998). One noteworthy extension to the H-O model is perhaps the Stolper-Samuelson model. Stolper & Samuelson (1941) and Samuelson (1948) took further Ohlin’s assertion that free trade will lead to factor price equalization. This simply put, means that the trade in that good for which the resource is abundant, will realize an increase in income, due to the increased price of the product, and conversely, the resources for the product with the comparative disadvantage, will realize losses. So, in the long-run, regardless of industry, there will be losses to some people in the domestic economy (Samuelson, 1948).
3.1.3. Post Vinerian 20th Century: Gravity Model and New Trade Theory
Post the findings by Leamer (1980), there has only been little advancement in the proof of existence of the factor endowments theory in empirical studies (Trefler, 1995). Parallelly in this time period, the solution to international trade in an empirical approach would be developed: the gravity
13 equation, proposed by Tinbergen (1962). The gravity equation stated that international trade between two countries are positively determined by their economic sizes, and inversely related to their geographical distance. The bigger and closer the economies are, the higher they trade with each other. The issue for trade scholars in time periods decades beyond the introduction of the gravity equation, was that there was no theoretical linkage to the gravity equation (Blonigen & Wilson, 2013). The next big development in the trade theory is the new trade theory. Researchers found in 1980s, that most of the world trade is limited to developed countries, and moreover, developed countries with similar factor endowments: intra-industry trade. This is the basis for Paul Krugman’s (1979) new trade theory. The two main features of Krugman’s theory are that the global competition setting is monopolistic, and that there exists constant elasticity of substitution (CES). This is the basis of the “love of variety” effect, where the production and trade of monopolistically competitive countries trade in a single-good setting, different varieties of the same good. The love of variety effect explained exactly what the comparative advantage models could not: international trade between similar-income countries with intra-industry trade dominating. The gravity model’s theoretical foundations by now, have been established through the works of Anderson (1979), Krugman (1979), Helpman & Krugman (1985) and Bergstrand (1985; 1990). To explain the basic independent variables in the gravity model, the origin and destination countries’ GDPs explain the production & absorption capacities respectively, and the geographical distance represents the transport costs associated with a bilateral transaction. The basic theoretical model proposed by Anderson (1979) based on expenditure systems provided a base for further economists to confirm the theoretical validity of the gravity model. The limitation for Anderson’s (1979) basic structure is that the product differentiation was limited to the number of countries in a hypothetical sample. Krugman (1979), Helpman & Krugman (1985) relax this assumption by introducing the gravity equation to monopolistic competition. They used the framework of Dixit & Stiglitz (1977) to provide a basis for international trade in a monopolistic competition6
, and
6 The gravity model in the past has been tested for other market structures as well. Deardorff (1998) derived a
gravity equation from perfect competition structure, Feenstra et al. (1998) derived a gravity equation from a reciprocal dumping model of trade with homogeneity of goods. The monopolistic competition and increasing returns to scale structure however, is necessary to explain trade in industrialized economies (Evenett & Keller,
14 with increasing returns to scale. The amount of trade will now depend on the size of two economies (Tinbergen, 1962) in a trading transaction, and endogenously determined by production costs, and the demand for variety and of course, factor endowments (Heckscher, 1919; Ohlin, 1967). This is where Bergstrand (1989) developed the gravity model to explain the new trade theory. The gravity model explained the new trade theory better than the Ricardian comparative advantage models. Deardorff (1998) however, attempted to explain the comparative advantage models using the gravity-based empirical specification and found out that it can be specified. In this sense, these are the theoretical foundations of the gravity model. The gravity model of international trade started as an econometric method, and with successful empirical power, researchers successfully tied it to trade theories as well (Anderson, 1979; Bergstrand, 1985). In the most recent decades, researchers have been forced to look back at the comparative advantage models (Blonigen & Wilson, 2013), since there is a growing tendency for firms in developed countries to exploit the low wages by so-called “offshoring”. Offshoring firms belonging to developed countries, use the low wage situation in the less-developed countries for unskilled tasks (Bernard, Jensen & Schott, 2006; Hummels et al., 2011). The most recent literature focuses on the effects of intensive margins and extensive margins. Intensive margins are when there are changes in trade due to changes in the intensity of an existing trade connection (formation of a new FTA), and an extensive margin is the change in trade due to making new trade connections (Hummels & Klenow, 2005).
3.1.4. The Empirical Gravity Model
The gravity model can be easily used to test the impact of trade creation or trade diversion. Zipf (1946), in his chapter “the P1P2/D hypothesis”, first proposed this idea for intercity movement of people in the United States, where P1 and P2 were populations of two regions, and D being the shortest possible distance between them. Tinbergen (1962) and Poyhonen (1963) introduced this in terms of international trade: where the volume of trade (exports or imports) will depend on the product of the economic sizes of the two countries as a ratio of the distance between the two
1998). After the theoretical establishments of the gravity model, researchers have now moved on to empirical assessments of global trade events.
15 countries. Greater distance implies greater transport costs, and thus lower volume of bilateral trade. The traditional gravity equation can be simply put:
𝑋𝑖𝑗 = 𝛼0𝑌𝑖𝑌𝑗
𝐷𝑖𝑗 ; 𝛼0 is the constant term, the two countries’ incomes/GDP are represented by 𝑌𝑖
and 𝑌𝑗 for i and j respectively, and 𝐷𝑖𝑗 being the distance between them. 𝑋𝑖𝑗 is the volume of trade
between i and j, or trade flow from i to j (see Appendix B1). More than the income sizes and the distances alone, Bergstrand (1990), Matyas (1997) and Anderson and van Wincoop (2003) have found several factors affecting bilateral trade and thus, kept refining the gravity equation’s “standard” structure. The inclusion of per capita incomes along with GDP (Bergstrand, 1985) was among the earliest appendages. Anderson and van Wincoop (2003) bring in the theory of product specialization into the gravity equation, along with the idea of “multilateral resistance terms” (MRTs) such as the remoteness index, affecting the trade flow between two countries. Multilateral Resistance Terms (MRTs) in a gravity equation, can be common language dummies, common religion dummies, political corruption indices or most famously, membership in the relevant multilateral trade agreement, etc. Anderson and van Wincoop (2003) stated that excluding MRTs which are positively associated with trade costs between two countries that affect trade will lead to mis/incomplete interpretation of bilateral trade.
Viner (1950) proposed not a trade theory, but more of an idea. The implications of the formation of a regional trade agreement does have theoretical linkages to it. The formation of an RTA for example, can give country A the boost it requires to engage in trade with another country, B, belonging to the RTA, in a product for which country A has lesser comparative advantage over. This leaves country C, an existing trading partner of country A in that product, out of the picture, leading to lesser trade for country A with country C, and more with B. This is an example of trade diversion. The members of the RTA (countries A and B) now trade more with each other at the expense of the rest of the world (country C).
Ricardo’s (1817) comparative advantage theories can indeed explain trade creation or diversion in light of formation of an RTA. Another theoretical linkage to the formation of an RTA can be derived from the factor endowments theory. Right from the formation of an RTA, to its
16 implications on trade creation and diversion, factor endowments could be key in explaining the mechanisms behind the RTA formation. Countries that form an RTA together may be endowed with similar factor proportions, and thus boosting trade amongst themselves (for example, the Common Market for Southern and Eastern Africa, or COMESA). The case of NAFTA, with USA, Canada and Mexico, show that the establishment of NAFTA has led to increased industrialization, and more FDI and infrastructural developments in Mexico, the least capital intensive economy in NAFTA, and leads to factor price equalization, as in Ricardo (1817) and Heckscher (1919) & Ohlin (1967) (Fukao, Ishido & Ito, 2003; Tang, 2005).
Trade creation and diversion due to the formation of an RTA, can be explained in the new trade theory, given by Krugman (1979) as well. In a monopolistic competition market structure, the choice of countries forming an RTA may be dictated by similar incomes, and demand structures, as well as high intra-industry trade, characterized by the “love of variety” effect. ASEAN countries for example, saw a surge in trade of parts of components within the region after the formation of AFTA, led by Singapore and Malaysia.
3.2. Previous Literature
Despite criticism in the beginning times regarding the theory as just a theory, gravity models gained widespread attention and popularity in no time. It became the most chosen econometric method to test for bilateral trade, immigration, trade flows of different commodities, and trade under different circumstances, etc. (Deardorff, 1984). Frankel et al. (1997), acclaimed the success of the gravity models to the fact that economists have finally understood that countries are geographical, physical entities on the globe. Aitken (1973) and Endoh (1999) are one of the first researchers to study the trade liberalization effects of RTAs on members and non-members. Considering the study relevant to this paper, regional trade agreements are an important aspect studied throughout history, in the gravity models. Ex-post assessment of Regional Trade Agreements can be captured in a gravity equation using the correct specification of dummy variables (Carrere, 2006). Egger (2002), Soloaga & Winters (2001), Carrere (2006) have contributed to the correct specification dummy variables to capture the full effect of RTAs in the gravity model. Kien (2009) studies the
17 effects of ASEAN in an earlier time period, and found that the intraregional trade is positive and significant for ASEAN. The time period Kien considers is 1988-2002. Trade creation and diversion effects has been in study for a long time. Considering recent history, Endoh (1999) studied the effects of TC and TD for 35 years from 1960-1994 for different European RTAs using OLS in panel data. Breuss & Egger (1999) study the “trade potentials”7
for East and Western Europe using cross sectional data. Matyas (1997) and Egger (2002) has proven that estimating the effects of RTAs using a panel data is more appropriate. Studies similar to trade creation and diversion include the effect of a country’s entry into a political or trade agreement on trade, for example, Greece’s entry into the EU (Kepaptsoglou, Karlaftis & Tsamboulas, 2010).
One of the inspirational papers were written by Rose, Lockwood & Quah (2000), considering all the RTAs and their effects on bilateral trade, using data for 186 countries. A common feature among all the previous studies on TC and TD are the inclusion of other RTAs other than the considered, in order to account for interdependencies in a “general equilibrium” setting, Fukao, Ishido & Ito (2003), study the effects of NAFTA by including only the members of NAFTA in the gravity specification. Later researchers found possible bias in this kind of estimation). Matyas (1997), Egger (2002) and Glick & Rose (2001) contribute to the econometric specification of TC and TD analysis. Similar to trade creation and diversion, Rojid (2006) studies the impact of COMESA agreement on its members, intending to prove an “intra-overtrading” pattern.
All the papers stressed on the importance of a panel data, since the evolution of trade under an RTA is dynamic in nature. Martinez-Zarzoso & Nowak-Lehmann (2003) & Garcia, Pabsdorf & Herrera (2013) study the trade creation and diversion impact due to MERCOSUR. Roberts (2004) studies the effect of China-ASEAN trade using cross-sectional data, and found that ASEAN’s exports to the rest of the world is positive and significant, and led greatly by exports to China. Other studies regarding the ASEAN members are Sohn (2005) who studies the effects of Korea-ASEAN trade partnership, using a cross-sectional analysis, and finds that the ASEAN Plus Three (including Korea) leads to significant intra-trade. Tang (2005) studies the effects of NAFTA
7 “Trade potential” is an econometric calculation post analysis, to find out the ratio of estimated value of trade
with actual trade, to see if there is under-trading/over-trading. The term “potential” is still under debate whether or not it is the same as calculating overtrading/under-trading.
18 and ASEAN using a panel of 21 countries for 10 years, and finds that the impact of ASEAN’s exports to NAFTA is greater than the intra-ASEAN trade, and Kien (2009) studies the effect of ASEAN membership in a panel of 39 countries, and finds positive significant intra-ASEAN trade. The common lacking aspect of all these previous studies is that the size of the panel is either too small, or indicting cherry-picked sample panels, or a cross-sectional study. This study overcomes this problem by taking a large panel of 135 for a reasonably small time period of 15 years, the most recent time period, and includes 5 other RTAs apart from ASEAN, in an attempt to reasonably provide a comparison with that of the ASEAN’s regional trading patterns, and with the previous literature.
The inclusion of dummy variables with the appropriate model selection, allows us to capture the intra-bloc trading effects, as well as whether or not the RTA has led to trade creation or trade diversion. The main impact of an RTA, according to Viner (1950) include implications of welfare on the members of the RTA, and the rest of the world. In the next chapter, the extensive meaning of the RTA dummy variables used is given. The intraregional trade concentrations as per table 1 show a very mixed image of the time trend of ASEAN’s intra-trade. Nevertheless, the intra-trade variable of AFTA is expected to be positive and significant. Given that the intra-AFTA variable is greater than zero, the research question of the paper would then be: does this intra-trade between ASEAN members (denoted by a dummy variable which takes value 1, if both origin and destination country in a bilateral trade observation belongs to AFTA, zero otherwise) contribute to trade creation or trade diversion?
This will depend on the signs of the other dummy variable for an RTA: the members’ exports to rest of the world (denoted by the dummy which takes value 1 if the origin country is part of the RTA, zero otherwise).
19
4. Data and Methodology
This section is devoted to the description of the variables used in the model, along with the methodology used in the study, and the motivations behind the choice of method. The section concludes with the econometric hypothesis of the study.
The main variables used in the gravity model according to empirical studies, are used here as well (GDPs, per capita GDPs, bilateral distance, common language, etc.). The main data source is Head, Mayer & Ries’s (2010) bilateral directional trade flows data from CEPII, and Head & Mayer’s (2014) gravity dataset, containing the common gravity variables, also from CEPII. CEPII provides a comprehensive gravity database, containing data from 2000 until 2014. The variables list table given below explains the meaning behind each of the variables. This table is a brief description of the basic structural gravity equation’s variables, so it does not contain the Regional Trade Agreements dummy variables used in this model. The dataset consists of bilateral trade from an origin country to a destination country, from 2000-2014, for 135 countries, and 18,090 country-pairs and 235,324 observations, (the actual number should be 135*134*15 = 271,350 observations. This is due to many missing values in the data).
Table 2: Variables List, excluding the dummy variables assigned for the RTAs
Note: o represents ‘origin’ and d represents ‘destination’ countries and ‘t’ represents time period. TRADEod is then, trade flow (exports) from o to d. Apart from Contig, Comlang_off and Colony, all the variables in the model are logged.
8 The remoteness indexes are calculated as GDP weighted average distances for the origin and the destination.
For example, the origin (exporter)’s remoteness index = ∑ /((𝐷𝑖𝑠𝑡𝐺𝐷𝑃𝑜𝑑𝑑) 𝐺𝐷𝑃𝑤𝑜𝑟𝑙𝑑)
𝑑 , where the
𝐺𝐷𝑃𝑑
𝐺𝐷𝑃𝑤𝑜𝑟𝑙𝑑 is the share of the
destination (importer)’s GDP with respect to the world’s GDP. The remoteness index for the importer is calculated in a similar way.
Dependent Variable Description Unit
TRADEod Exports directional from origin to destination US$ million Independent Variables
GDPot GDP of origin country at time t US$
GDPdt GDP of destination country at time t US$
GDPPCot GDP per capita of origin country at time t US$
GDPPCcdt GDP per capita of destination country at time t US$
DISTod Great Circle Distance between origin and destination’s capital cities Kilometers
REMOTEot8
“Remoteness index” of origin at time t Weighted index
REMOTEdt “Remoteness index” of destination at time t Weighted Index
CONTIGod Equal to 1 if origin and destination share a border Dummy
COMLANG_OFFod Equal to 1 if origin and destination have common official language Dummy
20 The regional trade agreements considered in this model are APTA (Asia-Pacific Trade Agreement), AFTA (ASEAN Free Trade Agreement), COMESA (Common market for Eastern and Southern Africa), MERCOSUR (Mercado Común del sur, or the Southern Common Market) and NAFTA (North American Free Trade Agreement). Appendix A3 lists the entire list of countries taken for the sample, in which the member nations belonging to each RTA are also stated. For each of the five RTAs considered, three dummies are taken – i) an intra-RTA dummy, ii) destination belonging to the RTA and iii) origin belonging to the RTA.
The dataset contains 135 countries, for the time period 2000 – 2014 (the last year for which the data was available). For the panel identifier, a country-pair is formed. So, the panel setting is structured as for example, export for a bilateral pair – USA to UK at time 2005. The trade flow (exports), distance, contiguity, common language and colonial relationship variables are dyadic variables. Per capita incomes, GDPs and remoteness indexes for the origin and destination countries are monadic variables, identified with the respective country (origin or destination). The aim of the initial year being 2000, is to assess the impact of intra-trade in ASEAN after all the members have joined (the latest being Cambodia in 1999). In Table 2, all variables except distance, contiguity, common language and common colonizer are time-variant. Some of the RTA variables are time variant, and others are time invariant. In the time period considered, 4 out of the 6 RTAs are time-invariant (meaning either the origin or the destination country or both part of the RTA joined or left the RTA in the time period of this study). Except COMESA (Seychelles, Libya, Namibia and Angola joined amid the time period considered) and APTA (China joined in 2001), every other RTA dummy variable set is time invariant.
4.1. Variables
The bilateral trade flow data from CEPII describes the trade flow from the origin country to the destination country. The limitation of this data is that some of the exports from A to B might have been recorded as the imports of B from A, and hence these two values are not bound to be similar, since exports are recorded FOB (Free-on-board) and imports are recorded CIF (Cost, insurance & freight). This type of data mismatch has been avoided as much as possible (Head & Mayer, 2014), by estimating the CIF, and adjusting the value of imports of B from A, to obtain exports of A to
21 B. The trade flows data contains zero values, and these could be for multiple reasons as well. There might have been recording systems where extremely low values did not pass the cut-off amount to be entered as a sale. The estimation method – the Poisson pseudo-maximum likelihood estimator is to take care of this predicament, as mentioned in section 4.2.
The bilateral distance variable given by Head & Mayer (2014) in the CEPII database, as well as used by several researchers (Santos Silva & Tenreyro, 2006), Kien (2009), Westerlund & Wilhelmsson (2011), etc. is the geographic ‘Great Circle Distance’ calculated between two countries’ as the shortest geo-spatial distance from the two countries’ capital cities, on a flat map. The distance variable is a proxy for transportation costs, prominent in use in the gravity models ever since its popularity surged. The income variables are straightforward in explaining. The notion of the gravity model vis-à-vis the Newton equation, requires the size of the economy to be the ‘mass’, and hence, GDPs. The idea behind the GDP per capita variables is due to heterogenous preferences which vary with income and standard of living. The industries of countries with higher per capita incomes demand different types of products than those with lower per capita incomes. This is in line with Krugman’s (1979) new trade theory. Anderson & van Wincoop (2003) stated in their seminal work that it is very important for a person studying the gravity equation to include multilateral resistance terms (MRTs) in the equation.
Krugman’s (1995) words on MRTs make it easier to understand. Two countries trade more with each other the more remote they are with respect to the rest of the world, ceteris paribus. This is due to the fact that if a pair of countries are remote from the rest of the world, even with greater individual distance to the rest of the world, they trade more with each other. They are so otherwise known as “remoteness indexes” (Wei, 1996). Hummels (2001) & Feenstra (2016) advocate the use of origin and destination fixed effects, in a cross-sectional setting, to account for MRTs. Taking it further into a panel setting, Olivero & Yotov (2012) advocate the use of directional (exporter-time and importer-(exporter-time) fixed effects, to account for the (exporter-time-variant nature of MRTs. The usage of directional fixed effects however, will also absorb individual observable and unobservable time-varying variables such as GDPs, per capita GDPs, etc. Hence, in this study, the construction of “remoteness indexes” is how the MRTs will be accounted for (Baier & Bergstrand, 2009). Baldwin
22 and Taglioni (2006) emphasize the importance of including MRTs in the gravity equation, and calls omitting it the “Gold Medal” error.
Over the course of history, contiguity, common language and common colonial relationships have proven to be part of the standard gravity model (Abbas & Waheed, 2019). Tinbergen (1962) in the first gravity model of trade included common border and language variables in the analysis. Although not backed by theoretical foundations, it is shown that sharing the same official languages and sharing a border does boost cultural relationships (Tinbergen, 1962; Egger, 2002; Anderson & van Wincoop, 2003), and thus, boost trade (even in hostile situations, such as India-China, India-Pakistan, etc.). Table 3 below, reports the descriptive statistics of the time-variant variables.
Table 3: Descriptive Statistics of the time-variant variables
Variable Observations Mean Std. Dev. Minimum Maximum
Trade 235,324 464.8 3839.23 0 283660 GDPot 235,324 432162.2 1455334 201.8999 1.74E+07 GDPdt 235,324 432162.2 1455334 201.8999 1.74E+07 GDPpcot 235,324 14298.35 18409.38 108.0145 112481.2 GDPpcdt 235,324 14298.35 18409.38 108.0145 112481.2 DISTod 235,324 7434.23 4307.947 60.77057 19781.39 REMot 235,324 128.1646 34.17 80.02833 250.3022 REMdt 235,324 123.4544 34.17 80.02833 250.3022 Contig 235,324 0.021 0.144 0 1 Comlang_off 235,324 0.125 0.331 0 1 Colony 235,324 0.016 0.126 0 1 EUo 235,324 0.172 0.378 0 1 EUd 235,324 0.172 0.378 0 1 EUod 235,324 0.029 0.169 0 1 MERCOSURo 235,324 0.039 0.192 0 1 MERCOSURd 235,324 0.039 0.192 0 1 MERCOSURod 235,324 0.001 0.034 0 1 NAFTAo 235,324 0.023 0.150 0 1 NAFTAd 235,324 0.023 0.150 0 1 NAFTAod 235,324 0.0003 0.018 0 1 COMESAo 235,324 0.144 0.350 0 1 COMESAd 235,324 0.144 0.350 0 1 COMESAod 235,324 0.02 0.138 0 1 APTAo 235,324 0.038 0.190 0 1 APTAd 235,324 0.038 0.190 0 1 APTAod 235,324 0.001 0.033 0 1 AFTAo 235,324 0.080 0.266 0 1 AFTAd 235,324 0.080 0.266 0 1 AFTAod 235,324 0.005 0.072 0 1
23 The time invariant dummies of common border, language and colonizer will have the minimum and maximum of zero and one respectively, and hence futile to describe. The interesting feature of the table above is the trade variable. The trade variable’s mean and standard deviation show a heavy skew in the data, indicating presence of heteroskedasticity. This is due to the presence of zero trade values in some parts of the sample. The set of income variables are the same for the origin and destination, since the sample contains two pairs of monadic variables for the same set of countries. The data contains 192,180 observations with positive trade values, out of the total 235,324 observations, indicating 18.33% of the sample for trade containing zero values, and some missing values for certain pairs. The GDP and trade coefficient’s correlation are 0.55, and the distance and trade correlation are -0.26, showing that the basic gravity model variables are as expected. Appendix B1 provides the correlation table for the Appendix B2 provides the scatter plot with a line fit for the basic gravity relationships (positive relationship of trade with the GDPs of origin and destination; negative relationship of trade with geographical proximity, i.e., distance). Amongst the independent variables, naturally, there are significant correlations among GDPs and GDP per capita of the origin country, and for the destination country, and for the sake of the specification of the model chosen, the study will continue to suffer from this limitation. However, the correlation among all the other variables in the model are very low. The RTA dummies and how they answer the research question are given in the following paragraphs. The dummy variables are defined as follows:
𝐴𝑆𝐸𝐴𝑁𝑜 = 1 if the origin is a member of AFTA; 𝐴𝑆𝐸𝐴𝑁𝑑 = 1 if the destination is a member of
ASEAN and 𝐴𝑆𝐸𝐴𝑁𝑜𝑑 = 1 if both the origin and destination are members of ASEAN. 𝐴𝑆𝐸𝐴𝑁𝑜
represents the bloc’s exports to the rest of the world, 𝐴𝑆𝐸𝐴𝑁𝑑 represents the bloc’s imports from
the rest of the world, and 𝐴𝑆𝐸𝐴𝑁𝑜𝑑 represents intra-bloc trade. The RTA dummy variables for
MERCOSUR, APTA, COMESA, EU and NAFTA are formed in a similar way, obtaining 18 total RTA dummy variables. To explain the effect of trade creation and diversion, using these three dummy variables will help:
𝛽1𝐴𝐹𝑇𝐴𝑜 = 1 𝑖𝑓 𝑜 𝑖𝑠 𝑚𝑒𝑚𝑏𝑒𝑟 𝑜𝑓 𝐴𝑆𝐸𝐴𝑁, where o is origin and d is destination. 𝛽2𝐴𝐹𝑇𝐴𝑑= 1 𝑖𝑓 𝑑 𝑖𝑠 𝑚𝑒𝑚𝑏𝑒𝑟 𝑜𝑓 𝐴𝑆𝐸𝐴𝑁
24
𝛽3𝐴𝐹𝑇𝐴𝑜𝑑= 1 𝑖𝑓 𝑜 𝑎𝑛𝑑 𝑑 𝑎𝑟𝑒 𝑚𝑒𝑚𝑏𝑒𝑟𝑠 𝑜𝑓 𝐴𝑆𝐸𝐴𝑁
𝛽1, 𝛽2 𝑎𝑛𝑑 𝛽3 are the coefficients for the three variables, o and d are origin and destination, respectively. A positive significant 𝛽3 indicates more intraregional trade, which corresponds to
possible complement to domestic production, or to substitution to exports to the rest of the world. So, in order to decide whether this attributes to trade creation or trade diversion, we need to look at the signs of the coefficients 𝛽1 𝑎𝑛𝑑 𝛽2. A positive 𝛽3 with a low propensity to export to the rest
of the world, 𝛽1 being less than zero, indicates trade diversion from rest of the world. If this
increase in 𝛽3 is entirely consumed by the decrease in 𝛽1, it indicates pure trade diversion. If the
increase in 𝛽3 is larger than the decrease in 𝛽1, then there is both trade creation and diversion.
Finally, if 𝛽3 and 𝛽1 are both positive, then there is pure trade creation. If 𝛽1 is less than zero (trade
diversion) in terms of welfare for non-members is there is decrease in their welfare. Similarly, in trade creation, there is increased welfare for non-members and members, due to increased trade amongst the members of the RTA, as well as to the rest of the world.
4.2. Methodology
In any large database such as the gravity database, we must expect many zero values, as many countries differ in their quality and efficiency of recording the values. Haveman & Hummels (2004) find out in their study that about 1/3rd of their bilateral trade values are missing. Helpman et al. (2008) show that half of the trade matrix has zero values. This paper as well, as mentioned in the previous section, has 18.33% missing values. Despite this troublesome issue, researchers still used the log-linear version of the gravity equation to estimate. This causes serious bias in the main estimates (Santos Silva & Tenreyro, 2006; Westerlund & Wilhelmsson, 2011). Since log of zero is undefined, there are bound to be missing values. Dropping the zero observations creates informational bias. Truncated samples yield misleading interpretations. Martin & Pham (2015) explained that the missing values were hardly emphasized due to the convenience provided by the log-linear estimates. One solution is to use the log linear version of the dependent variable (trade + 1)9, so that the log of ones will now be zero. The estimation method used in this paper is the
9 Burger, van Oort & Linders (2009) show a similar analysis of comparisons between OLS with log of Trade + 1
and PPML with Trade and provides further conclusive results that the PPML method is able to take advantage of the zero values in trade, and provides a robust result with both trade and trade > 0 as the dependent variable.
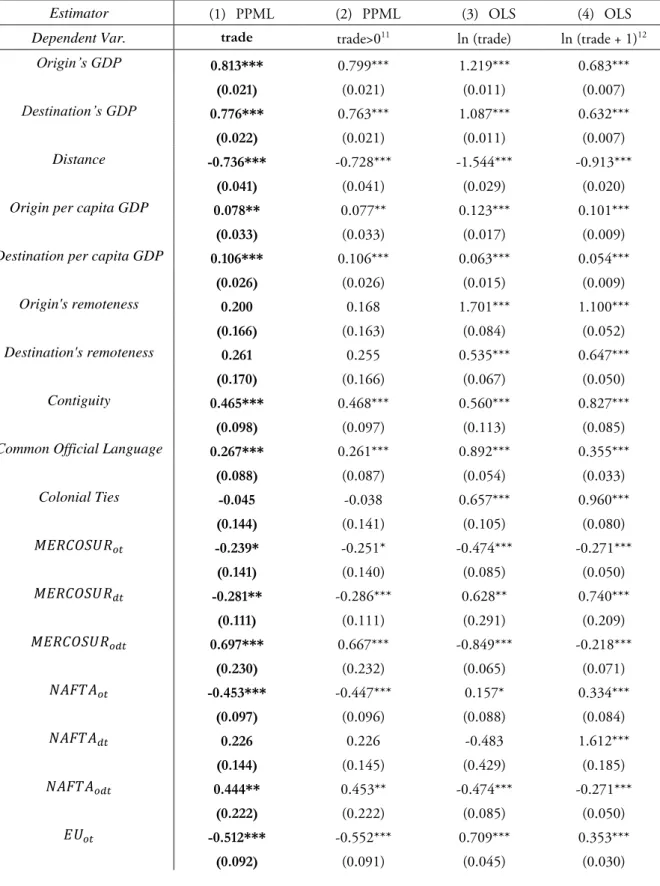
25 Poisson Pseudo-Maximum Likelihood (PPML) estimator. Proposed first by Santos Silva & Tenreyro (2006), the PPML method gained a lot of popularity in the most recent decade. PPML is a robust approach when considering heteroskedasticity, and with largely extant zero values. This is because the dependent variable is in levels, and estimated in a multiplicative exponential method. Yotov, Piermartini, Monteiro & Larch (2016) as part of the UNCTAD in association with the WTO in their six recommendations on estimating a gravity model, suggest the PPML method. The PPML model does not assume homoskedasticity, and follows the robust variance-covariance matrix as in White (1980). Burger, van Oort & Linders (2009) also advocate the use of a fixed effects Poisson PML estimator. Larch, Wanner, Yotov & Zylkin (2018) study the effect of currency unions (CU) on trade and income using linear regression and the PPML regression, and find out that the PPML estimates are statistically superior to the OLS. The PPML method is shown to provide the impacts of trade policy on trade, consistent with the theory (Anderson, Rees & Sabia, 2015; Larch and Yotov, 2016). As a robustness test, recommended by Head & Mayer (2014), this paper also shows the comparison of PPML results to that of OLS, with the RTA dummies. The standard form of the PPML model in this study is:
𝑇𝑟𝑎𝑑𝑒 = exp(𝛼0+ 𝜇𝑡+ 𝛽0𝑙𝐺𝐷𝑃𝑜𝑡+ 𝛽1𝑙𝐺𝐷𝑃𝑑𝑡+ 𝛽2𝑙𝐺𝐷𝑃𝑝𝑐𝑜𝑡+ 𝛽3𝑙𝐺𝐷𝑃𝑝𝑐𝑑𝑡+ 𝛽4𝑙𝐷𝑖𝑠𝑡𝑜𝑑+ 𝛽5𝑙𝑅𝐸𝑀𝑜𝑡+
𝛽6𝑙𝑅𝐸𝑀𝑑𝑡+ 𝛽7𝐶𝑜𝑛𝑡𝑖𝑔𝑜𝑑+ 𝛽8𝐶𝑜𝑚𝑙𝑎𝑛𝑔𝑜𝑑+ 𝛽9𝐶𝑜𝑙𝑜𝑛𝑦𝑜𝑑+ 𝛼0𝐴𝐹𝑇𝐴𝑜𝑡+ 𝛼1𝐴𝐹𝑇𝐴𝑑𝑡+ 𝛼2𝐴𝐹𝑇𝐴𝑜𝑑𝑡+
𝛾0𝐴𝑃𝑇𝐴𝑜𝑡+ 𝛾1𝐴𝑃𝑇𝐴𝑑𝑡+ 𝛾2𝐴𝑃𝑇𝐴𝑜𝑑𝑡+ 𝛿0𝐶𝑂𝑀𝐸𝑆𝐴𝑜𝑡+ 𝛿1𝐶𝑂𝑀𝐸𝑆𝐴𝑑𝑡+ 𝛿2𝐶𝑂𝑀𝐸𝑆𝐴𝑜𝑑𝑡+
𝜃0𝑀𝐸𝑅𝐶𝑂𝑆𝑈𝑅𝑜𝑡+ 𝜃1𝑀𝐸𝑅𝐶𝑂𝑆𝑈𝑅𝑑𝑡+ 𝜃2𝑀𝐸𝑅𝐶𝑂𝑆𝑈𝑅𝑜𝑑𝑡+ 𝜌0𝑁𝐴𝐹𝑇𝐴𝑜𝑡+ 𝜌1𝑁𝐴𝐹𝑇𝐴𝑑𝑡+ 𝜌2𝑁𝐴𝐹𝑇𝐴𝑜𝑑𝑡+
𝜋0𝐸𝑈𝑜+ 𝜋1𝐸𝑈𝑑+ 𝜋2𝐸𝑈𝑜𝑑) ∗ 𝜀𝑜𝑑𝑡 (1)
𝜇𝑡 represents the time or business cycle fixed effects, which is common for both the origin and the destination. 𝐶𝑜𝑛𝑡𝑖𝑔𝑜𝑑 is the dummy indicating whether the origin and destination share a
common border or not; 𝐶𝑜𝑚𝑙𝑎𝑛𝑔𝑜𝑑 is the dummy indicating if the origin and the destination
share a common official language or not; 𝐶𝑜𝑙𝑜𝑛𝑦𝑜𝑑 is the dummy indicating if both the origin
and the destination have ever had a colonial relationship; 𝐴𝐹𝑇𝐴𝑜𝑡 is the dummy whether the origin
belongs in AFTA (ASEAN) or not at time t, 𝐴𝐹𝑇𝐴𝑑𝑡 is the dummy whether the destination is a
member of AFTA or not at time t. 𝐴𝐹𝑇𝐴𝑜𝑑𝑡 is whether both are members of AFTA at t. The rest
of the RTA dummies are interpreted the same way. The multilateral resistance terms in the form of directional (exporter-time and importer-time fixed) effects (Hummels, 2001; Feenstra, 2016) is
26 not used in this study. Inclusion of exporter-time and importer-time fixed effects will solve the “Gold Medal Error”, but the inclusion of country-time specific variables such as GDP and GDP per capita will not be possible. Olivero & Yotov (2012) show that the inclusion of these fixed effects in lieu of absorption of the country-specific variables such as GDPs and exchange rates, etc., depends on the model specification and the study itself. In this paper, the inclusion of MRTs is limited to remoteness indexes for the exporter and the importer, along with the inclusion of year fixed effects, to account for business cycle effects in the time periods that may affect trade.
Also, it must be noted however, that PPML is not the only solution for zero trade. Eaton & Tamura (1995) and Martin & Pham (2008) propose the Tobit estimation method. Another noteworthy alternative to log linear OLS is given by Helpman, Melitz & Rubinstein (2008), using a two-stage estimation technique, where in the first stage, using probit, determines the probability of a particular country pair to have positive trade flows, and then estimates using OLS the positive samples. Egger & Larch (2011) propose a similar method, by estimating a two-part gravity model, by determining the decision to export to country at all exists or not. Among all these solutions, the PPML method is the most convenient one to explain and interpret and execute. The PPML method, amongst the other solutions, works consistently well even with large proportions of zero trade values and missing values (Yotov, Piermartini, Monteiro & Larch, 2016). Perhaps the biggest limitation of this study is the potential endogeneity of the RTA dummy variables. As stated by Trefler (1993), two or more countries are likely to liberalize its trading policy with an RTA, given that they are already significant trading partners. The use of instrumental variables to solve this issue is another challenge, given that it is hard to find appropriate instruments (Baier & Bergstrand, 2007). Egger & Nigai (2015) show that the use of country-pair fixed effects10
are among the best way to solve the problem of RTA endogeneity. However, this study will continue to suffer from this issue, and is beyond the scope of this analysis.
10 Including pair fixed effects for PPML creates more than 17,000 pairs in this study, which creates more than
the limit of variables in statistical software used such as STATA. Moreover, the reason for including remoteness indexes and multiple RTAs is to account for bilateral fixed effects for the largest trading countries in the sample.
27 To summarize the research hypothesis in terms of the variables chosen in the model for AFTA: If 𝛼2 > 0, 𝑎𝑛𝑑 𝛼0 > 0, there is pure trade creation in terms of exports.
If 𝛼2 > 0, 𝑎𝑛𝑑 𝛼0 < 0, and if |𝛼0| is greater than |𝛼2|, there is pure trade diversion in terms of
exports.
If 𝛼2 > 0, 𝑎𝑛𝑑 𝛼0 < 0, and if |𝛼0| is lesser than |𝛼2|, there is both trade creation and diversion
in terms of exports.
In case 𝛼2 = 0, then a positive 𝛼0 indicates an export trade creation, and an insignificant