Sekundär primär cancer
Resultat från EU-projektet PanCareSurFup
Utbildningsdag PHO-sektionen Stockholm, 2019-01-30
Lars Hjorth, överläkare, docent
PanCare
• A multidisciplinary pan‐European network of
professionals, survivors and their families
• Founded in 2008
• A legal entity in 2013
• Charitable status in 2014
• Newsletter
•
www.pancare.eu
• 13 elected Board members
• More than 200 full members from various
backgrounds and disciplines
Short history
ESLCCC2007 Lund Apr. 2007 I-BFM ELTEC Budapest Oct. 2007 PanCare foundation Lund 2008 PanCare meeting # 2-22 in Graz, Modena,Newcastle, Paris, Mainz, Brno, Amsterdam,
Bucharest, London, Genova, Amsterdam (again), Wroclaw,
Lucerne, Dublin, Vienna, Lisbon, Erice, Lund, Lübeck, Prague and Paris PanCareSurFup 2011 - 2017 2007 2008 2011 PanCareLIFE 2013 - 2018 PanCare meeting # 23 Rijeka, April 24-26, 2019 PanCareFollowUp 2019 - 2023
PanCareSurFup
(PanCare Childhood and Adolescent Cancer Survivor Care and Follow-up Studies)
HEALTH.2010.2.4.1-7 Predicting long-term side effects
to cancer therapy, €6,000,000 6 years (2011-2017)
PanCareSurFup
(PanCare Childhood and Adolescent Cancer Survivor Care and Follow-up Studies)
WP1 – Data collection and harmonisation (UMC)
WP2 – Radiation dosimetry (IGR)
WP3 – Cardiac disease (AMC)
WP4 – Second primary neoplasms (UBHAM)
WP5 – Late mortality (ULUND)
WP6 – Guidelines, transition and follow-up (UNEW)
WP7 – Dissemination and training (MBBM)
WP8 – Coordination and management (ULUND)
www.pancaresurfup.eu
WP4
Standardized incidence ratios (SIRs) are calculated as the observed divided by
the expected number of STS
Absolute excess risks (AERs) are calculated as the observed minus the expected
number of new tumours, divided by person years at risk and multiplied by 10 000. The absolute excess risk can be interpreted as the number of excess new tumours observed beyond that expected per 10 000 persons per year
Relative risks can be interpreted as the ratio of standardized incidence ratios
adjusted for other explanatory factors
Relative excess risks can be interpreted as the ratio of absolute excess risks
WP4
Risk of Soft-Tissue Sarcoma among 69,460 5-year Survivors of
Childhood Cancer in Europe
Overall, survivors had a 15.7-fold (95% CI of 14.0 to 17.6) risk of developing a STS compared with that expected from the general population,
corresponding to an absolute excess risk of 2.5 (95% CI of 2.2 to 2.8)
WP4, cont.
Survivors of each specific type of childhood cancer were at a statistically significantly increased multiplicative (SIR) and absolute (AER) excess risk of developing a STS, particularly retinoblastoma survivors (SIR = 72.8, 95% CI 56.1 to 93.0; AER = 10.5, 95% CI 7.9 to 13.1)
There was no statistically significant relationship between age at diagnosis or decade of diagnosis and the excess risk of STS in either
multiplicative or absolute terms.
WP4, cont.
The relative risk declined by 50% among survivors older than age 40 years compared with survivors age 0 to 19 years (RR = 0.5, 95% CI 0.3 to 0.8); in contrast, the relative excess risk increased 2.9-fold (95% CI 1.8 to 4.5)
Beyond 45 years from diagnosis, the absolute excess risk was 9.1 (95% CI = 3.6 to 14.6). The cumulative incidence of developing a STS was 1.4% (95% CI = 1.1 to 1.6) at 45 years from diagnosis, whereas 0.1% was expected
WP4
Risk of Subsequent Bone Cancers among 69,460 5-year
Survivors of Childhood and Adolescent Cancer in Europe
Overall, survivors were 21.65 times (95% CI = 18.97 to 24.60 times) more likely to experience a bone SPN than expected, which equated to 1.99 (95% CI = 1.72 to 2.26) excess bone cancers per 10 000 person-years
When the risk of a bone SPN was assessed by FPN diagnosis, all diagnostic groups were found to have at least a five-fold increased risk compared with that expected
WP4, cont.
Retinoblastoma survivors were found to have the greatest excess risks both in multiplicative and absolute terms, with a standardized incidence ratio of 134.9 (95% CI = 105.7 to 169.6) and 12.0 (95% CI = 9.3 to 14.8) excess bone cancers per 10 000 person-years
Bone sarcoma and STS survivors had the next greatest excess risks at 78.2-fold (95% CI = 55.0 to 107.8) and 46.8-78.2-fold (95% CI = 32.9 to 64.5) that
expected, respectively
WP4, cont.
After all FPNs combined, there was not a statistically significant linear
trend in excess risks (RRs or RERs) of bone SPN with either age at diagnosis of FPN or treatment era of FPN when adjusted
As years since diagnosis and attained age increased, both the relative risks and relative excess risks statistically significantly declined. Specifically,
from the age range of 5 to 19 years to 40+ years of age, the standardized incidence ratio declined from 29.0 (95% CI = 24.6 to 33.9) to 7.0 (95% CI = 2.6 to 15.1)
WP4, cont.
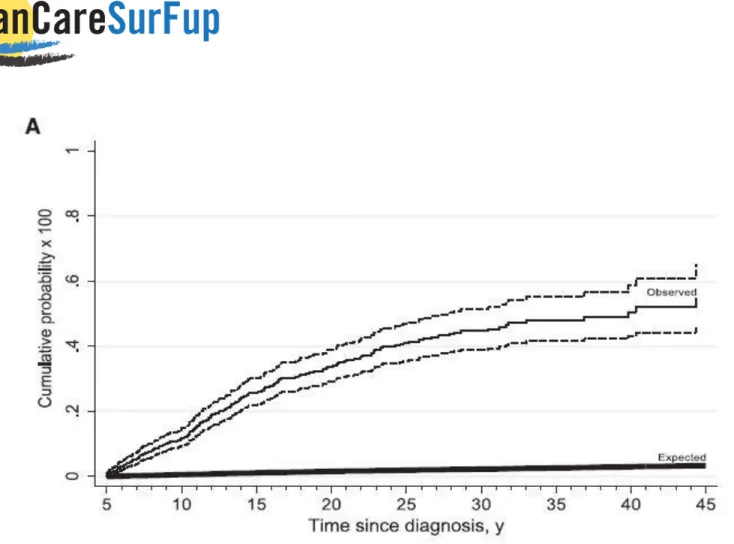
Beyond 40 years from diagnosis and age 40 years, there were at most 0.45 excess bone SPNs per 10 000 person-years. At 45 years since diagnosis, the cumulative incidence of a bone SPN was 0.6% compared with 0.03% of the expected
Figure 1. Cumulative probability curves for bone subsequent primary neoplasms (SPNs), by time since diagnosis. A) The observed cumulative probability for a bone SPN, with the corresponding 95% confidence intervals (dashed lines), compared with the expected
Figure 1. Cumulative probability curves for bone subsequent primary neoplasms (SPNs), by time since diagnosis. B) The cumulative probability for a bone SPN for survivors of
retinoblastoma, bone sarcoma, soft tissue sarcoma, and all other first primary neoplasm types compared with that expected from the general population.
Figure 1. Cumulative probability curves for bone subsequent primary neoplasms (SPNs), by time since diagnosis. C) The cumulative probability for an osteosarcoma SPN,
WP4, cont.
Analyses are on-going for: second digestive tumours, second leukemias and
second thyroid cancer
2017-2021 the Consortium has a moratorium on using the data
From 2022, the data will be available for further analyses by researchers from outside of the Consortium


