Examensarbete 2019:03 ISSN 1654-9392
Uppsala 2019
Determining the primary energy demand and
greenhouse gas emission of carrots
Comparing organic and conventional small scale carrot production
and supply in Sweden
Isac Jazin Jareborg
Determining the primary energy demand and
greenhouse gas emission of carrots
Comparing organic and conventional small scale carrot production and supply in Sweden
Fastställande av energibehovet och växthusgasutsläppen från morötter
Jämförelse mellan småskalig ekologisk och konventionell morotproduktion i Sverige
Isac Jazin Jareborg
Supervisor: Techane Bosona, department of energy and technology, SLU Subject reviewer: Åke Nordberg, department of energy and technology, SLU Examiner: Girma Gebresenbet, department of energy and technology, SLU Credits: 30 hp
Level, depth descriptor and subject: Second cycle, A2E, Technology Course title: Degree Project in Energy Systems Engineering
Course code: EX0724
Programme: Energy Systems Engineering 300 hp
Course coordination department: Department of energy and technology, SLU City of publication: Uppsala
Year of publication: 2019
Series: Examensarbete (department of energy and technology, SLU) Volume/Sequential designation: 2019:03
ISSN: 1654-9392
Electronic publication: http://stud.epsilon.slu.se Key words: LCA, GWP, CED, value chain, agriculture
Fakulteten för naturresurser och jordbruksvetenskap Institutionen för energi och teknik
i
Abstract
This study assessed the environmental performance of organic and conventional carrots produced and supplied in Sweden, as well as mapping out and describing the local carrot production and supply in Sweden to lay the groundwork for a decision support, primarily aimed at Swedish farmers and consumers. A life cycle assessment (LCA) methodology with the system boundary from carrot cultivation to consumer gate and a functional unit (FU) of 1 kg of carrots at the farm was applied, using the LCA software SimaPro 8.5.2. The information necessary for the life cycle inventory (LCI) was partially obtained from a literature review and partially from two questionnaires that were devised. Additionally, a sensitivity analysis focusing on the assumptions pertaining to the transportation has been made. The life cycle impact assessment (LCIA) focused on two impact categories: cumulative energy demand (CED) and global warming potential (GWP).
The LCIA results indicated that, in the organic case, CED and GWP values were 4.45 MJ and 0.193 kg CO2 eq per FU respectively. The obtained values for CED and GWP for the conventional carrot case were 4.82 MJ and 0.216 kg CO2 eq per FU respectively. This means that the organic carrot case had less impact (about 92% in terms of CED and 89% in terms of GWP), compared to the conventional carrot case. The transportation accounted for the largest impact, especially in terms of GWP, followed by the post-harvest processes and agricultural production for the organic carrot case. For the conventional case however, the agricultural production had a larger impact than the post-harvest processes. The largest contributing factors to the impact of the agricultural production of organic carrots were identified as the plastic used for mulching and the diesel use, while the largest contributing factors for the agricultural production of conventional carrots were identified as the plastic used to package pesticides and fertilizer, the fertilizer itself, electricity use and diesel use. The largest contributing factor to the CED of the post-harvest processes was identified as the electricity use, whilst the plastic packaging had the highest impact in terms of GWP. Finally, the single largest contributing factor was identified as the transportation from retailer to household, accounting for about 84% of the GWP and 88% of the CED from the transportation stage. This is equivalent to the transportation between retailer and household amounting to about 67% of GWP and 47% of CED for the organic carrot life cycle, as well as about 60% of GWP and 43% of CED for the conventional carrot life cycle.
ii
Populärvetenskaplig sammanfattning
Hur stor är miljöpåverkan från 1 kg svenska morötter, och vad har mindre miljöpåverkan: ekologiska morötter eller konventionellt odlade?
I takt med att miljömedvetenheten ökar för den svenska befolkningen blir det allt viktigare att det finns tillräcklig information om miljöpåverkan av vardagliga aktiviteter. Ungefär 20-30 % av vår totala miljöpåverkan som individer är ett resultat av maten vi äter. En förändring av mat- eller handlingsvanor är därför bra åtgärder för den som vill minska sin klimatpåverkan.
Alla frukter, bär och grönsaker som säljs i Sverige omsätter tillsammans ungefär 6 miljarder kronor årligen, varav 600 miljoner kronor är från morötter. Den genomsnittliga svensken köper 11 kg morötter per år, varav 90-95% produceras inom Sverige. Vi svenskar är alltså väldigt förtjusta i våra morötter. Det finns dock en brist på uppdaterad och tillförlitlig information om miljöpåverkan från svenska morötter, vilket innebär att fler undersökningar som denna behöver utföras. Även bönder, grossister och återförsäljare är målgrupper för denna typ av undersökning, då den skulle kunna vara beslutsunderlag för de verksamheter som är intresserade av att minska sin miljöpåverkan.
Syftet med denna rapport var att fastställa energiförbrukningen och klimatpåverkan för 1 kg morötter som producerats på en småskalig gård i Sverige. Utöver det har ekologisk och konventionell morotsodling jämförts, för att undersöka vilket produktionssystem som använder sig av minst energi och
producerar mindre växthusgasutsläpp. Detta gjordes med
livscykelanalysmetodik, vilket innebär att det tagits hänsyn till all påverkan från sådd, fram tills dess att morötterna transporterats till konsumentens hushåll. Energiförbrukningen och klimatpåverkan från bl.a. maskiner som använts för morotsodlingen, transporter, produktion av gödsel, bekämpningsmedel och plastförpackning m.m. har alltså tagits i beaktande medan energin som krävs för att förvara morötterna i kylskåp hemma eller tillaga dem inte har tagits hänsyn till. Informationen som krävdes för att genomföra arbetet kom delvis från frågeformulär som skickades ut till svenska bönder och återförsäljare, samt delvis från vetenskapliga rapporter och rapporter från Jordbruksverket. Denna information analyserades sedan i programmet SimaPro.
Resultatet av rapporten var att de ekologiska morötterna använde 8 % mindre energi och hade 11 % lägre klimatpåverkan, jämfört med de konventionellt odlade morötterna. Denna skillnad var ett resultat av själva odlingsprocessen, då det antogs att morötterna behandlas likadant efter att de lämnat gården. Om man ser till enbart odlingsprocessen har de ekologiska morötterna ungefär hälften av klimatpåverkan som de konventionella har, enligt resultaten från rapporten.
Transporter var den i särklass största påverkande faktorn. När ett avstånd på 3 km mellan hushåll och affär antogs motsvarade transport mellan
iii dessa mer än 40 % av energiförbrukningen och mer än 60 % av koldioxidutsläppen från morotens livscykel. Det är alltså viktigare att gå eller cykla till och från affären än vilken typ av morötter man köper om man är intresserad av att minska sin miljöpåverkan. Den som inte har möjlighet att cykla eller åka till affären och måste åka bil kan tänka på att försöka handla mer sällan och köpa mer mat när man väl handlar.
Executive summary
The FU of the study is 1 kg of carrots at the farm. The estimated losses down the supply chain have been assumed to be 33% at the end of retailing, meaning that the study does not estimate the impact from 1 kg of carrots at the retailer. This was done because of the availability of more data, and to potentially compare the results with food processed carrots.
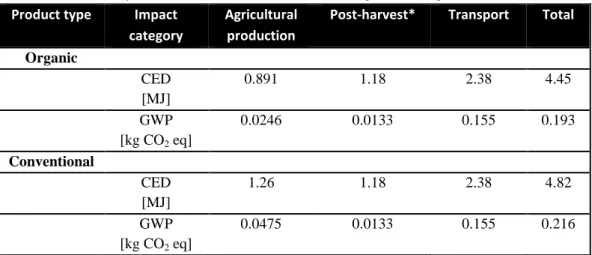
The LCIA results obtained from the SimaPro model were a CED of 4.45 MJ and a GWP of 0.193 kg CO2 eq per FU for the organic carrot case and CED of 4.82 MJ and GWP of 0.216 kg CO2 eq per FU for the conventional carrot case. The LCIA results from only the agricultural production were a CED of 0.891 MJ per FU for the organic carrot case, compared to 1.26 MJ per FU for the conventional carrot case; and a GWP of 0.0246 kg CO2 eq per FU for the organic carrot case, compared to 0.0475 kg CO2 eq per FU for the conventional carrot case. The largest contributing factor identified to the impact of the carrot life cycle was the transportation.
There are several potential improvements for future studies. Maybe the most important would be to examine large scale carrot producers, as the trend clearly shows that Swedish carrot producers are becoming fewer and larger. The system boundary in future studies should be expanded to include any processes at the household such as refrigeration and cooking, as well as some end-of-life scenarios where waste management would be considered. The effects of cooking and refrigeration on the total impact of the carrot life cycle would probably be of particular interest to consumers. Comparing composting and combusting the carrot waste as end-of-life scenarios would likely be interesting as well. Additionally, mulching and other alternatives to pesticides should be examined in separate cases, to make the comparison fairer. The impact from manure usage should be reassessed if it is to be fairly compared to mineral fertilizers. Furthermore, more LCA indicators should be examined, as well as an economical assessment. Comparing other types of carrot products, such as the dried carrots in Bosona & Gebresenbet (2018b) would likely be interesting for consumers as well. If different types of carrot products are to be examined however, it is paramount that the FU is set at a stage before any food processing, to make the comparison fair. Lastly, all assumptions made should be examined using either sensitivity analysis or error estimates.
iv
Table of contents
Abstract ...
Populärvetenskaplig sammanfattning ... ii
Executive summary ... iii
Table of contents ... iiv
List of abbreviations ... vi
List of tables ... vii
List of figures ... viii
1. Introduction ... 1
1.1 Background ... 1
1.2 Objectives of the study ... 1
1.3 Litterature review ... 2
1.3.1 Carrot production, consumption and prices in Sweden ... 2
1.3.2 Challenges for Swedish carrot producers ... 5
1.3.3 Organic vs Conventional farming ... 5
1.3.4 Fertilizer ... 6
1.3.5 Mulching ... 7
1.3.6 Carrot storage ... 8
1.3.7 Transportation ... 8
1.3.8 Introduction to Life Cycle Assessment ... 9
1.3.9 LCA studies on Carrots... 10
2. Materials and methods ... 10
2.1 Goal and scope ... 10
2.2 System description ... 11
2.2.1 Agricultural production ... 11
2.2.1.1 Pesticides and mulching ... 12
2.2.1.2 Fertilizer ... 12
2.2.1.3 Production and maintenance of farm machinery ... 12
2.2.2 Post-harvest handling ... 13
2.2.2.1 Storage ... 13
2.2.2.2 Washing and sorting ... 13
2.2.2.3 Packaging ... 14
v
2.2.3 Transport ... 14
2.2.4 Losses ... 15
2.3 Life Cycle Inventory ... 16
2.4 Impact assessment methodology ... 19
2.4.1 Impact categories and methods ... 19
2.4.2 Allocation, assumptions and limitations ... 19
2.4.3 Sensitivity analysis ... 20 3. Results ... 21 3.1 Agricultural production ... 23 3.2 Post-harvest processes ... 24 3.3 Transport ... 25 3.4 Sensitivity analysis ... 26 4. Discussion ... 26 5. Conclusion ... 31 References ... 32 Unpublished References... 35
Appendix A1: Questionnaire for carrot producers ... 36
Appendix A2: Questionnaire for retailers ... 37
Appendix B: Data used for creating figures ... 38
Appendix C: Full LCA results from ReCiPe ... 41
vi
List of abbreviations
CED – Cumulative Energy Demand CH4 – Methane CO2 – Carbon dioxide EU – European Union eq – equivalents FU – Functional Unit GHG – Greenhouse Gas
GWP – Global Warming Potential HDPE – How-density Polyethylene
IFDC – International Fertilizer Development Center IPCC – The Intergovernmental Panel on Climate Change ISO – Internal Standards Organization
LCA – Life Cycle Assessment LCI – Life Cycle Inventory
LCIA – Life Cycle Impact Assessment NH3 – Ammonia
NPK – Nitrogen, Phosphorus and Potassium N2O – Nitrous oxide
PELD – Low-density Polyethylene PP – Polypropylene
SEK – Swedish Krona
vii
List of tables
Table 1: Overview of the litterature review of LCA studies on carrots. ... 10
Table 2: Losses at different stages of the carrot life cycle ... 16
Table 3: Input data to SimaPro for organic carrot... 17
Table 4: Input data to SimaPro for conventional carrot ... 18
Table 5: Modeled cases for the sensitivity analysis ... 20
Table 6: Life cycle stages contribution to different impact categories ... 21
Table B1: Overview of the annual carrot production in Sweden ... 38
Table B2: Values for CED per FU for the Organic carrot case ... 39
Table B3: Values for CED per FU for the Conventional carrot case... 39
Table B4: Values for GWP and CED per FU for the Agricultural production stage of the Organic carrot case ... 39
Table B5: Values for GWP and CED per FU for the Agricultural production stage of the Conventional carrot case... 40
Table B6: Values for GWP and CED per FU for the Post-harvest stage ... 40
Table B7: Values for GWP and CED per FU for the Transportation stage ... 40
Table B8: Values for GWP and CED per FU obtained from the sensitivity analysis ………. 40
Table C1: All LCA results obtained from SimaPro using the method ReCiPe 2016 Midpoint (H) V1.02 ... 41
viii
List of figures
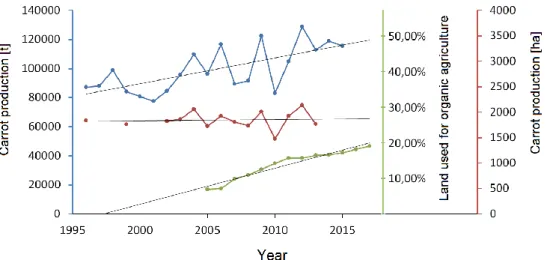
Figure 1: Overview of the annual Swedish carrot production ... 3
Figure 2: Simplified overview of the carrot supply chain ... 4
Figure 3: Visualization of the structure of Life Cycle Assessment ... 9
Figure 4: Simplified overview of the carrot life-cycle ... 11
Figure 5: Organic carrots from Tångagård... 11
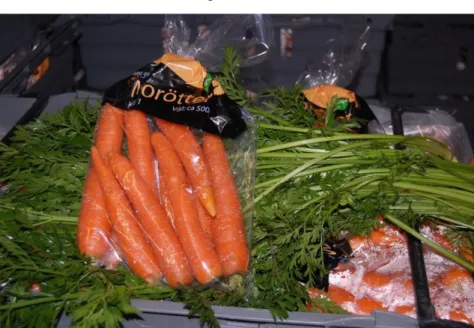
Figure 6: Packaged carrots ... 13
Figure 7:Visualization of transport distances ... 15
Figure 8: Energy consumption per FU for the carrot life cycle ... 22
Figure 9: Contributions from different stages of the carrot life cycles to the total CED ... 22
Figure 10: Contributions from different energy sources to the total CED ... 22
Figure 11: Climate change impact per FU at different stages of carrot life cycle ………... 23
Figure 12: Contributions from different stages of the carrot life cycles to the total GWP . ... 23
Figure 13: Contributions from processes and materials to the CED of the Agricultural production stage ... 24
Figure 14: Contributions from processes and materials to the GWP of the Agricultural production stage ... 24
Figure 15: Contributions from processes and materials to the GWP and CED of the Post-harvest stage ………..………..……... 25
Figure 16: Contributions from processes to the GWP and CED of the Transportation stage ... 25
1
1. Introduction
1.1 Background
The agricultural sector is a major contributor to environmental impacts such as global warming, with as much as 30% of global greenhouse gas (GHG) emissions being the direct result of agricultural production (Bosona & Gebresenbet, 2018a; Foley, 2010). Additionally, approximately 70% of global water withdrawal is due to agricultural production and 40% of all land area globally is covered by agriculture (Foley, 2010). The emissions from the agricultural sector are primarily in the form of the GHG’s CO2, CH4 and N2O, with food production being the primary contributor to said emissions (Bosona & Gebresenbet, 2018a; Johansson, 2015). The environmental impact of the production and consumption of food constitutes somewhere around 20-30% of an individual’s total environmental impact (Notarnicola et al., 2017; Stoessel et al., 2012), making food production a prime candidate for investigation as the environmental awareness of consumers increases. As the awareness of consumers about the environmental impact of food is increasing in Sweden, the need for more scientific data and understanding is required. This study will focus on the environmental impact of organic and conventional carrots produced and supplied in Sweden. The life cycle assessment (LCA) approach has been applied in this study, as described in following sections.
The origin of carrots isn’t known for sure. Some claim that carrots are the descendants of wild plants from the Mediterranean (Persson, 2004), but thorough genetic analysis reveals that carrots likely originate from Central Asia and were brought to Europe at some time between the 11th and 15th centuries (Iorizzo et al., 2013). Carrots originally had a violet color, but due to intensive plant breeding a pale yellow mutation was obtained, which eventually lead to the orange carrots we know today (Iorizzo et al., 2013; Persson, 2004).
1.2 Objectives of the study
The objective of this study was primarily to quantify the primary energy demand and GHG emissions from small scale Swedish carrot production (farms with less than 5 ha used for carrot production) and supply using the LCA approach. An overview of the Swedish carrot production and supply can be seen in section 1.3.1. The specific objectives of the study were to:
Conduct LCA comparing the environmental performance of organic
and conventional carrots produced and supplied in Sweden in terms of cumulative energy demand (CED) and global warming potential (GWP).
2 The study also intended to produce a reasonable groundwork for providing Swedish carrot farmers and consumers with decision support, because a thorough comparison between organic and conventional carrot production in Sweden is lacking. In the future, it could be generalized to, and compared with, other common fruit and vegetable products in Sweden.
1.3 Literature review
1.3.1 Carrot production, consumption and prices in Sweden
Wild carrots occur widely across the temperate parts of the world and domesticated carrots are therefore best suited for temperate regions (Iorizzo et al., 2013; Livsmedelssverige, 2011). Carrots can however be grown all over the globe under the assumption that the soil has the right conditions (Livsmedelssverige, 2011). Carrots grow particularly well in soil that is fertile, light, well drained, stone free with plenty of well-rotted organic material. This means that rich sandy peaty soils create the optimal conditions for carrot cultivation. Soils that are particularly hard to grow carrots in are heavy clay soils and or soils that are either stony or very dense; as such soil types are likely to cause the roots to fork. Additionally, soils that are water logged aren’t suitable for carrot cultivation (World Carrot Museum, n.d.).
Carrot seeds should be placed in water one day before sowing to reduce the time required for germination, which usually takes 12-16 days. The seeds can be placed into the soil as soon as the temperature in the soil reaches 9 o
C. Additionally, the soil should have a pH of at least 6.0. Carrot seeds should be placed in the soil at a depth of 1 cm as evenly as possible. This is to reduce the risk that the seeds germinate at different times, seeing as how it could lead to an uneven growth and in turn lead to damage on some of the carrots when they’re harvested. Furthermore, the carrot seeds should be placed at a distance of 4 cm from each other, in rows that are 20-40 cm apart, to give the carrots enough space to grow. Moreover, the soil should be watered immediately after sowing and consistently throughout the growth period. It is important to not overwater however, seeing as how it can cause the carrot roots to crack. In addition to access to water, it is recommendable to place the carrots in a location where there is wind, seeing as how it can restrict the amount of insect pest affecting the carrots. Because of this practically all carrot growth in Sweden is done in fields, seeing as there is virtually no advantage to sowing in greenhouses (Plantagen, n.d.).
The production of carrots constitutes approximately 10% of the market value of all fruits, berries and vegetables produced annually in Sweden, which corresponds to 600 million SEK annually. Carrot production is only being rivaled by the production of strawberries, which has a market value of almost 10%, or 570 million SEK(Mattsson & Johansson, 2017; Persson, 2017).
3 The growth of Swedish carrot production has been improving for a long time, increasing by 30% the last 20 years and by 90% since 1984, with most of the growth being confined to the counties Skåne and Gotland mentioned above. Even though the trend of Swedish carrot production has been increasing steadily, there is a lot of variation from year to year. Since 2010 the carrot production has varied from 83 000 tons to almost 129 000 tons annually (Mattsson & Johansson, 2017). An overview of how the Swedish carrot production has changed over time can be seen in Table B1and Figure 1.
Figure 1: Overview of the annual Swedish carrot production by year with corresponding linear trend lines. Since there is no official statistics on the share of produced carots in Sweden that are organic (Jordbruksverkets statistikdatabas, n.d.; Johan Ascard) the share of organic agricultural land in Sweden has been provided instead, as the share of organic carrots probably follows a similar pattern (Johan Ascard). The data can be seen in Table B1.
The average agricultural productivity for all carrot production is approximately the same throughout the Swedish counties, with a production of about 60 tons per hectare, which is an increase of 60% since 1984 and 30% since 2002. Another observable trend is that there are fewer Swedish carrot producers, decreasing by 65% (from 886 to 312) since 1984. The average size of the arable land used for carrot production has increased almost five times during the same time period, from 1.8 hectares to 8.8 hectares. Additionally, the average harvest per Swedish carrot producer has increased by a factor of more than 7, from 69 tons to 529 tons annually. This is a trend that is mirrored by Swedish agriculture in general, partly because the cost of machinery per hectare of arable land becomes lower and partly because a large fraction of mechanization reduces the need for labor and thereby reducing the production costs. Furthermore, large carrot producers with more than five hectares of arable land produce 50-70 tons of carrots per hectare on average, compared to 35-45 tons on average for carrot producers with less than five hectares of arable land for carrot production (Mattsson & Johansson, 2017).
4 The Swedish carrot consumption has also been increasing steadily, partly because the Swedish population has increased but also due to the fact that the average Swedish person consumed 6 kg of carrots per year in 1984 and now the average Swedish person consumes 11 kg of carrots per year. Most of the carrots sold in Sweden are produced domestically. The fraction can be significantly lower if there’s a bad year for carrot production, but on a normal year 90-95% of carrots sold in Sweden are of domestic origin (Mattsson & Johansson, 2017). Sweden mostly imports carrots from the Netherlands, Italy and to a lesser extent Germany, with most of the imports occurring during May and June when the quality of the carrots from last year’s harvest is low, due to the long time they’ve been stored. (Mattsson & Johansson, 2017; Karlsson, 2011).
Carrot prices increased by 45% during the period 2005-2015, which is considerably more than the average price increase for fruits and vegetables at 31% and 28% for agricultural products in general. However, 2015 was a record year for Swedish carrot prices, and if that year is excluded from the data carrot price growth appears to follow the average growth of prices for Swedish agricultural products very closely. Swedish carrot prices follow the same pattern every year. When the harvest season starts in July the prices are high but start to fall quickly as time passes, reaching their minimum at the end of the harvest season, around October or November. After November carrot prices start to increase slowly. Swedish carrot prices are approximately 40 euro for 100 kg, which is considerably higher than most other European countries. This would indicate that Swedish consumers prefer domestic carrots and are willing to pay more for them (Mattsson & Johansson, 2017).
Carrot producers have many potential avenues for marketing and selling their product, such as local markets, wholesalers, cooperative sales organizations, restaurants, industrial kitchens and selling directly at the farm. However, many carrot producers sell exclusively to wholesalers, as reaching out to retailers or another third party and negotiating a deal to sell to them directly can be difficult. This is especially true for small scale carrot producers (Bosona & Gebresenbet, 2018b; Håkansson et al., 2009). A simplified overview of the carrot supply chain can be seen in Figure 2.
5
1.3.2 Challenges for Swedish carrot producers
Due to the fact that carrots that grow slowly at the beginning of the season weeds can be a major problem, especially for organic farmers, seeing as how carrots have a hard time competing against weeds (Ascard et al., 1999). Another large challenge during the harvest phase of the carrot life cycle is the carrot fly, as it is prevalent in the entire country and infested carrots become unsellable. Carrot psyllids are another parasite that can cause severe problems for carrot producers, but seeing as they aren’t available everywhere in Sweden they don’t affect carrot production as much as the carrot fly does (Mattsson & Johansson, 2017). To combat this pesticides are used. One alternative is to cover the carrots with some type of weave or plastic material (a.k.a. mulching, see section 2.2.1.1), but this is a huge effort and is deemed very expensive according to The Swedish Board of Agriculture, especially considering that it only hinders the growth of weeds and doesn’t affect the insect pests (Mattsson & Johansson, 2017; Schonbeck, 2015). Other alternatives include harvesting the carrots earlier and sowing during the early summer instead of spring, but both of those alternatives have the same disadvantage of giving the carrots less time to grow (Mattsson & Johansson, 2017).
The Swedish Board of Agriculture deems it likely that the prevalence of insect pests will increase in the future because of the lack of effective pesticides and increasing pesticide resistance. Additionally, the Swedish Board of Agriculture predicts that a warming climate might produce an additional generation of carrot flies to spawn each year (Mattsson & Johansson, 2017). Furthermore, when carrots are stored in the ground carrot flies can survive the winter (Mattsson & Johansson, 2017; Persson, 2004).
1.3.3 Organic vs Conventional farming
Organic farming is a way to produce quality food while trying to minimize the impact on the environment. The concept of organic food production considers not only farming, but also parts of an extensive supply chain including food processing, distribution and retailers (European Commission, 2018a). A core pillar of organic farming is to operate as naturally as possible and respect the natural life cycles. According to the European commission, organic farmers should act in accordance to the following principles and objectives: Using disease-resistant plant species adapted to the local environment; chemicals such as synthetic fertilizers and pesticides are very restricted, genetically modified organisms are banned and crops should be rotated and on-site resources such as manure should be put to good use (European Commission, 2018a; Council of the European Union, 2007). Organic farmers as well as traders and processors have to comply with the requirements of the EU if they want to label their product as organic. The label has to contain the names of the producer,
6 processor and distributor that was the last to handle the product, as well as the code number of the national certification authority, a list of ingredients and nutritional value figures as they relate to the minimal nutritional requirements, as described in the EU regulations No 1169/2011 and No 834/2007 (European Commission, 2018b; European Parliament & Council of the European Union, 2011; Council of the European Union, 2007). The reason why the EU regulations cover the whole supply chain and all labeling of organic products within nations that are members of the EU is to ensure consumer confidence (European Commission, 2018b).
Organic products usually cost more than products from conventional farming. This is mainly due to the fact that organic products generally take longer to produce, are more labor intensive on average and are distributed on a smaller scale than their conventionally produced counterparts due to the strict certifications and controls from the European Union. All this amounts to increased production costs which in turn are passed on to the consumer to keep the organic practices economically viable. Additionally, conventional farms tend to be more productive than organic farms in terms of production per surface area. Even though organic farming aims to be a type of low input farming in terms of fertilizers and pesticides, an organic farm consumes an equal amount of fossil fuel per produced product on average, when compared to conventional farming (European Commission, 2018c).
1.3.4 Fertilizer
Agricultural soils usually lack N, P and K, either due to natural causes, excessive cultivation or other environmental reasons. N is a vital component of chlorophyll, as well as other processes required for plant growth. Additionally, N is a part of amino acids and compounds that have to do with the storage and usage of energy in plants. P plays a role in many functions that are necessary for healthy plant growth, such as crop quality, structural strength, root growth, blooming and seed production. Furthermore, P is an essential component of DNA and the process of transforming solar energy to usable compounds is possible in large part thanks to P. K is an important part of processes associated with growth and development, as plants that have low levels of K provide lower yields due to being stunted in their growth. K is referred to as the “quality element”, seeing as how it contributes to characteristics generally associated with quality, such as color, shape, size and even taste (Carlson & Le Capitaine, n.d.).
Compost and manure can be organic sources of N, P and K in NPK fertilizer blends. Additionally, blood meal can provide N and P, feather meal can provide N, biosolids and bone meal can provide P and wood ash can provide K. In terms of inorganic materials, urea, urea ammonium nitrate and anhydrous ammonia are the most common sources of N. The most common inorganic source of P in NPK fertilizers is phosphate rock. If crushed, it can be
7 applied directly to soils; however it is much more effective in terms of plant uptake if processed first. Lastly, the most common inorganic source of K is potash. Both potash and phosphate rock can be mined all over the world. Additional sources of inorganic K are langbeinite, potassium sulfate and granite dust (Carlson & Le Capitaine, n.d.).
NPK fertilizers come in granular, liquid and gaseous forms, with granular being the most common. NPK fertilizers are composed primarily of the three most important plant nutrients, or macronutrients. However, flexibility in the production allows for various other plant nutrients, or micronutrients, to be added to the blend; one example being fertilizers including sulfur, NPKS fertilizers. The global agricultural sector is highly dependent on the use of NPK fertilizers, as the IFDC estimates that about half of the entire planets population is alive due to the increased food production from mineral fertilizers (Carlson & Le Capitaine, n.d.; IFDC, n.d.).
1.3.5 Mulching
Mulching is the process of covering the soil around crops with some material to prevent weed growth by both hindering and shading emerging weeds as well as reducing weed seed germination. Additionally, mulching can potentially augment the growth of the crops and their competitiveness by conserving moisture in the soil and increasing the temperature of the soil in the case of black mulching materials. Mulching materials are sorted into two primary categories: synthetic materials, mainly polymers, and organic materials such as dried leaves, straw and hay (Schonbeck, 2015).
Synthetic mulches are implemented just before the vegetables are planted and require a prepared seedbed to lie on top of. After applying the mulching material, vegetables are seeded through holes that are cut in the material. The synthetic mulching material has to be removed from the field after the harvest. Organic mulching materials on the other hand are usually used when the crop has already grown for some time and are effective against weeds seeds, but not so much against perennial weeds. Organic mulches also conserve moisture in the soil, but unlike synthetic mulches they reduce soil temperature. Organic mulches are usually left in the field at the end of the harvest season, which leads to increased amounts of organic matter in the soil as the mulching material is broken down (Schonbeck, 2015).
Manual application of organic mulches is a labor intensive process, and therefore only really justifiable on a small scale. There are potential avenues to automate parts of the process however, with machines such as bale choppers. It is common to mix the two types of mulches, with organic mulching materials in between rows of beds with synthetic mulches on top. Even though mulching is comparatively expensive, many organic vegetable farmers consider mulching as the best way to manage weeds effectively (Schonbeck, 2015).
8
1.3.6 Carrot storage
Carrots are usually stored in a cooling unit inside plastic wrapped wooden boxes, to prevent the spreading of spores. Condensation is likely to form against the surface of the plastic wrapping, so to combat this it’s important to have fans that constantly circulate the air inside the cooling unit. Additionally, it’s important to have holes on the bottom and top of the plastic wrapping around the box. This stops the carbon dioxide concentration from reaching 2%, which can harm the carrots. The temperature inside the plastic wrapped box is likely to be 1-2 oC warmer than the surrounding cooling unit, so having a temperature as close to the freezing point as possible is preferable. A sign that the temperature in the cooling unit is too high is that haulm will begin to grow on the carrots. The combination of low temperatures and high humidity will lead to the formation of ice, so constant maintenance is required (Persson, 2004).
Another advantage to storing the carrots as close to 0 oC as possible is that it impedes the growth of fungi and other microorganisms on the carrots, reducing the carrot loss. Furthermore, carrots are very susceptible to dehydration so a relative humidity of 98-100% is optimal during the storage. To obtain such storage conditions an electrically driven cooling unit is commonly used, but when a cooling unit isn’t available a common alternative is to store the carrots in the ground. Carrots can also be stored in warehouses but the quality is considerably worse, losses are greater and carrots cultivated in sandy soil will develop a gray coating when stored in a warehouse (Persson, 2004).
To store the carrots in the ground a plastic film is placed on the rows of carrots, followed by a sheet of straw with a thickness corresponding to the amount of time the carrots will be stored. Storage in ground is the best way to store carrots that’ve been grown in sandy soil for several months, seeing as the quality of carrots grown in sandy soil deteriorates a lot faster in cooling units compared to carrots grown in humus soil. Storing carrots in the ground generally produces carrots that have higher quality, which usually means a higher price for the carrots, but ground storage has some disadvantages. One such disadvantage is that if the carrots are stored in the ground during the winter there is a risk that carrot flies will be able to survive until the next season, exacerbating the pest issue (Persson, 2004).
1.3.7 Transportation
Many necessary inputs to food production, as well as the food products themselves, have to be transported for long distances, making transportation a significant contributor to the GHG emissions of food products, especially for fruits and vegetables. The type of transportation, or transport mode, is significant, seeing as how GHG emissions can vary greatly. Transportation by regional air freight has a GWP of about 2 kg CO2 eq / t km whilst transportation by container ship has a GWP of about 0.01 kg CO2 eq / t km (Sonesson et al.,
9 2009). Additionally, some food products or inputs might require refrigeration, which increases the GWP significantly. Foods are generally high volume goods, meaning that transportation is limited by volume instead of weight. This means that denser foods that are easier to pack efficiently will have comparatively less environmental impact from the transportation stage. Transports of inputs to agricultural production are often very efficient, seeing as they can often be packed efficiently, transported in large quantities and seldom require refrigeration. Transport away from the farm is often less efficient, seeing as how the product is perishable. Transportation from warehouses to retailers is often inefficient, due to a combination of low load, slow driving and many stops along the way. The least efficient transportation distance is usually from the retailer to household, at least if that transportation is done by passenger car. Generally, transportation becomes less efficient further down in the supply chain (Sonesson et al., 2009).
1.3.8 Introduction to Life Cycle Assessment
Life cycle assessment is an environmental approach that provides a thorough overview of a product or process in terms of its environmental impact throughout its life cycle. A well done LCA will quantify the impacts of a product or system and identify the potential transfer of environmental impact from one life cycle stage to another. The standard methodology for a LCA is described in the ISO 14040 series from almost two decades ago and consists of the following phases: “Goal and Scope Definition”, “Life Cycle Inventory”, “Life Cycle Impact Assessment” and “Interpretation” (Curran, 2015).
Goal and Scope Definition includes identifying the purpose of the
LCA, boundaries of the study, the expected output as well as the assumptions made. The Life Cycle Inventory (LCI) quantifies the raw material inputs and energy use as well as compounds released into the environment associated with each part of the life cycle. The Life Cycle Impact Assessment (LCIA) quantifies the impacts associated with the results from the Life Cycle Inventory. The Interpretation stage has the purpose of analyzing the results and presenting them in a transparent manner (Curran, 2015). All parts of a LCA are interconnected, as seen in Figure 3, since the LCI and LCIA parts have to be interpreted in terms of the Goal and Scope Definition (Curran, 2015; Karlsson, 2011).
Figure 3: Visualization of the structure of Life Cycle Assessment (Modified from Knutsson, 2015).
10
1.3.9 LCA studies on Carrots
The available LCA literature on the environmental impact of carrot production is somewhat limited, and the results vary based on factors such as the region of production, boundary conditions and the methods used for production. Table 1 shows values for energy consumption and GHG emissions. The primary energy consumption is often expressed as CED, while the GHG emissions are expressed in terms of GWP. The values in Table 1 are from some of the available literature on the topic, based on production from different countries and using different system boundaries.
Table 1: Overview of the literature review of LCA studies on carrots.
Product type Country System
boundary FU CED [MJ] GWP [kg CO2 eq] Reference Conventional carrot France Cradle to farm 1 t 549-1798 48-104 Grasselly et al., 2017 Organic carrot Sweden Cradle to
consumer gate 1 t 2640 121 Bosona & Gebresenbet, 2018b Carrot, production not specified Sweden Cradle to retailer gate 1 kg 1.5 0.09 Karlsson, 2011 Organic carrot Finland and
Italy Cradle to retailer gate 1 kg 1.33 0.142 Raghu, 2014 Conventional carrot Finland and Italy Cradle to retailer gate 1 kg 1.88 0.280 Raghu, 2014
2. Materials and methods
A literature review has been made, as seen in section 1.3. The purpose of the literature review was partly to form a basis for comparison, as seen in Table 1, but also to amend any information missing from the second part of the project, which was a data inventory (see section 2.3). Finally, a sensitivity analysis was done, focusing on the assumptions made about transportation distances. The results were obtained using the LCA software SimaPro 8.5.2. The impact indicators examined and methods used can be seen in section 2.4.
2.1 Goal and scope
The goal of this study was to assess and compare the environmental impact of organic and conventional carrots produced and consumed in Sweden in terms of CED and GWP. Accordingly, the following research questions were addressed: Is there any difference in terms of environmental impact between organic and conventional carrots, and if so, which has a larger impact? What are the largest contributing factors to the environmental impact of the carrot life cycle? Regarding the scope of the study, the LCA analysis done was cradle to consumer gate. The major processes, from cultivation to supply of carrots to
11 consumer gate, have been considered in both the organic and conventional cases. Additionally, mulching was used as an alternative to pesticide use for the organic carrot case. The household food handling, cooking, consumption and waste management stages were outside of the scope of the study (see Figure 4). The functional unit (FU) of 1 kg of carrots at the farm was adapted. The losses downstream in the supply chain have been considered. The advantage of considering the FU at the farm, rather than the consumer gate, was the availability of data from SLU used in the analysis, see section 2.3.
2.2 System description
A simplified overview of the modeled system can be seen in Figure 4. Figure 5 corresponds to carrots before any post-harvest handling and Figure 6 depicts packaged carrots that are ready for retailing. The following sections will provide a more thorough explanation of the modeled system.
Figure 4: Simplified overview of the carrot life-cycle. The red line corresponds to the system boundary.
2.2.1 Agricultural production
Figure 5: Fresh organic carrots from Tångagård farm shop in Southern Sweden (https://www.tangagard.se/ accessed from Bosona & Gebresenbet, 2018b).
12
2.2.1.1 Pesticides and mulching
Pesticide use for the conventional carrot ccase was based on national average data from the cropping season 2005/2006 (Karlsson, 2011; The Swedish Board of Agriculture, 2008). The most common pesticides for conventional carrot cultivation in Sweden as of 2017 are Calypso SC 480, Mavrik and Karate 2,5 WG. However, out of these only Mavrik will be allowed to be used from 2019. Additonally, these pesticides are only permitted to be used a limited amount of times each season, making the alternatives to fully combat carrot flies and other pests limited (Mattsson & Johansson, 2017; The Swedish Board of Agriculture, 2018). Black polypropylene (PP) plastic has been assumed to be used as mulching material for the organic carrot case, which is allowed for organic production in the EU (Dvorak et al., 2010).
2.2.1.2 Fertilizer
The fertilization for the organic farming scenario was based on Mattsson, 1999 and assumed to be 20 000 kg of cow manure per ha, partly informed by the questionnaire answers. Manure is a very heterogeneous material, meaning that the concentration of plant nutrients varies greatly between different batches or samples. Generally, cow manure contains about 9.9 kg of N, 0.8 kg of P and 1.7 kg of K per t of manure after being stored for some time. If the manure is stored for longer the amount of N will decrease due to losses of NH3 associated with composting of manure (Mattsson, 1999).
The fertilization for the conventional farming scenario was based entirely on the questionnaires and assumed to be 750 kg of unspecified NPK fertilizer per ha, with a NPK ratio of 1-1-1.
2.2.1.3 Production and maintenance of farm machinery
The use of machinery for modern agricultural practices is absolutely necessary, as there is a large requirement of mechanical work for activities such as cultivation, spreading of fertilizer, irrigation, weeding and harvesting. The data for production, maintenance and repairs of farm machinery were based on Mattsson (1999). It has been assumed that both organic and conventional production systems use the same farming equipment, corresponding to the equipment used by the organic farm in Mattsson (1999).
13
2.2.2 Post-harvest handling
Figure 6: Packaged carrots, commonly sold at Swedish retailers. (Amanda Christensson)
2.2.2.1 Storage
In this study, carrots have been assumed to be stored in a cooling unit at the wholesaler for less than three months. See section 2.2.4 for estimated losses during the storage phase. Any materials required for storage, such as plastic wrapped wooden boxes, have been omitted from the assessment.
2.2.2.2 Washing and sorting
Before carrots are packaged they have to be washed and sorted, which has been assumed to occur at the wholesaler for this study. Washing can occur either before or after the storage phase, although most commercial producers wash before the storage, which has been assumed to be the case for this study. There is a lot of difference depending on the storage conditions, type of carrot as well as from year to year, so keeping detailed records is encouraged. The advantages of washing before storage are reduced risk of carrot staining from residual soil and removing the necessity for heated water as well as extra preparation during the winter months. The advantages of washing after storage are reducing the risk of damaging the carrots due to extra handling, beneficial bacteria remaining on the root surface and removing the need to air-dry the carrots before storage. Additionally, the harvest season is very busy for farmers, so if the washing is done at the farm it will take up a lot of time and attention (Johnnyseeds, n.d.). It should be noted that either way, carrots generally have to be washed before the sorting phase (Newtec, n.d.).
The Sorting of carrots can be done manually, but is usually done by optical sorters, which has been examined in this study. There are several technologies in use, but what is common across them is that they sort out carrots
14 that are discolored, defect, misshaped and foreign materials such as stones. This is done to deliver a consistent quality and high throughput with less labor requirements and losses, compared to manual sorting. Some sorting machines also sort the carrots by shape, size and quality (Tomra, n.d.; Newtec, n.d.).
2.2.2.3 Packaging
In this study, low-density polyethylene (PELD) packaging has been examined. There are several ways carrots could be packaged for sale at a retailer. The carrots could be sold as loose items (either washed or unwashed) or sold in some form of plastic packaging. It should be noted however that if the carrots are sold as loose items at least one plastic bag is required to weigh and carry the carrots anyway. PELD is commonly used as the plastic for packaging carrots, but this varies a lot from country to country, as there are many potential polymers to choose from. As an example, high-density polyethylene (HDPE) is commonly used as a secondary packaging material in Finland (Raghu, 2014).
The packaging process has a significant environmental impact due to the materials and energy required. However, plastic packaging provides an absolutely necessary function, seeing as how it protects the food from contamination and therefore keeps it hygienic enough to consume. Furthermore, the plastic packaging counteracts potential waste at the retailer, so ultimately the environmental impact from the packaging is a trade-off in terms of positive functions and negative environmental impact (Bosona & Gebresenbet, 2018b; Sonesson et al., 2009).
2.2.2.4 Retailing
Retailers have the important role of coordinating activities in the food supply chain, as they are in between the producers and consumers. The GHG emissions from retailing are generally relatively small. The factors that affect such emissions are energy use, mainly for refrigeration and freezers, and losses from the retailing. Additionally, leakage of refrigerant liquid can be considered as a potential environmental hazard from retailers that hasn’t been assessed in this report due to the omission of certain LCA indicators (Sonesson et al., 2009). Therefore, only electricity for refrigeration and losses from retailing has been considered in this study.
2.2.3 Transport
In this study, the transport distance for carrot packaging material was considered to be 50 km and done by truck with a capacity of 3.3 t, based on Bosona & Gebresenbet (2018b). Distances from farm to wholesaler and wholesaler to retailer are also based on Bosona & Gebresenbet (2018b) and are assumed to be 80 km and 50 km respectively (see Figure 7). Transportation from farm to wholesaler is assumed to be done by truck with a capacity of 32 t,
15 transportation from wholesaler to retailer is assumed to be done by truck with cooling and a capacity of 16 t and transportation of packaging material is assumed to be done by truck with a capacity of 3.3 t. The distance between the retailer and household is assumed to be 3 km and done by passenger car, based on Wärnhjelm (2011). Since transportation of inputs to agricultural production is generally very efficient (see section 1.3.7) transport of fertilizer, mulching material, pesticides and farming equipment has been omitted.
Due to the estimated losses (see section 2.2.4) 0.923 kg of carrots are transported from farm to wholesaler per FU, 0.86 kg of carrots are transported from wholesaler to retailer per FU and 0.67 kg of carrots are transported from retailer to household per FU. This resulted in a transportation of 73.84 kgkm per FU from farm to wholesaler and a transportation of 43.0 kgkm per FU from wholesaler to retailer. Additionally, 4g of PELD for carrot packaging were transported 50 km per FU, resulting in transportation of 0.2 kgkm per FU. Furthermore, the assumptions made about the mass allocation for carrot buying resulted in a total transport distance of 0.402 km from retailer to consumer.
Figure 7: Visualization of the assumed transport distances from farm to household.
2.2.4 Losses
A summary of the estimated losses can be seen in Table 2. It should be noted that the FU is 1 kg of carrots at the farm, so any losses further down in the life cycle have been accounted for. For instance, if 10% of the carrots are lost during the storage only the remaining amount will be considered for transportation, see section 2.2.3.
Carrots are assumed to be stored for less than one growth season. If carrots are stored for less time than an entire growth season, which corresponds to less than three months, it is expected that 14% of the yield will be lost at the retailer gate (see Table 2). Furthermore, losses of 30-35% of the yield are expected at the end of retailing (Stoessel et al., 2012).
16 Table 2: Losses at different stages of the carrot life cycle. Modified from Bosona & Gebresenbet (2018b).
Life cycle stage
Loss as share of total production [%] Source Adjusted* loss as share of total production [%]
Farm (not harvested) 5.0 Hartikainen et al., 2016 3.5
Farm (lost at harvest) 6.0 Hartikainen et al., 2016 4.2
Storage 9.0 Hartikainen et al., 2016 6.3
Post-harvest processes, excluding packaging
23 Hartikainen et al., 2016 16
Packaging 4.0 Hartikainen et al., 2016 2.8
Retailing 0.2 Hartikainen et al., 2016 0.2
Total losses after Farm 11.0 7.7
Total losses at retailer gates
(Farm + Storage)
20.0 14.0
Total losses at end of retailing
47.2 33.0
*Adjusted so that the total estimated loss is 33% [30%-35%] (Stoessel et al., 2012). Values from Hartikainen et al., 2016 were multiplied by 33 47.2⁄ and rounded to two significant digits, except for the retailing loss which hasn’t been adjusted.
2.3 Life Cycle Inventory
LCI is a crucial step of the LCA process. The data collected for the LCA can be either site specific average data, country based average data or process specific data (Bosona & Gebresenbet, 2018b). In this study, data has been collected from primary sources (farmers), the Ecoinvent database, scientific papers and reports from government agencies. Additionally, in some cases data was extracted from existing data sets in SimaPro. To improve the data quality, priority was given primary and secondary data related to Sweden. Particularly important data, such as carrot yield per hectare, has been crosschecked with data obtained from scientific papers and reports from the Swedish board of agriculture. This was done separately for the organic and conventional carrot cases, as there is a significant difference in yield between the two production systems, see Tables 3 and 4.
In this study, some primary data from five organic carrot producers, gathered in 2016, was obtained from the department of energy and technology at SLU in Uppsala. To supplement this data, two questionnaires were devised, one for carrot producers and one for retailers selling carrots, as seen in Appendix A1 and A2 respectively. The questionnaires were sent to 84 farmers and 105 retailers, in addition to being added to the newsletter of The Federation of Swedish Farmers. However, the response rate was very low. Answers from 5 organic farmers, 3 conventional farmers and 3 retailers were recieved. All 8 farmers that answered the questionnaire produce carrots at a comparatively small scale (0.1-5 ha). The allocation assumptions made during
17 data inventory not mentioned in the sections above have been described under section 2.4.2.
Table 3: Input data to SimaPro at different stages of organic carrot product cycle per FU. All quantities are rounded to 3 significant digits.
Description Unit Quantity Data source
Yield t /ha A 37.1 Average value obtained from questionnaire answers D
Farm activities
Fertilizer (cow manure) g 539 Mattsson, 1999 Plastic for mulching (PP) g 4.43 Raghu, 2014 Electricity for production of farm machinery MJ 0.0142 Mattsson, 1999 Fuel oil for production of farm machinery MJ 0.0104 Mattsson, 1999 Gas oil for production of farm machinery g 0.0263 Mattsson, 1999 B Natural gas for production of farm machinery g 0.0655 Mattsson, 1999 C Electricity for maintenance and repairs of
farm machinery
MJ 0.00914 Mattsson, 1999; Audsley 1996 Fuel oil for maintenance and repairs of farm
machinery
MJ 0.00391 Mattsson, 1999; Audsley 1996 Gas oil for maintenance and repairs of farm
machinery
g 0.0100 Mattsson, 1999; Audsley 1996 B Natural gas for maintenance and repairs of
farm machinery
g 0.0258 Mattsson, 1999; Audsley 1996 C Water for irrigation l 6.59 Bosona & Gebresenbet, 2018b;
Mattsson, 1999
Total electricity use for farm activities MJ 0.124 Average value obtained from questionnaire answers D Total diesel use for farm activities MJ 0.0976 Average value obtained from
questionnaire answers D E
Post-harvest processes
Electricity for storage MJ 0.333 Bosona & Gebresenbet, 2018b; Röös & Karlsson, 2013 G Water for washing carrots l 0.400 Bosona & Gebresenbet, 2018b;
Stoessel et al., 2012
Electricity for sorting and washing carrots MJ 0.000790 Bosona & Gebresenbet, 2018b F Plastic for packaging carrots (PELD) g 4.00 Bosona & Gebresenbet, 2018b;
Raghu, 2014
Electricity for packaging process MJ 0.00470 Bosona & Gebresenbet, 2018b F Electricity for cooling at retailer MJ 0.0325 Bosona & Gebresenbet, 2018b;
Karlsson 2011
Transportation
Packaging material delivery kgkm 0.200 H Transport from farm to wholesaler kgkm 73.84 I K Transport from wholesaler to retailer kgkm 43.0 L K Transport from retailer to consumer km 0.402 J K
A Indicated value is given per hectare. All other values are given per FU (1 kg of carrots at the farm). B from MJ gas oil to g done according to Berkeley (n.d.) (44.1 MJ = 1 kg).
C Conversion from MJ natural gas to g done according to Yan (2004) (34.6 MJ = 1m3) and Unitrove (n.d.) (1m3 = 0.712 kg)
D Value obtained based on land-area allocation.
E Conversion from litre diesel fuel to MJ done according to Berkeley (n.d.) (1 litre = 38.6 MJ).
F Quantities based on 20% losses from farm activities and storage and 34.2% in total losses at the end of
retailing. Based on Stoessel et al., 2012 and Hartikainen et al., 2016
G Short term storage assumed (up to 3 months)
H Transport distance of 50km with truck (3.3 t capacity) assumed. Based on Bosona & Gebresenbet (2018b) I Transport distance of 80km with truck (32 t capacity) assumed. Based on Bosona & Gebresenbet (2018b) J Two trips of 3km each with passenger car assumed, Based on Wärnhjelm, 2011. Allocation done by mass;
10kg of food purchased of which 1kg is carrots, so 10% of transport distance allocated to 1kg of carrots.
K Quantities based on 7.7% losses after farm activities, 14% losses after storage and 32.9% in total losses at
the end of retailing, see Table 2
L Transport distance of 50km with truck (with cooling and 16 t capacity) assumed. Based on Bosona &
18 Table 4: Input data to SimaPro at different stages of conventional carrot product cycle per FU. All quantities are rounded to 3 significant digits.
Description Unit Quantity Data source
Yield t /ha A 44.0 Average value obtained from questionnaire answers D
Farm activities
Fertilizer (NPK) g 17.0 Average value obtained from questionnaire answers D
Herbicide g 0.0386 Karlsson, 2012
Fungicide g 0.00909 Karlsson, 2012
Insecticide g 0.00477 Karlsson, 2012
Plastic for packaging of fertilizer and pesticides (PELD)
g 8.04 Raghu, 2014 Electricity for production of farm machinery MJ 0.0119 Mattsson, 1999 Fuel oil for production of farm machinery MJ 0.00877 Mattsson, 1999 Gas oil for production of farm machinery g 0.0222 Mattsson, 1999 B Natural gas for production of farm machinery g 0.0552 Mattsson, 1999 C Electricity for maintenance and repairs of
farm machinery
MJ 0.00770 Mattsson, 1999; Audsley 1996 Fuel oil for maintenance and repairs of farm
machinery
MJ 0.00330 Mattsson, 1999; Audsley 1996 Gas oil for maintenance and repairs of farm
machinery
g 0.00845 Mattsson, 1999; Audsley 1996 B Natural gas for maintenance and repairs of
farm machinery
g 0.0217 Mattsson, 1999; Audsley 1996 C Water for irrigation l 5.55 Bosona & Gebresenbet, 2018b;
Mattsson, 1999
Total electricity use for farm activities MJ 0.104 Average value obtained from questionnaire answers D Total diesel use for farm activities MJ 0.0822 Average value obtained from
questionnaire answers D E
Post-harvest processes
Electricity for storage MJ 0.333 Bosona & Gebresenbet, 2018b; Röös & Karlsson, 2013 G Water for washing carrots l 0.400 Bosona & Gebresenbet, 2018b;
Stoessel et al., 2012
Electricity for sorting and washing carrots MJ 0.000790 Bosona & Gebresenbet, 2018b F Plastic for packaging carrots (PELD) g 4.00 Bosona & Gebresenbet, 2018b;
Raghu, 2014
Electricity for packaging process MJ 0.00470 Bosona & Gebresenbet, 2018b F Electricity for cooling at retailer MJ 0.0325 Bosona & Gebresenbet, 2018b;
Karlsson 2011
Transportation
Packaging material delivery kgkm 0.200 H Transport from farm to wholesaler kgkm 73.84 I K Transport from wholesaler to retailer kgkm 43.0 L K Transport from retailer to consumer km 0.402 J K
A Indicated value is given per hectare. All other values are given per FU (1 kg of carrots at the farm). B from MJ gas oil to g done according to Berkeley (n.d.) (44.1 MJ = 1 kg).
C Conversion from MJ natural gas to g done according to Yan (2004) (34.6 MJ = 1m3) and Unitrove (n.d.) (1m3 = 0.712 kg)
D Value obtained based on land-area allocation.
E Conversion from litre diesel fuel to MJ done according to Berkeley (n.d.) (1 litre = 38.6 MJ).
F Quantities based on 20% losses from farm activities and storage and 34.2% in total losses at the end of
retailing. Based on Stoessel et al., 2012 and Hartikainen et al., 2016
G Short term storage assumed (up to 3 months)
H Transport distance of 50km with truck (3.3 t capacity) assumed. Based on Bosona & Gebresenbet (2018b) I Transport distance of 80km with truck (32 t capacity) assumed. Based on Bosona & Gebresenbet (2018b) J Two trips of 3km each with passenger car assumed, Based on Wärnhjelm, 2011. Allocation done by mass;
10kg of food purchased of which 1kg is carrots, so 10% of transport distance allocated to 1kg of carrots.
K Quantities based on 7.7% losses after farm activities, 14% losses after storage and 32.9% in total losses at
the end of retailing, see Table 2
L Transport distance of 50km with truck (with cooling and 16 t capacity) assumed. Based on Bosona &
19
2.4 Impact assessment methodology
2.4.1 Impact categories and methods
The burden on the environment that a product is responsible for can be assessed using either input-related indicators, such as water use, land use and energy consumption or output-related indicators, such as eutrophication potential, acidification potential and GHG emissions (Curran, 2015; Notarnicola et al., 2015). One input-related indicator (CED) and one output-related indicator (GWP) have been examined for the organic and conventional cases. CED was used to obtain the primary energy demand of the carrots, which is all energy extracted from nature throughout the carrots life cycle (Arvidsson & Svanström, 2015). CED was quantified using the method Cumulative Energy Demand V1.10 in SimaPro. GWP has to be estimated using a time horizon, since the concentrations of GHGs in the atmosphere will vary over time. For this study GWP100 was examined, since it’s generally the standard. GWP100 was quantified using the method ReCiPe 2016 Midpoint (H) V1.02 in SimaPro, which uses conversion factors from the fifth assessment report from the IPCC (Myhre et al., 2013).
2.4.2 Allocation, assumptions and limitations
Allocation
In some cases of fruit and vegetable supply, some part of the food waste can be used for animal feed (Karlsson, 2011; Hartikainen et al., 2016). In such cases, mass allocation should be applied. In this study, no alternative use of food waste was considered. Losses along the downstream of the supply chain have been taken into account using mass allocation however. The reason for this is to obtain reasonable values for the environmental burden from the LCIA results.
All allocation from the questionnaire data has been based on land-area. Data in SimaPro has been based on mass allocation whenever possible. Additionally, there is the problem of allocating the impact from carrots when lots of different products are purchased from the retailer at the same time, which is commonly the case. The impact from carrots on the transportation between retailer and household was therefore based on mass.
Assumptions
No transformation of land usage
Manure used as fertilizer for organic production and NPK fertilizer with a NPK ratio of 1-1-1 used by conventional farmers
Organic farmers use no pesticides, but use mulching with PP plastic instead
Carrots are stored for a short time duration (up to 3 months) at the wholesaler and are then transported as loose items directly to the retailer
20
Losses of 7.7% after transport from the farm, 14% after storage and 32.9% at the end of retailing have been assumed. However, values from Bosona & Gebresenbet (2018b) are based on losses of 20% after storage and 34.2% at the end of retailing
Losses are identical for organic and conventional carrots
Sorting, washing and packaging is done at the wholesaler
Swedish average energy mix used for electric consumption, obtained from the SimaPro database Ecoinvent 3
Consumers buy 10kg of total food products per trip to the retailer, of which 1kg is carrots
Limitations
Only carrot production in field has been considered, so private cropping and carrot production in greenhouses has been excluded
End-of-life processes and all processes at the household, such as refrigeration and cooking, have been excluded
Any materials required for the storage facilities and any containers for transportation of the carrots haven’t been included in the analysis
Transport of the farming equipment, pesticides, mulching material and fertilizer to the farm has been omitted
Production of optical sorting machines has been omitted
Only small scale carrot producers were examined (0.1-5 ha carrot production)
Due to the low response rate of the questionnaires, the sample size of the obtained data is low
2.4.3 Sensitivity analysis
A sensitivity analysis was done to understand how different transportation distances affect the energy demand and emission. The total CED and GWP were quantified for the conventional carrot life cycle for seven different cases, as seen in Table 5.
Table 5: All modeled cases made for the sensitivity analysis.
Case name Description
Original case No transport distances altered, i.e. 80 km from farm to wholesaler, 50 km from wholesaler to retailer and 3 km from retailer to household
Case A Distance between retailer and household set to 0, which corresponds to consumers walking or riding a bike to and from the retailer
Case B Distance between retailer and household doubled
Case C Distance from farm to wholesaler halved
Case D Distance from farm to wholesaler doubled
Case E Distance from wholesaler to retailer halved