Radiological Measurements in Total Hip Arthroplasty
Ph.D. Thesis by
Bariq Al-Amiry, M.D.
Department of Surgical and Perioperative sciences
Main supervisor Associate Professor Arkan Sayed-Noor Department of surgical and perioperative sciences Umeå University Co-supervisor Associate Professor Torkel Brismar Department of clinical science, intervention and technology Karolinska University Co-supervisor Professor Seppo Koskinen Department of clinical science, intervention and technology Karolinska University Published articles have been reprinted with permission from the publishers Responsible publisher under Swedish law: the Dean of the Medical Faculty This work is protected by the Swedish Copyright Legislation (Act 1960:729) ISBN: 978-91-7601-943-6 ISSN: 0346-6612
To the memory of my parents especially my mother,
Nidaa Al-Najjar, you were and still the inspiration of my life.
“The best view comes after the hardest climb”
Contents
: PAGE Abstract 5 Abstract in Swedish language 8 List of papers 12 List of abbreviations 11 1. Introduction 1.1 Background 13 1.2 Hip joint biomechanic 15 1.3 Radiological measurements in total hip arthroplasty 16 1.4 Parameters affecting the outcome of THA 22 1.5 Clinical assessment in total hip arthroplasty, preoperative and postoperative 23 2. Aims 24 3. Hypotheses 25 4. Patients and methods 26 4.1 Study I 28 4.2 Study II 31 4.3 Study III 33 4.4 Study IV 35 5. Results 5.1 Study I 36 5.2 Study II 38 5.3 study III 41 5.4 Study IV 44 6. Discussion 47 6.1 limitation and strengt 54 7. Conclusion 56 8. Implications for future research 57 9. Acknowledgements 58 10. References 60 11. Appendix 67 12. Reprinted studies I-IV 70Abstract:
Every year, about 1 million patients worldwide and 20000 patients in Sweden undergo total hip arthroplasty (THA). This type of operation is considered a successful, safe and cost-effective procedure to regain mobility and restore hip joint function in patients suffering from severe hip joint disease or trauma. The main goals of the operation are to relief the pain, improve quality of life (QoL) and to restore the biomechanical forces around the hip with appropriate femoral offset (FO), leg length and proper component position and orientation. The radiographic preoperative planning and postoperative evaluation of these parameters require good validity, interobserver reliability and intraobserver reproducibility. Most patients are satisfied after THA, although this treatment still has its complications. About 10 % of THA patients report persistent pain and suboptimal functional outcome and QoL at long-term follow-up. The absolute number of dissatisfied patients is expected to rise given the increase in the annual number of THA performed. Therefore, every effort should be made to investigate factors that possibly influence THA outcome. The data available about the influence of preoperative radiological severity and symptom duration of OA on the outcome of THA are scarce and contradictory. Further studies even needed to evaluate the effect of obesity on post-operative THA radiological measurements.
The aims of this thesis:
1. To evaluate the interobserver reliability and intraobserver reproducibility of the radiological measurements of postoperative global FO, leg length discrepancy (LLD) and acetabular cup inclination and anteversion and to evaluate the concurrent validity of a new FO measurement method (the Sundsvall method) by comparing it to a standard method.2. To analyze the postoperative radiographs of THA patients with leg lengthening and FO reduction to determine whether the problem is related to the stem, cup or both.
3. To evaluate the influence of preoperative radiological severity and symptom duration of OA on the postoperative functional outcome, QoL and abductor muscle strength. 4. To evaluate the effect of BMI on post-THA radiological restoration of FO and leg length as well as acetabular cup positioning.
Study I: A prospective cohort study of 90 patients with primary unilateral OA treated
with THA. Global FO using the Sundsvall method, global FO (standard method), LLD, acetabular cup inclination and anteversion were measured on postoperative radiographs. The interobserver reliability and intraobserver reproducibility were tested using three independent observers. We found that the Sundsvall method is as reliable as the standard method and the evaluated radiographic measurement methods have the required validity and reliability to be used in clinical practice.
Study II: A prospective cohort study of 172 patients with unilateral primary OA treated
with THA. LLD and global FO were measured on postoperative radiographs. Patients with lengthening of the operated leg ≥ 10mm (n=41) and patients with reduction of global FO > 5mm (n=58) were further studied to investigate the amount of lengthening and global FO reduction that took place in the stem and in the cup compared with the contralateral side. The interobserver reliability and intraobserver reproducibility were tested using two independent observers. We found that post-THA lengthening of the operated leg ≥ 10mm was mainly caused by improper placement of the femoral stem, whereas a decrease of global FO > 5 mm was caused by improper placement of both acetabular and femoral components. The radiological measurement methods used showed substantial to excellent interobserver reliability and intraobserver reproducibility and are therefore clinically useful.
Study III: A prospective cohort study, 222 patients were included. Preoperatively, we
evaluated the function with the Western Ontario and McMaster Universities Osteoarthritis (WOMAC) index and QoL with EQ-5D. At 1-year after THA, the same scores and also hip abductor muscle strength were measured in 222 patients. We divided the cohort twice, first according to the radiological OA severity [Kellgren-Lawrence classification (KL)] and then according to the OA symptom duration. We investigated whether the preoperative KL classification and symptom duration influenced the 1-year WOMAC (primary outcome measure) or EQ-5D and abductor muscle strength (secondary outcome measures). We found that preoperative radiological OA severity and symptom duration had no influence on the primary or the secondary outcomes of THA.
Study IV: In this prospective cohort study, 213 patients were included. BMI was
documented preoperatively. We evaluated the effect of BMI, gender, age, surgeon experience, preoperative osteoarthritis grade and preoperative symptom duration on the following postoperative THA radiological parameters: postoprtaive FO restoration and LLD as primary outcomes, and cup anteversion and cup inclination as secondary
The main conclusions of this thesis are:
• The radiographic measurement methods of LLD, global FO, cup inclination and anteversion have the required validity and reliability to be used in clinical practice. The new method in measuring the global FO (Sundsvall method) has the required reliability to be used in the clinical practice.
• Lengthening of the operated leg is mainly caused by improper femoral stem positioning while global FO reduction results from improper positioning of both acetabular and femoral components. Surgeons should be aware of these operative pitfalls in order to minimize component malpositioning.
• The preoperative radiological OA severity and symptom duration had no influence on the outcome of THA and should probably not affect the decision about timing the operative intervention.
• Increased BMI showed a negative effect on restoration of post-THA leg length but not on restoration of FO or positioning of the acetabular cup. Age, gender, OA duration or radiological severity and surgeon’s experience showed no relation to post-THA restoration of FO, leg length or cup positioning. Keywords:
Total hip arthroplasty; leg length discrepancy; femoral offset; WOMAC; quality of life; radiographic measurements; Kellgren-Lawrence; duration; acetabular cup; inclination; anteversion; BMI.
Abstrakt på svenska (Abstract in Swedish language):
Varje år opereras ungefär 1 miljon patienter runt om i världen och 20,000 patienter i Sverige med en total höftledsprotes (THA). Höftledsprotesoperation anses vara en av de mest framgångsrika, säkra och kostnadseffektiva kirurgiska åtgärderna med ett syfte att smärtlindra, återställa rörligheten och förbättra livskvaliteten. Höftleden drabbas av artros, åldersrelaterad sjukdom som orsakar destruktion av leden. Vid operation med THA är det viktigt att återställa de biomekaniska krafterna runt höftleden med en adekvat så kallad femoral offset (FO), avståndet mellan höftens rörelsecentrum och mitten av bäckenet, postoperativ benlängdsskillnad (BLS) och ett tillfredsställande
komponentläge. Den preoperativa planeringen och den postoperativa
röntgenbedömningen av dessa parametrar kräver god tillförlitlighet, det vill säga validitet och reproducerbarhet både mellan olika bedömare och vid upprepade mätningar av samma bedömare. Således är radiologiska mätningar före och efter THA oerhört viktiga för att få bästa resultat efter THA. Det finns inte tillräckligt med information i litteraturen om effekten av den preoperativa radiologiska artrosgraden och symptomduration av artrosen på utfallet av THA. Dessutom behövs ytterligare forskning för att studera effekten av obesitas på de radiologiska mätningarna efter THA. Syftet med denna avhandling var:
(1) Att utvärdera validitet och reliabilitet av en ny metod ”Sundsvalls metod” för att mäta global FO genom att jämföra den med den gällande standardmetoden samt studera tillförlitlighet av de radiologiska mätningarna av postoperativa BLS, FO, cup inklination och anteversion efter THA.
(2) Att radiologiskt undersöka i vilken av komponenterna (stam eller cup) som förändringen i FO och BLS verkar vara förlagd. (3) Att undersöka effekten av artrosgraden på röntgenbilder och symptomduration före THA på utfallet efter operationen. (4) Att studera effekten av överviktighet på röntgenmätningar efter THA.
Studie I: En prospektiv kohortstudie med 90 patienter som behandlats med THA på
grund av primär unilateral koxartros. På de postoperativa röntgenbilderna uppmättes globala FO (Sundsvalls metodologi), globala FO (standardmetod), BLS, cup inklination och anteversion. Reliabilitet och reproducerbarhet bedömdes mellan tre oberoende observatörer. Vi fann att global FO (enligt Sundsvalls metodologi) är lika tillförlitlig som den nuvarande standardmetoden och de utvärderade radiologiska mätmetoderna har hög validitet och reliabilitet och kan således användas i klinisk praxis. Studie II: En prospektiv kohortstudie med 172 patienter som behandlats med THA för en primär unilateral koxartros. På de postoperativa röntgenbilderna uppmättes BLS och globala FO. Patienter med förlängning ≥ 10mm (n=41) och patienter med minskning av globala FO > 5 mm (n=58) studerades för att mäta förlängning och global FO minskning som sitter i stammen eller i cup jämfört med kontralaterala sidan. Reliabilitet och reproducerbarhet bedömdes av två oberoende observatörer. Vi fann att en BLS över 10 mm sitter framför allt i stamkomponenten i lårbenet medan en minskning i FO över 5 mm sitter i båda stam och cup. De radiologiska mätmetoderna har hög reliabilitet och reproducerbarhet och kan således användas i klinisk praxis. Studie III:
En prospektiv kohortstudie med 222 patient som behandlats med THA för en primär unilateral koxartros. Vi har utvärderat följande före samt ett år efter operationen: funktionen enligt WOMAC, livskvalitet enligt EQ-5D samt styrka av abduktormuskel (endast efter operationen). Antalet patienter har indelats i två grupper, den ena är baserad på radiologisk artrosgrad (Kellgren-Lawrence klassifikation, KL), medan den andra är baserad på artros symptomduration. Vi har studerat vidare om preoperativ artrosgrad enligt KL och symptomduration påverkar WOMAC som primärt utfall samt EQ-5D och styrka av abduktormuskel som sekundärt utfall. Vi fann ingen påverkan av preoperativ artrosgrad eller symptomduration på de primära eller sekundära utfallen.
Studie IV:
En prospektiv kohortstudie med 213 patient. BMI dokumenterades innan THA. Vi har jämfört effekten av BMI, ålder, kön, erfarenhet av kirurgen, symptomduration före operation samt artrosgraden före operation avseende postoperativa radiologiska mätningar: BLS, FO, cup inklination och cup anteversion. Vi jämförde alltid den opererade höften med den andra ”normala” höften. Resultatet visar att patienter med hög BMI har ökad risk att få benlängdsskillnad.
De viktigaste slutsatserna i denna avhandling är:
(1) De radiologiska mätmetoderna av BLS, FO, acetabulära komponentens inklination och anteversion har hög validitet och reliabilitet, vilket kan användas i klinisk praxis. Den nya metoden (Sundsvalls metod) är lika bra som den standardiserade metoden för att mäta FO.
(2) En förlängning av det opererade benet orsakas främst av en positionering av stamkomponenten i lårbenet medan förlust av FO beror på otillfredsställande placering av både stam och den acetabulära komponenten. Kirurger bör vara medvetna om dessa operativa fallgropar för att optimera det kirurgiska resultatet.
(3) Preoperativ artrosgrad och symptomduration har ingen effekt på beslutet när THA skulle utföras.
(4) Ökning av BMI orsakar mer risk att få postoperativ radiologisk benlängdsskillnad, därför måste ortopedläkare ta hänsyn till detta vid utförande av THA operation.
Abbreviations:
AP Anteroposterior B&A Bland and Altman BMI Body Mass Index CCD Center collum diaphyseal angle CI Confidence interval CLS Cementless Spotorno stem CT Computed tomography EQ-5D EuroQol index FO Femoral offset ICC Interclass correlation coefficient KL Kellgren-Lawrence LLD Leg length discrepancy MRI Magnetic resonance imaging OA Osteoarthritis QoL Quality of life r Pearson correlation coefficient SD Standard deviation THA Total hip arthroplasty VAS Visual analogue scale WOMAC Western Ontario and McMaster Universities Osteoarthritis Index
List of publications:
I. Mahmood SS, Al-Amiry B, Mukka SS, Baea SS, Sayed-Noor AS. Validity,
reliability and reproducibility of plain radiographic measurements after total hip arthroplasty. Skeletal Rdiol. 2015 Mar; 44(3):345-51.
II. Al-Amiry B, Mahmood S, Krupic F, Sayed-Noor AS. Leg lengthening and
femoral-offset reduction after total hip arthroplasty: where is the problem - stem or cup positioning? Acta Radiol. 2017 Sep; 58(9):1125-1131.
III. Al-Amiry B, Gaber J, Kadum B, Brismar T, Sayed-Noor AS. The Influence of
Radiological Severity and Symptom Duration of Osteoarthritis on Postoperative Outcome After Total Hip Arthroplasty –Prospective cohort study. J Arthroplasty 2018 Feb;33(2):436-440.
IV. Al-Amiry B, Pantelakis G, Kadum B, Brismar T, Sayed-Noor AS. Does body
mass index affect restoration of femoral offset and leg length and cup positioning after total hip arthroplasty? (Submitted).
1. Introduction:
1.1 Background
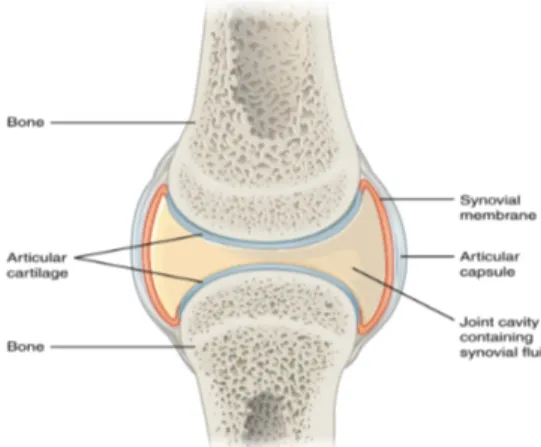
The hip is one of the largest joints of the human body. It is a ball-and-socket joint. The socket is formed by the acetabulum, which is part of the large pelvis bone. The ball is the femoral head, which is the upper end of the femur. The joint capsule is important to the function of hip joint. It seals the joint space, provides passive stability by limiting movements, and provides active stability via its proprioceptive nerve endings and form articular surfaces for the joint. It is a dense fibrous connective tissue that is attached to the bones via specialized attachment zones and forms a sleeve around the joint. Each capsule consists of two layers or membranes: an outer (fibrous membrane, fibrous stratum) composed of avascular white fibrous tissue and an inner (synovial membrane, synovial stratum), which is a secreting layer (diagram A).
Hip osteoarthritis is a degenerative joint disease. It affects the cartilage (the hard but slippery tissue that covers the ends of bones where they meet to form a joint) in older people. Healthy cartilage allows bones to glide over one another. It also absorbs energy from the shock of physical movement. In osteoarthritis, the surface layer of cartilage breaks and wears away. This increases the friction between the bones causing pain and stiffness of the joint. Over time, the joint may lose its normal shape. Also, small deposits of bone, called osteophytes or bone spurs, may grow on the edges of the joint. Bits of bone or cartilage can break off and dislocate into the joint space causing more pain and damage.
The main surgical procedure in orthopaedics at the turn of two centuries is without any doubt THA. It started in 1840. A German physician, Dr.Gluck, was most likely the first to implant artificial joints (ivory) in the 1880s. After several trials during the first half of the 20th century, the first joint replacements in clinical practice were femoral head prostheses, including the one developed by Jean and Robert Judet in 1948 in France. In THA, a major advance was made in 1962 by Sir John Charnley in the United Kingdom who introduced metal-on-plastic bearings (Courpied et al 2011).
More than 1 million THA are done every year worldwide, and this number is projected to double within the next two decades. Symptomatic osteoarthritis, ie persistent pain and disability, is the indication for surgery in more than 90% of patients. The incidence is increasing because of an ageing population and the obesity epidemic (Pivec et al
2012). In Sweden about 20.000 THA operations per year are performed.
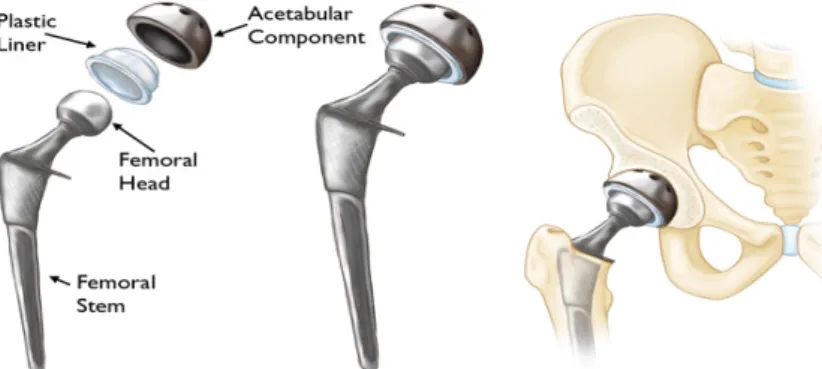
THA is considered a successful and cost-effective procedure to regain pain-free mobility for patients with hip osteoarthritis (OA) by replacing the damaged bone and cartilage with prosthetic components (Ethgen O et al 2004, Judge A et al 2012) (diagram B). The main goals of THA are to alleviate pain and improve function and quality of life (QoL). Radiological measurements are essential for successful THA surgery. Preoperative radiological evaluation helps the surgeon to plan the surgical intervention and choose the suitable prosthesis. Postoperative radiological control is routinely used for quality control to assess the positioning of the prosthetic components, postoperative leg length and FO (width of the hip joint after THA) and to be used as a base-line reference for future follow-up. Accurate and reliable radiological measurements are therefore very important.
In clinical praxis, we use plain radiographs for preoperative planning and postoperative evaluation of the THA. Computed Tomography (CT) has been shown to be the gold standard in this regard (Wines et al 2006, Sabharwal et al 2008, Pasquier et al 2010). However, due to high cost, radiation exposure and availability in relation to the huge number of planned THA operations make their routine use is impractical and limited to selected cases. Therefore, plain radiographs are still used for this purpose and rely on proper standardization of radiographs and measurement techniques are necessary to minimize their limitations.
Diagram B: Diagram of the prosthetic hip in relation to the hip joint. Reproduced with permission from orthoinfo. ©American Academy of Orthopaedic Surgeons. https://www.orthoinfo.org/
1.2 Hip biomechanics:
The hip joint functions effectively as a fulcrum resulting in a state of equilibirium between the body weight and the opposing hip abductors (Radin EL 1980). The outcome of this interplay of opposing forces is the ability to maintain a lever pelvis throughout the gait cycle. The abductor muscles generate a force that is larger than the body weight becuase the lenght of the lever arm that acts between the femoral head and the insertion of the hip abductors (A in figure 1) is markedly smaller than that between the femoral head and body weight (B in figure 1). An increase in FO increases the lever arm of the abductor muscles, therby reducing the abductor muscle force required for the normal gait. This in turn reduces the resultant reactive force across the hip joint and hence results in minimizing the polyethylene wear. In addition, lateralization of the femoral shaft relative to the hip center tends to decrease the prevalance of femoropelvic impingement while consequently improving soft-tissue tensioning (Charles et al 2005). A leg length discrepancy (LLD) ≥ 20 mm creates biomechanical changes to hip joint load both on the long and the short side and the effects seem to be larger on the short side. The increased stress may cause problems in the long term (Wretenberg et al 2008).
Figure 1: Illustration of the hip joint as it functions as a fulcrum balancing the force of body weight with the force generated by the hip abductors.
1.3 Radiological measurements in THA:
In study 1, we evaluated the interobserver reliability and intraobserver reproducibility of measurement of FO, LLD, acetabular cup inclination and anteversion and the validity of the Sundsvall method of FO measurement.Leg length discrepancy (LLD):
Commonly, LDD is measured clinically and radiologically before and after THA. The clinical measurement can be carried out while the patient in the supine position byusing a measuring tape. The distance between the anterior superior iliac spine (ASIS) and the medial malleolus shows the real LLD, while the distance between the ASIS and umbilicus shows the apparent LLD (Maloney et al 2004). The latter can be affected by pelvic obliquity and lumber spine deviation revealing non-true LLD. The radiological measurement is performed by an AP view of the pelvis. Fixed points in the pelvic bone are used as reference points and the distance between these points and fixed points at the proximal femur such as the lesser trochanter or the centre of the femoral head is measured on each side. One example for the fixed point is the teardrop point, also known as U-figure, which is defined as a radiographic feature seen on pelvic x-rays and results from the the end-on projection of a bony ridge running along the floor of the acetabular fossa. Other example for the fixed point in the pelvic bone is the lower edge of ischial tuberosities, (figure 2)(Maloney et al 2004, Matsuda et al 2006, Clark et al 2006, Iagulli et al 2006).
In the studies included in this thesis, the LLD was defined as the difference in perpendicular distance in millimetres between a line passing through the lower edge of the teardrop points to the corresponding tip of the lesser trochanter. This method has been reported to be as reliable as the orthoroentgenogram, which is a radiographic study used to evaluate anatomic leg length and calculate leg-length discrepancies. This study utilizes a long ruler placed on the film, and three radiographs including bilateral hips, knees and ankles (Konyves et al 2005, Woolson ST et al 1999), (figure 3). Goodman et al (1988) recommended the use of the teardrop points as a landmark for measurements rather than other points in the pelvis, because the vertical position of the teardrop points is not affected significantly by rotation of the pelvis. LLD is a common complication of THA (Kitada et al 2011) with lengthening being more noticeable to the patient than shortening (Desai et al 2013). It has been associated with patient dissatisfaction (Wylde et al 2009), gait disorder (Tanaka et al 2010), greater trochanter pain (Sayed-Noor et al 2006), nerve palsy (Hofmann et al 2000), low back pain and increased oxygen consumption and heart rate (Clark et al 2006) and higher incidence of shoe lift use as well as residual pain (Mahmood et al.2015). It is therefore also a major cause of litigation (McWilliams et al 2013).
LLD can be the result of improper stem and/or cup positioning e.g. high positioning of the stem in the femoral canal secondary to high osteotomy cut or poor component version that obliges the surgeon to increase soft tissue tension for stability with resulting lengthening (McWilliams et al 2013).
The incidence of LLD after primary THA has been reported to range from 1% to 27% (Desai et al 2013) differing from 6 to 35 mm (White et al 2002, Maloney et al 2004). However, the degree of clinically significant LLD is still a matter of debate (Benedetti et al 2010, Meermans et al 2011). Generally, LLD < 10 mm is considered acceptable by most clinicians. O’Brien et al (2010) suggested that LLD after THA should be kept to less than 10 mm as greater LDD is symptomatic in otherwise healthy people. Benedetti et al
(2010) showed that LLD in the range of 1–20 mm did not impair the symmetry of time-distance parameters
(
in terms of asymmetry and arrhythmy) of hip kinematics andkinetics during gait and stairs walking. Also, Gurney et al (2002) concluded that in older adults, a LLD of between 20 and 30 mm is the critical limit above which there is increased pulmonary, cardiac and neuromuscular physiological loading. Perception of LLD after THA is reported in one third of operated patients and affected patients report lower functional outcome (Wylde et al 2009). Plaass et al (2011) reported negative marginal effect of LLD after THA with more pain in patients with lengthening and more limping in patients with shortening. Konyves et al (2005) found that lengthening after LLD was associated with lower functional outcome up to 12 months postoperatively.
Figure 3: A radiographic measurement of the leg length discrepancy. The difference in perpendicular distance in millimeter between a line passing through the lower edge of the teardrop points to the corresponding tip of the lesser trochanter.
Femoral offset:
The FO is an important parameter in THA. FO is defined as the addition of the distance between the longitudinal axis of the femur to the centre of the femoral head and the distance from the centre of the femoral head to a perpendicular line passing through the medial edge of the ipsilateral teardrop point of the pelvis (Lecerf et al 2009), (figure 4).
Failure to fully restore FO after THA is not uncommon in clinical practice. Inadequate restoration of FO after THA can be related to implant instability, hip impingement, increased joint reaction forces, increased polyethylene wear, loosening and an inability to maintain a lever pelvis throughout the gait cycle (McGrory et al 1995, Sakalkale et al 2001, Asayama et al 2005, Malik et al 2007, Lecerf et al 2009, Little et al 2009, Sariali et al 2009). On the other hand, increasing FO has been hypothesized to improve the hip lever arm and subsequently the range of motion and abductor muscle strength, reduce prosthetic instability and polyethylene wear and more use of walking aids (McGrory et al 1995, Yamaguchi et al 2004, Asayama et al 2005, Marx et al 2005, Malik et al 2007, Sariali et al 2009, Kiyama et al 2010, Mahmood et al.2015). There is also a new method to measure the FO, The Sundsvall method. It is defined as a horizontal distance between the femoral axis and the midline of the pelvis at the height of the lateral tip of the greater trochanter (Kjellberg et al 2009) (figure 5). We evaluated the validity of this method in measuring the FO comparing to the standard method. Figure 4: The standard radiographic method for the measurement of the global FO. The addition of the distance between the longitudinal axis of the femur to the centre of the femoral head and the distance from the centre of the femoral head to a perpendicular line passing through the medial edge of the ipsilateral teardrop point of the pelvis.
Figure 5: A radiolographic measurement of the global FO according to Sundsvall method. A horizontal distance between the femoral axis (a line drawn through the centre of the femoral shaft) and the midline of the pelvis at the height of the lateral tip of the greater trochanter.
Acetabular cup positioning
The orientation of the acetabular component is defined by two components: 1- Inclination, which is the angle between a line drawn along the angles of the rim of the cup and transischial line on the AP hip radiograph, (figure 6).2- Anteversion, which is the angle between a line drawn across the face of the acetabulum and a line perpendicular to the horizontal plane of the patient on lateral hip radiograph, (Nho et al 2012), (figure 7).
The optimal orientation of the cup has been proposed as 45± 10° of inclination and 15 ± 10° of anteversion, based on the method of Lewinnek (Lewinnek et al 1978, Murray et al 1993, Sarmiento et al 2006, Yoon et al 2008). Whereas inclination can easily be measured on AP radiographs, version is more difficult to measure. Version of the acetabular component can be measured accurately using CT scans, and there are a variety of methods of measuring it on plain AP or cross-table lateral radiographs (Nho et al 2012). An ideal method should be both accurate and reproducible.
Figure 6: The radiolographic measurement of the acetabular cup inclination. It is defined as the angle in degrees between a line drawn along the angles of the rim of the cup and transischial line (a line drawn between the most inferior point of the ischial tuberosities). Figure 7: The radiolographic measurement of the acetabular cup anteversion. It is defined on the lateral radiograph as the angle formed by the intersection of a line drawn across the face of the acetabulum and a line perpendicular to the horizontal plane.
All images were digitally acquired using the Picture Archiving and Communication System (PACS) (Impax: Agfa, Antwerp, Belgium), and all measurements on radiographs were subsequently made on a 19-inch LCD monitor using PACS software.
1.4 Parameters affecting the outcome of THA:
Although most patients are satisfied after THA, the operation still has its complications. About 10 % of THA patients report persistent pain and suboptimal functional outcome at long-term follow-up (Jones CA et al 2007, Anakwe RE et al 2011). The absolute number of dissatisfied patients is expected to rise given the increase in the annual number of THA performed as mentioned above. Hence, every effort should be made to investigate factors that possibly influence THA outcome. There are many patient-related parameters thought to affect the outcome of THA such as age (worse with increasing age), sex (worse in women), co-morbidities, BMI, duration of symptoms before the operation, degree of radiological severity of OA of the hip before THA, cultural and socioeconomic background as well as patient’s expectations. Preoperative anxiety and depression is also a predictor of unsatisfactory outcome after operation (Benditz A et al 2017).
Reports on the influence of preoperative radiological severity and symptom duration of OA on the outcome of THA are scarce and contradictory. (Nilsdotter et al 2001) and (Keurentjes et al 2016) for instance, showed no influence of preoperative radiological severity on functional outcome and QoL respectively. Also (Meding et al 2000) reported that hip scores at any follow-up were independent of the degree of osteoarthritis observed on the preoperative radiograph. Contrary to these results, other researchers have found a direct relation between the degree of preoperative radiological severity and postoperative functional improvement, i.e. patients with severe OA benefit more than mild OA after THA (Cushnaghan J et al 2007, Valdes AM et al 2012, Dowsey MM et al 2016). Regarding symptom duration, (Ollivier et al 2014) showed that symptom duration of less than one year was associated with better return to sport activities after THA compared with longer duration.
The influence of body mass index (BMI) on the THA functional outcome, QoL and complication rate has been investigated in a number of clinical studies. As BMI increases, the functional improvement and QoL after THA deteriorates and the rate of postoperative complications increases (Workgroup of the AAHKS, 2013). Nevertheless, there is paucity of the knowledge in regard to how BMI can affect the radiological outcomes as LLD, FO as well as the cup positioning. Well-conduced investigations of this issue are therefore warranted.
1.5 Clinical assessments in THA, preoperative and postoperative
The clinical assessments that were used in study 3 were the Western Ontario and McMaster Universities Osteoarthritis (WOMAC) Index to measure the functional outcome, EQ-5D to measure the QoL and the abductor muscle strength.
The WOMAC index is a patient-reported outcome measure developed to assess pain, stiffness, and physical function in patients with hip and/or knee OA (Bellamy et al 1988). It consists of 24 items (appendix page 66 and 67) that are divided into 3 subscales: pain (5 items), stiffness (2 items) and physical function (17 items). On 5-point scale the response options are ranging from none to extreme.
The EQ-5D is a common QoL instrument (appendix page 68). It consists of 2 items: a questionnaire and visual analogue scale (VAS) (Dawson et al 2001). The questionnaire consists of the following 5 dimensions: mobility, self-care, usual activities, pain/discomfort and anxiety/depression. Each dimension has 3 levels, which are: no problems, some problems, and extreme problems. The mean of the EQ-5D is equal to 1.0 for a completely healthy person and 0 for death. In order to record the EQ-VAS, the respondent’s self-rated health on a vertical, visual analogue scale where the endpoints are labeled and range from (0-100) where 100 is the best health state and 0 is the worst health state.
As part of the post-operative clinical assessment, we considered the assesment of the abductor muscle strength via an electronic dynamometer. Further explanation of this method will be described later in this book.
Aims of the studies:
Study 1: To evaluate the interobserver reliability and intraobserver reproducibility of measurements of FO, LLD, acetabular cup inclination and anteversion. To evaluate the validity of Sundsvall method of FO by comparing it to the standard method. Study 2: To analyze the postoperative plain radiographs of THA to determine whether the problem of leg lengthening and FO reduction is related to the femoral stem or acetabular cup positioning or both. Study 3: To evaluate the radiographic degree of OA and the duration of symptoms on the postoperative functional outcome and QoL after THA. Study 4: To evaluate the effect of BMI on post-THA radiological restoration of FO and leg length as well as acetabular cup positioning.Hypotheses:
Study 1: Radiographic measurement of LDD, global FO, cup inclination and anteversion methods have the required validity to be used in clinical practice. The Sundsvall method for measurement of global FO is as reliable as the standard method. Study 2: Leg lengthening ≥10 mm and reduction of the FO > 5 mm after THA are related to improper stem positioning. Study 3: The more radiological degree of OA and longer duration of symptoms are associated with better postoperative functional outcome, QoL and abductor muscle strength. Study 4: High BMI is associated with a higher incidence of LLD, improper FO restoration and mal-positioning of the cup after THA.
Patients and methods
The studies of this thesis are based upon a prospective cohort of patients that were recruited at Sundsvall Teaching Hospital in Sweden between September 2010 and December 2013. A total of 222 patients with unilateral primary osteoarthritis (OA) treated with THA were recruited (Figure 8). Patients with secondary OA, previous spinal, pelvic, or lower limb injuries or fractures were excluded. The regional ethics committee at Umeå University approved the studies and informed consent was obtained from all patients.
Preoperative radiological templating was performed using the Mdesk™ system (RSA Biomedical, Umeå, Sweden). Intraoperative assessment of leg length was done by evaluation of the soft-tissue balance and manual assessment of relative leg lengths by comparing it with the contralateral side. No intraoperative assessment of FO was done. The mobilization of all patients occurred at the first postoperative day with full weight bearing allowed. All patients followed the same postoperative exercise and rehabilitation program.
In each patient the LLD and global FO were measured on plain radiographs within 3 months before the THA and at the second postoperative day. A standardized protocol was used during taking the radiographs. The AP hip radiograph was performed with the patient supine and both legs internally rotated 15 degrees and the X-ray beam centered on the pubic symphysis with a film focus distance of 115 cm. The lateral radiographs were performed with the patient supine with the contralateral hip flexed and externally rotated with the X-ray beam angled at 45° inferomedial to superolateral through the hip joint. The radiographs that were centered straight (equal-sized obturator foramina) and included the proximal one-third of the femora were accepted (Frank et al 2007). In order to calibrate the measurements a radiopaque standardized metal sphere was used assess the degree of magnification. A 1 mm precision scale was used. To evaluate the patients’ preoperative function and QoL, the WOMAC index and EQ-5D were used respectively.
In our studies, the operations were performed by one of ten specialist orthopedic surgeons or an assistant directly under their supervision. The prostheses used were either a cemented Lubinus SP II system (Link, Germany) or cementless Spotorno (CLS) stem and Triology cup (Zimmer, U.S.A.). The Lubinus stem has one center-collum
all operations, the posterolateral approach was used. Patients were mobilized at the first postoperative day with full weight bearing allowed and following the same postoperative rehabilitation program.
Postoperatively the patients were followed-up at 12 - 15 months with the WOMAC index and EQ-5D questionnaire. Measurement of the abductor muscle strength was undertaken during the clinical assessment.
We used the Kellgren-Lawrence (KL) classification in study 3 and 4 (table 2). The patients were divided into two groups: mild OA (KL 1-2) and severe OA (KL3-4), Terjesen et al (2012). class 0: no radiographic features of OA are present class 1: doubtful joint space (JS) narrowing and possible osteophytic lipping class 2: definite osteophytes and reduced JS on anteroposterior radiograph class 3: multiple osteophytes, definite JS narrowing, sclerosis, possible bony deformity class 4: large osteophytes, severe/complete JS obliteration, severe sclerosis and definite bony deformity Table 2: The Kellgren-Lawrence classification. In all our studies a statistical analysis was carried out using SPSS for Windows version 20.0 (SPSS Inc, Chicago, IL) and statistical significance was set at p < 0.05. Sep 2010-Dec 2013 n=286 Included in the study n=250 Completed follow -up n=222 Study 2 n=172 Study 1 n=90 Study 3 n=222 Study 4 n=213 Died during follow-up n=6 Drop out n=22 Decline to participate n=15 excluded n=21
Study 1:
A total 90 consecutive patients with primary unilateral OA who underwent THA between September 2010 and December 2013 were recruited. As mentioned before, the LLD was defined as the difference in perpendicular distance in millimeters between a line passing through the lower edge of the teardrop points to the corresponding tip of the lesser trochanter on AP radiographs of the pelvis (Woolson et al 1999, Konyves et al 2005) (Figure 3). LLD was described by a positive value when the operated limb was longer than the contralateral side and a negative value described a shortened leg. Measurement of FO was done using both the Sundsvall and the standard method on the plain AP radiographs of the pelvis. When using the Sundsvall method, FO is defined as the horizontal distance between the femoral axis (a line drawn through the centre of the femoral shaft) and the midline of the pelvis at the height of the lateral tip of the greater trochanter (Kjellberg et al 2009) (Figure 5). When using the standard method, FO was defined as the addition of the distance between the longitudinal axis of the femur to the centre of the femoral head and the distance from the centre of the femoral head to a perpendicular line passing through the medial edge of the ipsilateral teardrop point of the pelvis (Lecerf et al 2009).
To compare the FO on the operated side to the non-operated hip, the measurement was performed bilaterally. A positive value indicated that the FO of the operated hip was greater than that of the contralateral side, while a negative value indicated the opposite (Figure 4).
The cup inclination on the AP view was defined as the angle in degrees between a line drawn along the angle of the rim of the cup and the transischial line (a line drawn between the most inferior point of the ischial tuberosities) (Wylde et al 2012) (Figure 6). Acetabular cup anteversion was defined on the lateral radiograph as the angle formed by intersection of a line drawn across the face of the acetabulum and a line perpendicular to the horizontal plane, according to the Woo and Morry method (Woo et al 1982) (Figure 7). Assessment of reliability and validity
Interobserver reliability of global FO, LLD, cup inclination and anteversion measurements, was assessed by three independent observers (an orthopaedic surgeon, an orthopaedic resident and a radiologist) performing the measurements independently
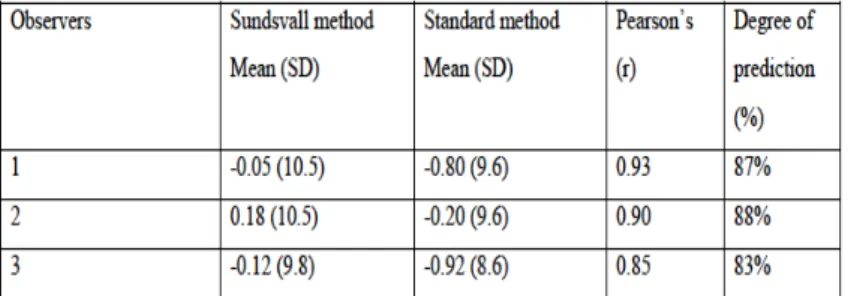
To validate the Sundsvall method, the results of the three observers using the Sundsvall method of global FO measurements were compared with the results using the standard method. When the observers made the measurements, they were blinded to their previous results. In addition, we measured the degree of prediction of the three observers, i.e. the percentage of correct prediction for each observer of whether the FO was of positive (the operated hip had increased in FO) or negative (the operated hip had decreased in FO) value. Statistical analysis
In order to calculate the required sample size, a priori power analysis was performed using Bonett’s approximation (Bonett et el 2002) for three observers. By using a minimum value of 0.7 for the interclass correlation coefficient (ICC) and a 95% confidence interval (CI) width of 0.2, a sample size of 68 hips was required. Hence, we chose to include 90 patients with unilateral THA in order to provide a safe margin of error.
To evaluate the interobserver reliability of the obtained measurements among the three observers and to evaluate the intraobserver reproducibility between the first and second measurements done by the two observers, the ICC (with 95% CI) was used. The Pearson’s correlation coefficient (r) was used to determine the concurrent validity of the Sundsvall method via measurements of its correlation with the standard method. In addition; the paired t-test was used to compare the means of the measurements of the Sundsvall to the standard methods. Both statistical methods were done to assess whether there would be a significant difference between the two methods, which could mean an over- or underestimation of FO as measured by the Sundsvall method. For both ICC and Pearson’s correlation coefficient a value of 0.00 to 0.20 was considered slight, 0.21 to 0.40 was considered fair, 0.41 to 0.60 was considered moderate, 0.61 to 0.80 was considered substantial and 0.81 to 1.00 was considered excellent (Landis et al 1977). Bland and Altman (B&A) test: We analyzed the agreement between the standard method of measuring the FO and the Sundsvall method using the (B&A) test in addition to the Pearson’s correlation coefficient (r). In 1983 Altman and Bland proposed an alternative analysis, based on the quantification of the agreement between two quantitative measurements by studying the mean difference and constructing limits of agreement. The B&A plot analysis is a simple way to evaluate a bias between the mean differences and to estimate an agreement interval, within which 95% of the differences of the second method,
compared to the first one, fall. Data can be analyzed both as unit differences plot and as percentage differences plot.
The resulting graph is a scatter plot XY, in which the Y axis shows the difference between the two paired measurements (A-B) and the X axis represents the average of these measures ((A+B)/2). In other words, the difference of the two-paired measurements is plotted against the mean of the two measurements. B&A recommended that 95% of the data points should lie within ± 2s of the mean difference. This is the most common way to plot the B&A method, Giavarina D et al (2015). Details about the results of this test are written in the results of study I.
Study 2:
172 patients with unilateral primary OA treated with THA. In each patient the LLD and global FO were measured at the second postoperative day using a standardized protocol. We divided the study into 2 parts. Part 1 (LLD-group)The LLD on radiographs, as in the previous study, was defined as the difference in perpendicular distance in millimeters between a line passing through the lower edge of the teardrop points to the corresponding tip of the lesser trochanter (Woolson et al 1999, Konyves et al 2005). A positive LLD value was obtained when the affected limb was longer than the contralateral side, whereas a negative value indicated the opposite. In those patients whose operated leg became ≥ 10 mm longer compared with the contralateral side (n=41) were further studied to investigate how many millimeters of lengthening that took place in the stem (stem length) and in the cup (cup length) compared with the contralateral side. This step of further studying the LLD was done using the method described by McWilliams et al (2012). The stem length at the operated side was measured as the distance between the lesser trochanter and the horizontal line between the teardrops. The cup length was measured as the distance between the latter line and the center of rotation. The stem and cup lengths were always compared with those of the contralateral side (Figure 9). Part 2 (FO-group) The global FO measurement of the operated side was carried out on the postoperative pelvic AP view. It was calculated by adding the distance between the longitudinal axis of the femur to the center of rotation (stem offset) and the distance from the center of rotation to a perpendicular line passing through the medial edge of the ipsilateral teardrop point of the pelvis (cup offset) (Lecerf et al 2009). Once again, the measurement was repeated bilaterally to compare the FO of the operated side to the non-operated hip. A positive value was used when the FO of the operated hip was greater than the contra-lateral side while a negative value indicated the opposite. Furthermore; Patients with reduction of the global FO at the operated side of more than 5 mm (n=58) were further studied to investigate how many millimeters of global FO reduction that took place in the stem (stem offset) and in the cup (cup offset) compared with the contralateral side (Figure 10). In order to test the interobserver reliability of the previously mentioned measurements on the 41 patients with leg lengthening and the 58 patients with global FO reduction, we compared the measurements made by an orthopaedic surgeon with the measurements
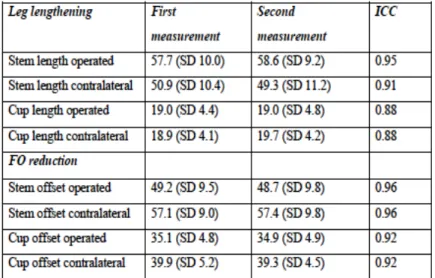
made by a radiologist. The two observers were blinded to each other´s results. To evaluate the intraobserver reproducibility, the radiologist repeated the same measurements after 8 weeks and his two measurements were compared to each other. The radiologist was blinded to his own previous measurements when he repeated them. The two observers were trained in making the measurements before starting the study and a set of 5 patients from the leg lengthening group and 5 patients from the FO reduction group were measured by the entire research group in order to reach a consensus. Statistical analysis The required sample size was calculated using the method described by Pocock (1983) hypothesizing that LLD and FO reduction was related to the stem positioning in two-thirds of patients. This hypothesis resulted in a required sample size between 80 and 100 patients with 5 % significance and 80% power. The Kolmogorov–Smirnov test was used to test the material for normality and was found to be normally distributed.
The radiological measurements were presented as means and SD. A two-tailed paired student t-test was used to compare the stem length and offset as well as the cup length and offset with the contralateral side. The ICC was used to evaluate the interobserver reliability (between the two observers: the radiologist and the orthopaedic surgeon) and intraobserver reproducibility (comparing each observer´s first and second measurements). An ICC of 0 to 0.20 was considered slight, 0.21 to 0.40 was considered fair, 0.41 to 0.60 was considered moderate, 0.61 to 0.80 was considered substantial and 0.81 to 1.00 was considered excellent (Landis et al 1977).
Figure 10: Postoperative AP pelvis radiograph after THA showing the stem offset at operated side (A1) and at the non-operated side (A), as well as the cup offset at operated side (B1) and at the non-operated side (B).
Study 3:
222 patients with unilateral primary OA treated with THA were included. All patients were assessed before the operation with WOMAC and the EQ-5D. The duration of OA symptoms was documented as less than or longer than 3 years. The body mass index
(BMI) was also measured (kg/m2) preoperatively. Two independent observers to
measure the interobserver reliability assessed the degree of radiological OA. The assessment of the radiological OA was according to the Kellgren-Lawrence (KL) classification (Table 2). The patients were divided into two categories: mild (KL 1-2) and severe (KL 3-4). One observer repeated the KL assessment 8 weeks later to measure the intraobserver reproducibility.
Patients were followed-up at 12-15 months postoperatively with a self-administered WOMAC index and EQ-5D questionnaire. During the clinical assessment, the same observer conducted isometric abductor muscle strength measurements in all patients.
The primary outcome measure was the WOMAC index while the secondary outcome measures were: EQ-5D, health status VAS and hip joint abductor muscle strength.
Regarding the measurement of the abductor muscle strength, the procedure was done as follows: While the patient was in supine position with straight legs on a padded table, the pelvis was immobilized with a band across the iliac spines. An electronic
dynamometer (MAV Prüftechnik GMBH) was used. The pad of the compression arm was centered at the lateral aspect of the thigh just below the midpoint between the greater trochanter and knee joint. The patient was then asked to maximally abduct the thigh against the pad. The non-operated side was tested first. Two trials for each side with a one-minute rest in between were made. We documented the higher strength measure of the two trials for each side and then calculated the percentage of the operated side in relation to the contralateral side. Before measurement, information about the test was given to patients to allow them to become familiarized with it. Statistical analysis
In order to calculate the required sample size, a priori power analysis was performed using G*Power software, Faul et al (2009) based on comparing the means of the primary outcome WOMAC index of each group. With a power of 0.80 and a significance level (alpha) of 0.05, a minimum of 65 patients was needed in each group to detect a clinically significant 10 points difference [standard deviation (SD) 20] in WOMAC index between the two groups.
Data was tested for normality using the Kolmogorov-Smirnov test, before using parametric tests. Demographic data were presented as means and SD. Comparisons between different groups’ patient characteristics preoperatively were performed with chi-squared tests (for categorical variables), or independent-samples Student’s t-tests or Mann-Whitney U-tests (for continuous variables). Comparison of preoperative with postoperative scores to evaluate changes over time between the groups of patients with mild and severe OA and between the groups of patients with symptom duration < 3 years and > 3 years were also done.
To check the influence of different variables [age, sex, BMI, preoperative WOMAC, preoperative EQ-5D, preoperative health status VAS, KL class (1-2 and 3-4) and symptom duration (< 3 years and > 3 years)] on the primary outcome measure (WOMAC) and on the secondary outcome measures (EQ-5D, health status VAS and abductor muscle strength), we used ANOVA to get crude results. We then included the variables that had a p-value ≤ 0.1 as potential confounding factors in a multi-variable linear regression model for each of the outcome measures to get adjusted results. For these, a p-value ≤ 0.05 was considered statistically significant. The interobserver reliability and intraobserver reproducibility of the KL classification radiological measurements were assessed with the Cohen’s Kappa co-efficient.
Study 4:
Preoperatively, the outpatient’s nurse documented each patient’s BMI (kg/m2). The
degree of radiological OA was measured according to the Kellgren-Lawrence (KL) classification. The patients were divided into 2 categories: mild OA (KL 1-2) and severe OA (KL 3-4). The duration of OA symptoms was documented as less than or longer than 3 years. Statistical analysis To calculate the required sample size, the method of Peduzzi et al. was used (Peduzzi P et al). Based on the primary outcomes, FO and LLD, with an expected incidence of abnormal outcome of 30% of patients (0.30), the minimum number of patients required was calculated as 10 x number of cofounders (n=6) divided by the proportion of expected abnormal cases (0.30) = 200 patients. Demographic data for the outcomes were presented as means and standard deviation (SD).
To check for any possible cause-effect relationship between BMI and outcome measures (FO and LLD as primary outcomes and cup inclination and anteversion as secondary outcomes), a multivariable logistic regression model for each outcome measure was fitted, adjusting for possible confounding factors. We included age, sex, surgeon’s experience, KL class, and symptom duration as a priori selection as we expected these variables to be related both to exposure and outcome, and that they would not be in the causal pathway between potential risk factors and outcome. The odds ratio (OR) and 95% confidence interval (95% CI) are presented. A p-value < 0.05 was considered statistically significant.
Results:
Study 1:
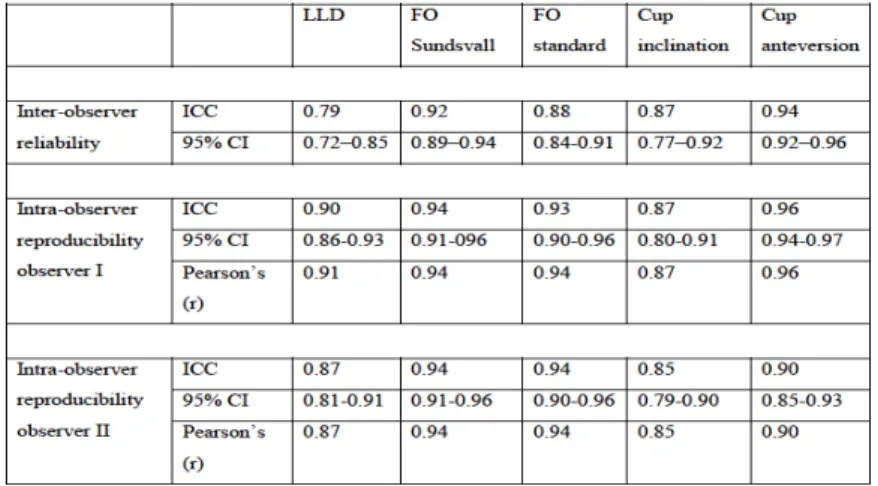
Mean age of the patients was 68 years (range 44 to 85), 46 males and 44 females. 8 patients with low-quality images (mainly a malrotated pelvis and unclear lateral view) were re-examined with new radiographs to ensure adequate quality. The interobserver reliability of all measurements among the three observers was excellent, except for LLD, which was substantial (Table 3). The intraobserver reproducibility of measurement for the two observers was excellent (Tables 3). The validity of the Sundsvall method of global FO measurement when compared to the standard method was good with positive correlation. Pearson’s coefficient (r) for the three observers was excellent. The p-value comparing the means (SD) of the Sundsvall method and standard method was > 0.05
(Table 4), i.e. there were no significant differences among the measurements.
Table 3: The interobserver reliability of radiographic measurements among the three observers, intra observer reproducibility of observer 1 (orthopaedic surgeon) and intraobserver reproducibility of observer 2 (radiologist). ICC=Intraclass correlation coefficient, CI=confidence interval, LLD =leg length discrepancy, FO=femoral offset.
Table 4: The validity of the Sundsvall method of FO measurement compared to the standard method using Pearson’s correlation coefficient and degree of prediction. SD: standard deviation, r: Pearson’s correlation coefficient.
Regarding the Bland and Alltman test and after performing the B&A test on our Data, we found the following chart, illustrating that most of the measurements of the two methods lie between the limits of agreement.
Chart Bland-Alltman test: Demonstrates the differences and mean between the Sundvall’s method and the standard method to measure the FO. The red line represents the mean (bias). The blue lines are the upper and lower limits of the SD (limits of agreement).
The following results were obtained in coefficience model after linear regression analysis: Coefficientsa Model Unstandardized Coefficients Standardized Coefficients t Sig. B Std. Error Beta (Constant) 2.055 .685 3.001 .003 Mean .098 .073 .120 1.337 .184 a. Dependent Variable: Differences The result shows a non-statistically significant bias (0.184) in coefficience model. This result agrees with our statistical method, Pearson’s (r) test (Table 4), i.e. there were no significant differences among the measurements.
Study 2:
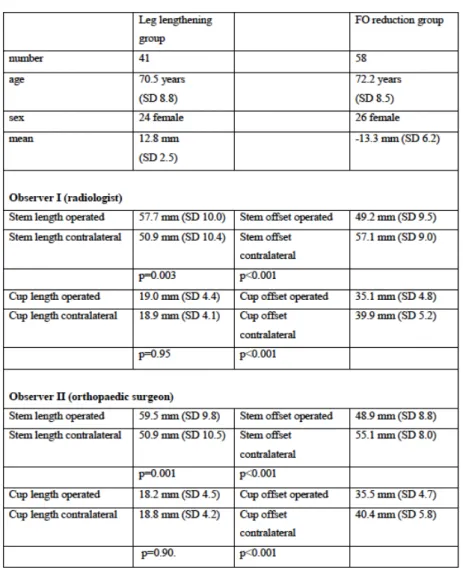
Leg lengthening group In this group, there were 41 patients (24 females and 17 males, mean age 70.5 years SD 8.8). The mean lengthening of the operated leg was 12.8 mm (SD 2.5). The comparison of stem length and cup length with the contralateral side showed that the lengthening was located in the stem for the two observers (Table 5). FO reduction group In this group, there were 58 patients (26 females and 32 males, mean age 72.2 years SD 8.5). The mean FO reduction was -13.3 mm (SD 6.2). The comparison of the stem offset and cup offset with the contralateral side showed that the FO reduction was located both in the stem and cup for the two observers (Table 5). The reliability and reproducibility of the measurements
Table 5: Demographic data and comparison of stem length and cup length, stem offset and cup offset between the two observers.
Table 6: The interobserver reliability between the two observers.
Table 7: The intraobserver reproducibility between the two measurements of observer 1.
Study 3:
222 patients were included, 109 females and 113 male, mean age 68 (SD 9.8) and mean BMI 27.6 (SD 4.4). The whole included cohort of 222 patients was divided twice, first according to the preoperative radiological degree of OA and then according to the symptom duration.
Regarding the radiological OA severity, there were 73 patients (43 females, mean age 68 years) in the mild OA group and 149 patients (44 females, mean age 68 years) in the severe OA group. Regarding symptom duration, there were 92 patients (49 females, mean age 69 years) in the group with symptom duration < 3 years and 130 patients (60 females, mean age 67 years) in the group with symptom duration > 3 years.
Comparison of the preoperative WOMAC indexes, EQ-5D, health status VAS and BMI between each two groups showed no statistically significant differences expect for the female/male ratio between the radiologically mild and severe OA groups (Tables 8, 9).
All four groups (radiologically mild and severe OA and symptom duration < 3 years and > 3 years) showed significant improvements (p< 0.001) in the postoperative WOMAC index, EQ-5D and health status compared with that preoperatively (Table 10, 11).
The crude results using ANOVA tests for possible factors influencing postoperative WOMAC, showed that age, sex, BMI and preoperative WOMAC to be significant (p≤0.1). The KL class and symptom duration had no influence (p=0.90 and p=0.20 respectively). The adjusted results using multi-variable linear regression showed that age, sex and BMI but not preoperative WOMAC significantly influenced postoperative WOMAC (Table 12). Younger age, male sex and lower BMI were associated with a lower postoperative WOMAC i.e. better functional outcome.
Regarding EQ-5D, the crude results showed that age, sex, preoperative EQ-5D and symptom duration to be significant (p≤0.1). The BMI and KL class had no influence (p=0.83 and p=0.39 respectively). The adjusted results showed that only age and sex influenced the postoperative EQ-5D (Table 12). Younger age and male sex were associated with higher postoperative EQ-5D i.e. better QoL.
Regarding health status VAS, the crude results showed that age, sex and preoperative health status VAS to be significant (p≤0.1). The BMI, symptom duration and KL class had no influence (p=0.67, p=0.23 and p=0.19 respectively). The adjusted results showed that only sex influenced the postoperative health-status VAS (Table 12). Age showed a tendency for significant influence. Male sex and younger age were associated with higher postoperative health status VAS.
Regarding postoperative abductor muscle strength, the crude results showed no influence of the tested factors (age, sex, BMI, KL class and symptom duration) (p> 0.1). The Cohen’s Kappa co-efficient for interobserver reliability was 0.79 (95% CI 0.74-0.85) and for the intraobserver reproducibility was 0.84 (95% CI 0.78-0.91). Table 8: Comparison of preoperative demographic data between the KL 1-2 and KL 3-4 groups. Table 9: Comparison of preoperative demographic data between the short and long lasting OA symptom duration. Table 10: Comparison of WOMAC index, EQ-5D, and health status between KL 1-2 and KL 3-4
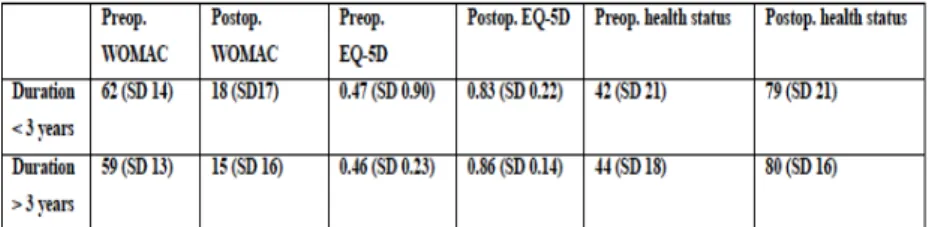
Table 11: Comparison of WOMAC index, EQ-5D, and health status between duration< 3 years and duration > 3 years groups preoperatively and at 12– 15 months postoperatively. All comparisons show clinical and statistical improvement postoperatively (p< 0.001). Values are mean (SD). Table 12: Linear regression analyses adjusting for possible confounders influencing the primary and secondary outcome measures. CI=confidence interval.
Study 4:
We considered 286 patients for inclusion during the study period. We excluded 21 who had one or more exclusion criteria. Fifteen patients did not agree to participate in the study and 37 had no prospectively measured or documented BMI. This left the analysis with 213 (74.5%) patients. There were 118 females and 105 males with a mean age of 68 years (SD 10). The mean BMI was 27.7 (SD 4.5). Regarding the radiological OA severity, there were 73 patients in the mild OA group and 143 patients in the severe OA group. Regarding symptom duration, there were 97 patients in the group with symptom duration < 3 years and 116 patients in the group with symptom duration > 3 years.
The mean FO in the cohort was -2 mm (SD 9). There were 118 patients (55%) with improper FO: 73 patients with decreased FO and 45 patients with increased FO.
The mean LLD in the cohort was 2 mm (SD 7). There were 32 patients (15%) with improper LLD: 9 patients with shortening and 23 patients with lengthening.
The mean cup inclination in the cohort was 47° (SD 7). There were 27 patients (13%) with improper cup inclination: 9 patients with increased inclination and 16 patients with decreased inclination. The mean cup anteversion in the cohort was 17° (SD 8). There were 50 patients (23%) with improper cup anteversion: 32 patients with increased anteversion and 18 patients with decreased anteversion.
The multivariable logistic regression model identified BMI as the only factor that affected LLD (Table 13). Increased BMI increased the risk of LLD (OR 1.14, 95% CI 1.04 to 1.25). No other factors included in the model affected any of the primary or secondary outcomes (Table 14).