& VTIsärtryck
732
798.9
Antilock System Performance Under Winter
Canditions - What Should Be Required?
Olle Nordström
Reprint from Proceedings of the Eleventh International Technical
Conference on Experimental Safety Vehicles held in Washington,
D.C. May 72- 75, 7987, pp 437 442
?, Väg-UCI) 7'rafik-
Statens väg- och trafikinstitut (VTI) . 581 01 Linköping
Inst/tutet Swedish Roadand Traffic Research Institute . 8-581 01 Linköping Sweden
732
198.9
AntiIock System Performance Under Winter
Conditions - What Should Be Required?
Olle Nordström
Reprint from Proceedings of the Eleventh International Technical
Conference on Experimental Safety Vehicles held in Washington,
D.C. May 72- 75, 7.987, PP 437-442
Antilock System Performance Under Winter Conditions What Should Be
Required?
Olle Nordström,
Swedish Road and Traffic Research Institute,
Sweden
Abstract
In Sweden accidents due to loss of stability and steerability caused by braking with locked wheels to a large extent occur on icy roads in the winter. It is therefore essential that antilock systems that are expected to eliminate this type of accidents perform well under these circumstances. In order to establish suitable test methods and realistic performance levels investigations have been made both with passenger cars and commercial vehicles including heavy trailers. Stability and steerability in terms of staying within lane boundaries with restricted steering wheel correc-tions and braking performance in terms of braking efficiency related to a reference performance in terms of lateral friction, locked wheel friction, optimum friction (ECE/EEC) or friction according to the ISO TR 8349 method have been considered as primary safety criteria.
These investigations are described and the results summarized. As winter performance test methods the following are discussed and recommended together with suggested minimum performance
J turn braking performance test on ice split friction test with very low friction on one side
straight line braking on ice
Transition from low friction to high friction surface
Introduction
In Sweden the necessity of driving under winter conditions with very low road adhesion can be ex-pected from the middle of October to the end of April or approximately six months of the year. Not only homogeneous low friction but also asymmetric so called split friction and transitions from low to high friction or the opposite are frequently met during the winter period.
Safe braking under these conditions is for obvious reasons a serious problem. Studded tyres have been found to be one effective way of raising the safety level and is widely used on passenger cars in winter time. They are also to some extent used on trucks but hardly on heavy trailers. Even with studs the friction level can be below 0.2 and the risk of wheel locking with loss of steering control and stability during braking is considerable during emergency braking.
Antilock braking systems with good performance under these conditions can therefore be expected to give a significant reduction in traffic accidents where braking is involved.
The Swedish Road Safety Office, The Swedish Board for Technical Development and other Swedish organizations interested in traffic safety research have therefore sponsored several projects with the aim to investigate what can be expected from vehicles equipped with antilock systems in terms of stability, steerability and braking performance. The Swedish
Road and Traffic Research Institute (VTI) has been
active in most of these projects.
This paper summarizes investigations during five
winterperiods from 1980 1986 and presents proposals
for antilock system test procedures and requirements. the aim of which is to ensure good braking perfor-mance under winter conditions.
These tests are to be regarded as proposed
comple-mentary winter service requirements to be added to the more general requirements in the ECE/EEC regulations.
Antilock System Tests Under Winter
Conditions Carried Out by VTI
Test procedures
The following antilock system test procedures have been studied
' steerability tests on ice comprising 1) J turn braking
2) Braking in a steady state turn 3) Single lane change braking
' split friction test defined as straight line braking with one side of the vehicle on a high friction surface and the other side on a low friction surface (ice)
' straight line braking test on ice
' transition from low to high friction and the opposite with ice as low friction surface The steerability and split friction tests evaluate different aspects of steerability and stability and braking efficiency while the two remaining test types primarily evaluates braking efficiency.
The conclusion from these studies is a recommenda-tion to include the following winter service approval tests for antilock systems.
1. Driver controlled J-turn test on ice
2. Split friction test with one very low friction surface
3. Straight line braking test on ice
4. Transition test from very low friction to high friction.
In the following the different test procedures and test results will be presented and discussed.
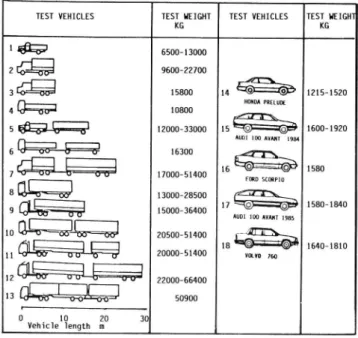
Test vehicles
Tests were carried out with the following vehicles which are shown in figure 2.1. All heavy duty vehicles were air braked, with S cam drum brakes.
0 1980 with a two axle heavy duty truck and a two axle drawbar trailer both equipped with two antilock systems, Girling and WABCO. (Vehicle 1 and 5)
' 1981 with the same vehicles (1 and 5) now equipped with three antilock systems, Girling GX, WABCO and Bosch. In addition a three axle heavy duty truck with Bosch antilock system was used. (Vehicle 3)
0 1984 with a three axle heavy duty truck and a two axle drawbar trailer with a prototype system. (Vehicle 4 and 6) and with the six heavy vehicle combinations 7-12 all equipped with WABCO antilock systems.
' 1985 with a three axle heavy duty truck (Vehicle 2) equipped with a new version of the WABCO antilock system and with two passenger cars. (Vehicle 14 and 15)
0 1986 with three passenger cars (Vehicle 16, 17 and 18) and the heavy duty vehicles 2 and 13. Vehicle 13 was equipped with a Bosch
system.
Reasons for Choosing Ice Instead of
Other Low Friction Surfaces
The reason for choosing ice as test surface is that it is a representative winter road condition that is durable and relatively easy to produce and maintain. A disadvantage is that it requires temperatures below 0°C. It has unfortunately till now not been possible to find an alternative surface that has all the important characteristics of ice. One of these characteristics is that a wheel operating at high slip reduces the friction of the ice for the following wheels. This means that on ice the front wheels can get higher friction than the rear wheels which has a destabilizing effect. On wetted low friction surfaces for test purposes the effect is normally the opposite as friction increases when the water is wiped away.
Steerability Tests
Justification
Vehicles with antilock systems on steered wheels will if they meet the requirements of a straight braking efficiency test and a split friction test
cer-432
TEST VEHICLES TEST HEIGHT TEST VEHICLES TEST HEIGHT KG KG
lät-a
6500 13000 9600 22700_
%% 15800 14 G) "O'" 1215-1520 HONDA PRELUK QQ 10800 4 {AV-1.x _. 5 m 12000-33000 15 *© -@ 1600 1920 AUDI 100 AVANT 1984f, m
16300
,,."
m_©==l©' 7 % 17000 51400 16 FWD SCORPIOI
1580 13000 28500 .-\ 9 $% 15000-36400 17 © ©_ 1580-1840 AUDI 100 AVANT 1985 20500 51400 1640 1810EQ
if
12 ; % åång 22000-66400 13 % 50900 30_ 10 20 Veh1c1e length m
Figure 2.1 Test vehicles
tainly possess some degree of steerability. The split friction test can indeed be regarded as a kind of high friction steerability test. On very low friction surfaces a bad antilock system may, however, give either very poor stability or very poor steerability due to high slip levels and poor slip distribution between front and rear axles. In both cases the expected safety benefits will not be obtained and in the unstable case it might even be more dangerous to use such an antilock system than a normal brake system or vehicles with antilock system only on the rear axle. It is therefore essential to test the steering qualities during emergency braking on low friction in a special test.
This is also true for trailers as the steerability and stability of a vehicle combination depends also on the performance of the trailer. Three basic steering tests have till now been used in connection with antilock system evaluation:
1. J turn braking.
Braking from a steady state turning condi-tion (Braking in a turn).
3. Braking during a single lane change
J-turn braking as an open loop constant step steer input test for passenger cars with antilock systems was proposed by Sweden at the 1974 ESV congress. This was the result of a research program carried out mainly by the Swedish car industries SAAB SCANIA and VOLVO but in which VTI also took active part. Braking in a turn on a high friction surface has been standardized by ISO for passenger cars with normal braking systems as an open loop test with
constant steering input. TUV Rheinland has tested
and proposed this method also for passenger cars with antilock systems. In order to assess the steeringreserve an additional test with increased steering angle is used in this case.
Single lane change braking is part of the SAE recommended practice J46 for testing of antilock systems (slip control systems).
Tests carried out by VTI
In 1980 VTI carried out tests on ice according to
the three basic methods. The braking in a turn test was, however, made with driver control. For this test type both 100 m and 300 m radius were used. The tests were made with an air braked heavy truck-drawbar trailer combination equipped with two well-known European antilock systems.
The conclusion from these tests was that all three procedures can be considered meaningful in order to assess steering characteristics during braking on ice. The open loop type of testing turned out to be more severe than the closed loop type with driver control. The truck had a tendency to oversteer especially with one of the antilock systems which with fixed steering angle resulted in rear axle spin out. This could be avoided by driver control without excessive efforts. The tests at 300 m radius gave similar results to those at 100 m radius in terms of stability problems and deceleration level. This indicates that it could be sufficient to use the less expensive 100 m radius.
In 1981 it was considered desirable to choose one of the methods for further studies. The J-turn test was chosen being a compromise between the braking in a
turn and single lane change in terms of driver skill,
lateral space requirement and possibility to choose between open loop and closed loop versions of the test. It was decided to use 100 m radius in the closed loop version. During these tests the ice was roughened by a specially designed multi wheel trailer with stud-ded passenger car tyres running at 100 slip angle (figure 4.1) in order to increase the friction level and reduce friction variations due to polishing and other environmental effects. The tests were carried out with
the same truck and full trailer now equipped with three different antilock systems two of which had not been tested in 1980. An additional truck equipped with only one of the systems was also tested.
Further tests have been carried out with the closed loop J turn test, in 1984 with one truck-drawbar trailer combination, two tractor semitrailer combina
tions and three tractor-semitrailer plus drawbar trailer
(double) combinations and in 1986 with a single truck and a tractor-semitrailer-centre axle trailer (double)
combination. In 1985 and 1986 a total of five passenger cars have also been tested.
Proposal for a J-turn braking test on ice
Based on the practical experiences from the VTl investigations a driver controlled J-turn braking test on ice with the following specification is proposed for combined evaluations of stability, steerability and braking performance of vehicles with antilock system on a steering axle. Other test surfaces can be used for a more general test for less severe conditions.
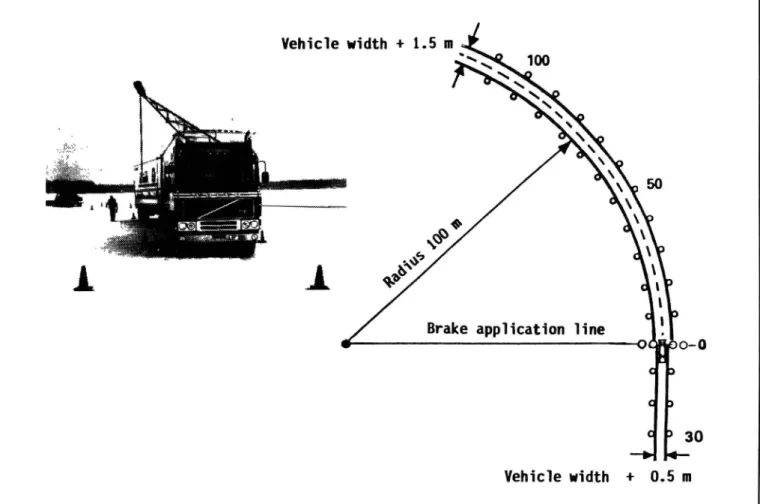
Test track surface. The test track surface shall be ice with a friction level that permits a maximum corner-ing speed without brakcorner-ing between 40 and 60 km/h. Especially for tests with heavy vehicles it is recom-mended that the ice is roughened by ordinary passen-ger car tyre studs, preferrably by using the special multiwheel trailer with side slipping wheels according to figure 4.1. In order to get a suitable friction level, an air and ice surface temperature well below OGC is normally also required. The track surface must not deviate more than 10 from the horizontal measured over the track width in radial direction and over 10 m along the track.
Test track configuration. The test track which is shown in figure 4.2 shall consist of a straight entrance
lane, 30 m long and 0.5 m wider than the vehicle, followed by a 100 m radius curved lane, 100 m long and 1.5 m wider than the vehicle.
EXPERIMENTAL SAFETY VEHICLES The lanes may be marked by cones every 10 m. It
must be possible to drive at least 50 m in the circular lane at maximum lateral acceleration.
Instrumentation. The vehicle must be equipped with instruments for measuring and recording
0 vehicle speed ' braking distance ' steering wheel angle Test procedure for motor vehicles
1. Determine the maximum constant speed (VM) at which it is possible to drive through the J turn without excessive steering corrections. 2. Make J-turn braking tests with the antilock system in operation and full brake pedal application when the front axle is within i 1.5 m from the end of the entrance lane. Determine the maximum initial speed Vo from which the test can be made without leaving the lane, and without excessive steer-ing corrections. It is recommended to do this by changing the initial speed in steps of approximately 2.5 km/h starting from 75 percent of VM.
3. Check that VM has not changed. If this is the case use the new value of VM as reference.
4. The vehicle is considered to be inside the lane as long as no part of the tyre tread has crossed the boundary lines.
Steering corrections are considered excessive if they exceed i 180° from the straight line position.
VM and VO shall be the mean value from three tests.
Stability and steerability performance ES is
expressed by the ratio (VC/VM?.
Braking efficiency is expressed by EBY =
aALS/ayM Acceptable alternatives are: EBL = aALS/aLEBE = aALS/aE
whereayM= Maximum lateral acceleration
aALS= Mean deceleration with antilock sys-tem in operation
aL= Mean deceleration with locked wheels from 40 km/h on the same type of surface
aE= Maximum constant deceleration with-out wheel locking from 0.75 V0 km/h, calculated from front axle braking de-celeration (ECE/EEC method)
Vehicle width + 1.5 m
Vehicle width + 0.5 m
Figure 4.2. J-turn antilock braking test with driver control. Test track configuration 434
9. Proposed minimum performance
require-ments:
Stability/steerability index ES 2 0.64
Braking efficiency index EnZo-50
Braking efficiency index EBL20.9O Braking efficiency index EBE20.75Test procedure for trailers. The proposal concerning trailer testing is the following:
A trailer equipped with an antilock system shall be tested in combination with a towing vehicle also equipped with an antilock system. Both vehicles shall have the same type of tyre equipment. Both vehicles shall be tested unladen or laden. It is also recom-mended that jackknife preventing devices are used at all articulation points.
The test is performed in the same manner as for the single motor vehicle. In addition a test is made where only the trailer is braking. From this test the trailer deceleration is calculated. The rolling resistance of the truck should be taken into account with the values 0.015 for the driven and 0.01 for non driven wheels.
Test results
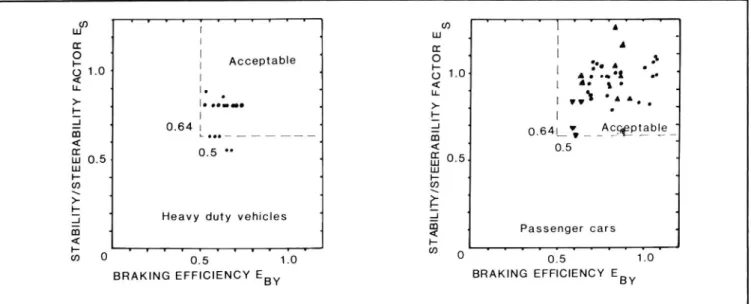
Test results from the closed loop J-turn test are presented in figure 4.3, 4.4 and 4.5. Figure 4.3 illustrates the relationship between the steerability/sta-bility index ES and the braking efficiency EBY for passenger cars and for heavy duty vehicles.
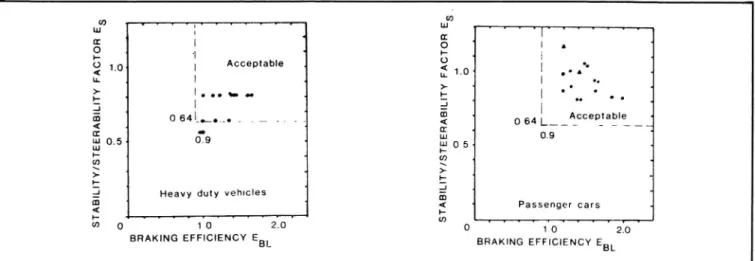
Figure 4.4 presents the relationship between ES and EBL also with separate results for passenger cars and heavy duty vehicles.
Figure 4.5 shows the relationship between ES and EBE. The results are from passenger car tests only as front axle deceleration in the curve has not been made with heavy duty vehicles.
The diagrams show no correlation between the steerability/stability factor and the braking efficiency. Results from tests with increasing initial speed have depending on tyre equipment given both increasing and decreasing braking efficiency.
From the diagrams can be seen that if all results were to be accepted the following limits should be set:
E5205, EBY20.50, EBL20.9, EBEzOJS.
The proposal to set the minimum requirement on ES to 0.64 is based the opinion and that this value is more representative for state of the art. The vehicles that did not reach this value should be improved.
Split Friction Test With Very Low
Friction On One Side
Justification
The split friction condition, where the wheels of the vehicle is on high friction on one side and very low friction on the other, is a typical winter time road surface condition in Sweden and drivers are trained to make use of one sided high friction when it is available. Vehicles with standard braking system are by design capable of utilizing the high friction. This is not necessarily the case when an antilock system is fitted. In fact there are systems on the market which adapt the braking force of both wheels on an axle to that demanded by the wheel with the lowest coeffi-cient of friction. These systems have the advantage of not giving yaw stability problems and in principle being less costly. The disadvantage in terms of longer braking distance (S) becomes more and more pro-nounced when the low friction coefficient is lowered since approximately S : A/K2 where A is a constant if the initial speed and braking efficiency is constant. K2 = Low friction coefficient.
_; O
.0 01
Heavy duty vehicles
1 _L
' 0.5 1.0
BRAKING EFFICIENCY EBY
' V S T A B I L I T Y/ S T E E R A B I L I T Y F A CT O R E S 0 U) l ' ' '4 ' '
J
I
c: * l $ E l :|. A .. O 1.0 A . o..: o' < l h s ' . LL [ vv. * o . >- . -l: l 1 Ac t | * a 0.64L_" _ _ _Qåpjbf_-&( 0.5 Lu O 5 w ' 'i (I) E . Q 2 4 Passenger cars _ O 0.5 1.0BRAKING EFFICIENCY EBY
Figure 4.3.
braking efficiency EBY
d O
.
.
A
O Ul O (O
Heavy duty vehicles
'1vo ' - C270
BRAKING EFF|CIENCY EB]
v S T A BI L I T Y / S T E E R A B I L I T Y F A CT O R E S 0 ' vrv T v v v vå _ l O A A L l i | | '-| | A _ L Acceptable < _ ______ 0 64 L__ __ 0.9 O (11 L A Passenger cars S T A B I L I T Y / S TEE R A B I L I T Y F A C T OR E S O O M O
BRAKING EFFICIENCY EBL
Figure 4.4. J-turn antilock braking test with driver control. Test results showing stability/steerability factor and braking efficiency EE.L
In figure 5.1 the braking distance from 50 km/h is shown as a function of the low friction coefficient
when 5 m/s2 can be achieved on the right friction
surface and the braking efficiency is 100070. It can be seen that at a friction coefficient of 0.1 the braking distance is 95 m for a system adapting to the low coefficient (select low system) compared to 32 m for a system with individual wheel control. Antilock sys-tems with these characteristics are not desirable on roads where split friction conditions with very low friction can be expected. In order to check split friction braking performance, the low friction coeffi-cient should be as low as possible.
Tests carried out by VTI
VTI has performed tests on split friction surfaces with ice as low friction surface having peak and
A L L l'n . L 0 . . l ' A 0.64'flcceptable -0.75 9 or L A Passenger cars S T A B I L I T Y / S T E E R A B I L I T Y F A C T O R E S . ofs 7 1.0 BRAKING EFFICIENCY EBE
Y r v
0
Figure 4.5. J-turn antilock braking test with driver control. Test results showing stability! steerability factor and braking efficiency
Ess
436
locked wheel friction coefficients 0.1 with standard tyres and sand bonded to the ice with water as high friction surface giving a friction coefficient of about 0.6 (figure 5.2). The test speed was 50 km/h. As shown in the figure, antilock braking tests were performed also on the low and high friction surfaces for reference purpose. Part of the test program also included measurement of the friction coefficients K1 and K2 according to ECE/ECE regulations. This was done with front axle braking without wheel locking. Passenger cars, heavy trucks and truck trailer com-binations with commercially available systems and also one prototype system (see figure 2.1) have been tested. The systems represent different control strate gies from select low that adapts to the low friction to individual wheel control.
Results
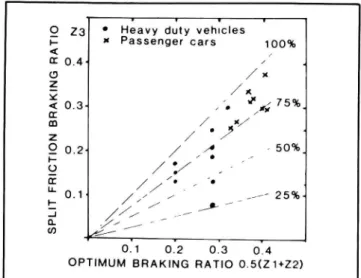
In figure 5.3 the braking ratio Z3 obtained in the split friction test is compared to the optimum braking ratio defined as (Z1 + Zz)/2- The braking ratios Z1 and 22 are those obtained by antilock braking tests on the high and low friction surfaces with the vehicle in question. Braking ratio is defined as the mean deceler-ation divided by gravity accelerdeceler-ation (9.81 m/sz).
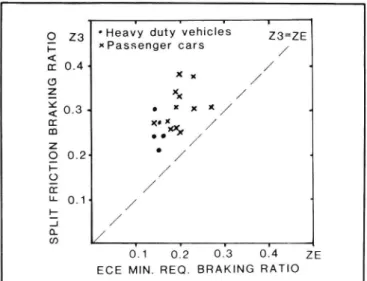
It can be seen that the select low system has a braking efficiency of only 27 percent of the optimum braking ratio compared to values between 75 and 90 percent for systems with a higher degree of individual wheel control. In figure 5.4 the braking ratio Z3 is compared to a minimum required braking ratio (4Z2 +Zl)/5 proposed by E. Petersen from WABCO. The tested vehicles with select low antilock systems did not meet this requirement. In figure 5.5 test results are compared with the ECE/EEC requirement 2320.75 (4K2 +K1)/5. The ECE/EEC requirement was easier to meet than that from WABCO.
High friction coeff. K1-0.5
'" ' High friction braking ratlo 21-0.5
150- ow friction braking ratio Z2-K2
1
,,Select low control 23-2 2
100-ECE / EEC requirement
Z3=0.75(4K2+K1)/5 23>K2 U' 9 I / _ _ _ ' _ I WABCO requirement 23å(422+z1)/5
B R A K I N G D I S T A N C E F R O M 5 0 K M / H
\
t |Individual controlZ3=0.5(Z1+Z2) l0
o'.1
0:2
0:3 0:4- o.'5
o.? 0.7
LOW FRICTION COEFFICIENT K2
9 23 ' Heavy duty vehicles
,. :: Passenger cars 10096 < , CI 0.44 / i
o
/"
å /x< o 3
'. 'x; 75%
m / rn _ "/ _å
/
)
O96
_ o 2
/
5
r- ä / ' /g
///
,
I / O , .L: o1
////
,/~ 25%
/ / _1 /// / / ) & ,/// * (D /0.1
0.2
0.3
o'.4
OPTIMUM BRAKING RATIO 0.5(21+Z2)
Figure 5.1. Split friction braking efficiency
Discussion
The formula used in figure 5.4 uses the actually achieved braking ratios on the two surfaces and in most cases allow a select low system to be used on the
SPLIT FRICTION TEST
...
E
m HIGH FBEGTION K1
5:3
E
Vo 50 km/h
&
&
MAX STEERING CORRECTION
(BBQ ______ 6400
TIME T 0-2 soc 2-Tstop sec
ECE/EEC:I 1min=O.5 K2max=0.5K 1 2320.75(4K2+K1)0.2
23=K2
PROPOSED NEW
or
WINTER SERVICE 22max =O.4OZ1 REQUIREMENTS 2320.2(4Z2+Z1)
LOW FRICTION K2
K2max =O.40K 1
Figure 5.2. Split friction test procedure
Figure 5.3. Split friction test results. Comparison with optimum performance
front axle of a two axle vehicle. It has been argued that systems with high efficiency on homogeneous surfaces are disfavoured as the requirement in abso-lute deceleration is higher than for a less efficient system. If 75 percent of the friction coefficients K, and K2 are used instead of Z, and Z2 this problem is eliminated but vehicles with an efficient select low system on all axles can pass the test if the coefficient
of friction exceeds 0.2 for the low friction surface (see
figure 5.1). If a sufficiently low K2 value is required this risk is eliminated. It is however recommended to use Z1 and Z2 as the test procedure than is simpler. The ECE/EEC antilock regulations do not require a split friction test for trailers. In Sweden a vehicle combination is allowed to weigh about 52000 kg of which 36000 kg may be the trailer weight. lf a select low system is used on all trailer axles and on the front
% Z3 ' Heavy duty vehicles 23=ZW
( x Passenger cars /
$ o 4
/
Z I. / x _ / &( 0.3 . x x / 'm
,
', /
z 0 O o / : 0.2 . 9/ * 0 9 . / .E
/ '
|: 0 1 / . *ä
/
) /o.'1
072
o.'3
074 zw
WABCO MIN.REO.BRAKING RATIO
Figure 5.4. Split friction test results. Comparison with WABCO proposal
l ' | '
9 23 'Heavy duty vehicles Z3=ZE
: XPassenger cars / (I 0.4- x / o / Z xx / & 0.3 4 0 x" X x / (I xo / m 0. / Z 0 9 0.2 / *
9
/
cc
/
U- 01 t /_|
/
a (D . , T 0.1 0.2 0.3 0.4 ZEECE MIN. REQ. BRAKING RATIO
Figure 5.5. Split friction test results. Comparison with ECE/EEC requirements
axle of the truck, about 90 percent of the combination mass will be braked with low friction brake forces compared with only 66 percent if the trailer axles are individually controlled. If 22:01 and 2120.5, Z3 in the first case will be 0.140 and in the second 0.236. This difference is considered large enough to justify the same split friction requirements for trailers and motor vehicles.
Split friction braking performance of vehicle
combinations with and without antilock
system in operation
In 1984 split friction tests were also carried out in order to compare performance with and without antilock system. Four unladen heavy vehicle combina-tions (vehicles 6, 7, 10 and 11 in figure 2.1) were used. All were equipped with load sensing valves and WABCO antilock systems. Three drivers took part in the test but each combination was tested by only one driver.
The result of these tests was that the braking efficiency in most cases was 10-20 percent higher with the normal braking system than with the antilock system in operation. The efficiency of the antilock systems was about 80 percent of (Zl+Zz)/2. Both with and without antilock system it was possible to keep the vehicle within a 3.5 m lane. The steering and
braking task was, however, more difficult without
antilock system. The maximum steering angles were about 90 degrees with and 135degree without antilock
system.
Pmposal for a winter condition split
friction test
This test is specified in line with the ECE/EEC antilock system regulations except for
' Lower low friction
438
' Measurement of antilock braking ratios in-stead of friction coefficients
. Minimum performance requirement accord-ing to WABCO
0 Trailer test requirement
Test track. The test track shall have two surfaces, one with high friction on one side of the center line and one with low friction on the other side. The width of each surface must be large enough to allow braking tests with the vehicle.
The low friction surface shall have a peak coeffi-cient of friction of ( to-05 and a locked wheel friction of 0.1 0.05 in the speed range 50 15 km/h. This requirement is met by new (less than 24 h) smooth ice even at -15° C according to VTI experi-ence if standard tyres are used on the vehicle. This condition is considered to be met if the braking ratio with the antilock system in operation is between 0.15 and 0.04. The high friction surface shall have a peak coefficient of friction of at least 0.5. This condition is considered to be met if the braking ratio with the antilock system in operation is at least 0.375 (75070 of 0.5). Sand bonded to ice with water can meet this requirement. A track length of 100 m has turned out to be sufficient.
Test procedure
1. Measure the mean braking ratio with anti-lock braking for each of the two surfaces in the speed range 40 20 km/h when the vehicle is braked from 50 km/h.
2. Measure the mean braking ratio Z3 in the speed range 40 20 km/h when the vehicle is braked from 50 km/h with its left and right wheels on each side of the boundary between the high and the low friction surface.
Performance requirements
1. No part of the (outer) tyre treads must cross the boundary line during the stop.
2. Steering corrections must not exceed 120 degree during the first two seconds from brake application and not exceed 240 degree in all.
3. The braking ratio Z3 must not be less than: Z1 =Braking ratio on high friction surface ZZ=Braking ratio on low friction surface Z3 =Braking ratio on split friction
Trailer test. The trailer should be tested together with a representative towing vehicle equipped with an approved antilock system. The combination must meet the requirements for a single vehicle. The braking efficiency of the trailer should also be tested by means of separate trailer braking according to the procedure in 5.6.2. When Zl, Z2 and Z3 are calculated the rolling resistance of the truck should be taken into
account with the values 0.015 for driven and 0.01 for non driven wheels.
Straight Line Braking on Ice
Justification
Straight line braking on a homogeneous surface is the classic and basic way of testing the braking performance of vehicles. The ECE/EEC antilock braking regulations prescribe straight line low friction tests. The friction level is however allowed to be as high as 0.4. A test on ice is therefore regarded as a useful winter service approval requirement.
Tests carried out by VTI
Straight line antilock braking tests on ice have been made in comparison with
' locked wheel braking best driver control braking
' peak friction measured with single axle brak-ing accordbrak-ing to ECE/EEC antilock regula-tion
' Standard reference tyre friction coefficient measured with the Swedish constant slip (13-15 percent) friction test vehicles BV 11 and BV 12 (see figure 6.1 and 6.2) measured at 40 and 20 km/h. BV 11 had a 4.00-8 tyre and BV 12 a 5.60 - 15 PIARC Europe tyre both with rib tread, in accordance with ISO TR 8349 on friction measurement. Tests were carried out with the following vehicles which are shown in figure 2.1.
0 1980 with a two axle heavy truck and a two axle drawbar trailer both equipped with two antilock systems, Girling and WABCO. (Ve-hicle 1 and 5)
0 1981 with the same vehicles (1 and 5) now equipped with three antilock systems, Girling
GX, WABCO and Bosch. In addition a three
axle truck with Bosch antilock system was used. (Vehicle 3)
0 1984 with a three axle truck and a two axle drawbar trailer with a prototype system. (Vehicle 4 and 6)
0 1985 with a three axle truck (Vehicle 2) equipped with a new version of the WABCO antilock system and with two passenger cars, Audi and Honda.
' 1986 with three passenger cars, Audi, Ford Scorpio and Volvo.
Tests have been made from initial speeds ranging
from 70 to 35 km/h for trucks and trailers and, for
passenger cars from 110 to 50 km/h.
Most of the tests have been done in the temperature range -5°C to -20°C but tests have also been made
near 0°C and down to 30°C. Except in 1980 the tests have been made on ice roughened by the special multiwheel trailer with studded passenger car tyres shown in figure 4.1. The treatment results in a somewhat higher and more uniform friction and reduces polishing effects which tend to lower the friction.
Results
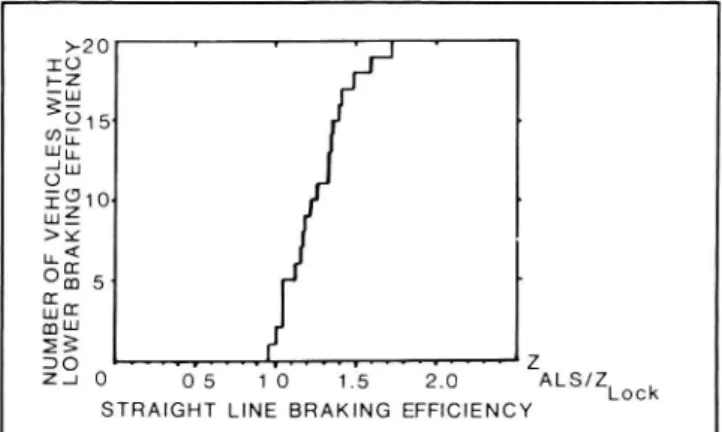
The results are summarized in figure 6.3, 6.4, 6.5, 6.6 and 6.7.
From the figures can be seen that as a rule the
braking efficiency with antilock systems is higher than with locked wheels and higher than best driver
perfor-mance. In tests with laden and unladen vehicles the
unladen vehicles tend to get higher deceleration but not necessarily higher braking efficiency based on
peak value.
The 75 percent efficiency required by ECE/EEC regulations is not always met on ice by antilock
systems for heavy vehicles. For the tested passenger
cars with and without studs the efficiency is close to
100 percent.
Longitudinal friction coefficients obtained with the reference tyres on friction test vehicles BV 11 and BV
12 according to the constant slip method gave the
same values as the peak friction coefficients obtained by single axle braking according to ECE Regulation 13 both for a truck and a passenger car with standard
tyres (0.17).
Discussion
According to Annex 10 in ECE regulation 13 it is for normal brakes allowed to have a braking effi-ciency of 50 percent at a friction coefficient of 0.2. lt could therefore be debated if the efficiency require ments on antilock systems on ice should be as high as 75 percent of the peak friction coefficient. The test results indicate that 90 percent of the locked wheel friction could be a more suitable requirement. A locked wheel test is also the simplest and least expensive alternative. ln order to avoid stability prob lems the locked wheel braking tests on ice are recommended to be done from an initial speed of 40
km/h.
Proposal for a straight ahead braking test
on ice
Based on the field test experience and theoretical considerations the following test is proposed.
Test surface: The test surface should be ice with a
locked wheel friction of 0.1 1 0,05 or a peak friction of 0,20 i 0.05 measured with the test vehicle itself or
the friction test vehicle BVll or equivalent equipment. Roughness of the ice by means of the special multi-wheel trailer according to figure 4.1 is recommended.
The air and ice surface temperature should be below
Test speed: The initial speed shall be 40 km/h for vehicles with tyres without studs and 50 km/h for tyres with studs (additional test for passenger cars). Braking tests: Make locked wheel and antilock brak-ing stops with a pedal force that on high friction would give at least 5 m/sz. The mean value of the results from at least three tests of each type should be used for the efficiency calculation. For each test the mean deceleration is calculated by the formula a =5.56/T m/s2 where T is the time from V = 35 km/h to V = 15 km/h.
Minimum requirement on braking efficiency:
aALS/aL
_>_ 0.9 or (ZALS/ZLOCR)_>_O.9
aALS = Mean deceleration with the antilock sys-tem operating. ZALS = aALS/9.81
aL = Mean deceleration with all wheels
Trailer tests: Trailer tests are made by braking only the trailer and correcting for the rolling resistance of the towing vehicle. The rolling resistance coefficient for nondriven wheels may be assumed to be 0.01 and for driven wheels 0.015. A better alternative is to make a coast down test with the towing vehicle alone. Alternative test method: Tests may also be performed according to the procedure prescribed by ECE/EEC regulations but on the same ice surface. It is consid-ered as more difficult to carry out and meet the requirements of this test.
Transition Test From Low to High
Friction
Justification
When a vehicle with normal brakes is braked on very low friction and suddenly encounters a transition to a high friction surface the braking torque applied by the driver is immediately fully utilized up to the
Reference
wheel
Figure 6. Friction test trailer BV11
440
Figure 6.2. Friction test vehicle BV12
limit of adhesion for each axle as they pass on the new surface.
In the same situation but braking a vehicle with an antilock system fully adapted to the low friction there is a risk that the pressure recovery might be very slow and result in an unacceptably long braking distance compared with a normal braking system. The new ECE/EEC antilock braking regulations therefore de-mands a test in this respect. The requirement on the high/low friction ratio is however only 2:1 which is low for winter service conditions.
Tests carried out by VTI
Tests with one heavy duty truck antilock system on ice with very low friction resulted in pressure drops to near zero with recovery rates of not more than 3 bar/sec that could not be influenced by a sudden transition to high friction. This corresponds to about 1.5 seconds to reach 4.5 m/s2 deceleration. Transition tests with other systems indicate that 0.7 seconds is a reasonable target from a technical point of view.
Discussion
If the vehicle deceleration is measured the wheel-base has to be taken into account. At 50 km/h an additional time delay of 0.7 seconds will cover all practical cases. A total deceleration transition time to
4.5 m/s2 of 1.5 seconds for heavy duty vehicles and
1.0 second for passenger cars has been considered to be a reasonable requirement for winter service.T H NCY m o 15' _ . L O . T 01 7 vv N U M B E R OF V E H I C L ES WI L O W E R BRA K I N G EF FI CIE - Z 2.0 ALS/Z O 5 10 1.5 Lock
STRAIGHT LINE BRAKING EFFICIENCY
O
Figure 6.3. Straight line antilock braking efficiency in relation to locked wheel braking
(Z
ALS/Z
Driver) 100
% 0,078/0,073 J107
& 0,077/0,069 1112
C% 0,116/0,080 '
I146
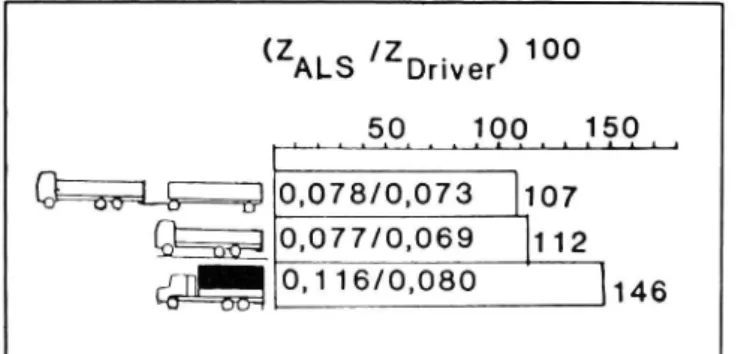
Figure 6.4. Straight line antilock braking test results.
Comparison with test driver performance
Proposed winter service test
The test shall be made with full brake application at a pressure that corresponds to a deceleration of at
least 5 m/s2 starting on a low friction surface which
must not give the vehicle a higher deceleration than 1.5 m/s2 with the antilock system in operation. The vehicle speed at the transition to high friction must not be less than 50 km/h. The high friction surface must allow an antilock braking deceleration of at least 4.5 m/sz. This deceleration must be reached within 1.5 seconds for heavy duty vehicles and within 1.0 seconds for passenger cars. This time is measured from the front axle transition time.Hybrid Laboratory Testing A Future
Type Approval Procedure?
The practical difficulties are considerable from both technical and economical aspects in obtaining test tracks that give the desired friction characteristics and are large enough for safe high speed and cornering tests. In fact they are so large that the ECE/EEC regulations regard peak friction coefficients up to 0.4 at 40 to 50 km/h as low and do not specify speed or slip characteristics of the tyre/road adhesion.
Further-(ZALS/KECEHOO
so
100
150
AAAAAAAAAAAAAA« - O,17/O,16
105
& 0,21/0,20
106
% O,16/O,17
94
% 0,11/0,09 __]123
53% 0,17/o,23174
% 0,15/0,14
j107
(ZALS/KBV11)1OO
.39 190
:=»
0,17/0,17 3100
(älgen/0,17 Isa
Q313557650J7/on7
Jtoo
1520.
A AFigure 6.6. Straight line antilock braking test results with standard tyres. Comparison with fric-tion test trailer BV11
more the problems connected with brake lining char
acteristics must not be forgotten.
For antilock systems with electric wheel speed
signals these problems can be eliminated by real time computer simulation of the tyre/ road characteristics, brake torque characteristics and yehicle motion dy-namics including wheel speed sensor signals. The real vehicle that is to be tested is connected to the computer through an interface so that the simulated
wheel speed signals are receiy ed by its antilock system
controller and the wheel brake cylinder pressures measured by sensors on each wheel are fed back to the computer. During the test the yeliicle is stationary in the laboratory with the engine running. lhe test
engineer has only to apply the brakes after starting the computer program.
This technique has been used by VTI with
promis-ing results.
At present it is possible to simulate:
° Straight braking on a homogeneous surface ' Straight braking on a split friction surface
with steering corrections based on yaw mo-tion
0 Braking during steady state cornering with constant steer input
' J-turn braking with constant steer input ap-plied at the same time as the brakes
(2 /K )1oo ALS BV12 A_LL5ÅOÅ A A 41901144 1§OJ ggg; 0,17/O,16 1106
% 0,15/0,16
94
ggg _] 0,17/0,18
94
Figure 6.5. Straight line antilock braking test results. Comparison with ECE/EEC friction coeffi-cient
Figure 6.7. Straight line antilock braking test results with standard tyres. Comparison with fric-tion test vehicle BV12
' Braking on a surface with changing friction can also be simulated as the computer pro-gramme contains two tyre models for each wheel
Validation simulations have been made with a two axle truck with an unladen weight of 6500 kg and a laden weight of 13000 kg. The vehicle was equipped with three different types of antilock systems. This vehicle was also used in the already mentioned tests on real ice tracks split friction tracks as well as on high friction tracks.
The following tests were used for the validation: ' Straight braking on homogeneous ice. Initial
speed 10 and 20 m/s
0 Straight braking on a split friction surface. Initial speed 10 and 20 m/s
' J-turn braking on ice with constant steering input corresponding to 100 m radius applied at the same time as the brakes. Initial speed 11 m/s
442
' Straight braking on a high friction surface with the peak friction coefficient 0.6. Initial speed 30 m/s
In all the tests the ranking order in performance was the same in simulation and real test. The general
characteristics in terms of deceleration, lateral
acceler-ation and yaw behaviour over time were also quite well reproduced. This also applies to wheel speeds and brake pressures. Tests were made both with identical
tyre data on front and rear wheels and with somewhat
reduced friction on the rear wheels. The best results were obtained in the latter case. This is in line with the fact that ice friction is reduced by the polishing effect of slipping tyres. In this case the front tyres polish the ice with the rear tyres. It is not believed that this method of testing can replace real world tests but it looks promising as a future complement for evaluating antilock system performance under condi-tions that are too difficult, expensive or dangerous to require in real type approval tests.