environmental impacts from
Swedish consumption
Synthesis report of methods, studies
performed and future development
NATURVÅRDSVERKET
Swedish consumption
Synthesis report of methods, studies performed and futuredevelopment
Author:
Hanna Brolinson, Louise Sörme, Viveka Palm, Arnold Tukker, Edgar Hertwich and Anders Wadeskog
Orders
Phone: + 46 (0)8-505 933 40 Fax: + 46 (0)8-505 933 99
E-mail: natur@cm.se
Address: CM Gruppen AB, Box 110 93, SE-161 11 Bromma, Sweden Internet: www.naturvardsverket.se/bokhandeln
The Swedish Environmental Protection Agency Phone: +46 (0)8-698 10 00 Fax: +46 (0)8-20 29 25
E-mail: registrator@naturvardsverket.se
Address: Naturvårdsverket, SE-106 48 Stockholm, Sweden Internet: www.naturvardsverket.se
ISBN 978-91-620-6395-5.pdf ISSN 0282-7298 © Naturvårdsverket 2010
Preface
The governmental bill 2010 ‘Swedish environmental objectives – for a more effec-tive environmental work’ stated:
“The overall goal of environmental policy is to provide the next generation a society in which the major environmental problems in Sweden have been solved. This should be done without causing increased environmental and health problems outside of Sweden. The overall goal requires an ambitious environmental policy in Sweden, EU and international contexts.”1
Swedish Environmental Protection Agency has therefore asked Statistics Sweden to assess methods to assess global environmental impacts caused by consumption in Sweden.
The project group consisted of Hanna Brolinson (project manager), Louise Sörme and Viveka Palm, at Statistics Sweden. The authors of the report is Hanna
Brolinson, with input from Louise Sörme (especially the section about chemicals), Viveka Palm, Anders Wadeskog (especially the sections concerning input-output analyses), Statistics Sweden , at the Unit of environmental economy and natural resources. The researchers Arnold Tukker, Professor of Sustainable Innovation, NTNU and Edgar Hertwich, Professor, Department of Energy and process engi-neering, NTNU contributed with the international outlook and input on recent re-search in the field.
Stockholm in December 2010
Swedish Environment Protection Agency
1 Authors own translation from Prop. 2009/10:155
Contents
SPREFACE 3 SUMMARY 5 1 INTRODUCTION 8 1.1 Background 8 1.2 Purpose 10 2 METHOD 123 CONSUMPTION AND ENVIRONMENTAL IMPACTS 13
4 METHODS TO LINK ENVIRONMENTAL IMPACTS TO
CONSUMPTION 17
4.1 Life cycle assessment 18
4.2 Environmentally extended input-output analyses 21 4.3 Life cycle assessment in combination with input-output analyses 24
5 AREAS OF ASSESSMENT 26
6 RESULTS AND DISCUSSION 30
6.1 Greenhouse gas emissions 30
6.2 Other emissions to air 38
6.3 Chemicals 40
6.4 Water use 47
6.5 Land use 52
6.6 Biodiversity 56
7 CONCLUSIONS 60
8 ACRONYMS AND ABBREVIATIONS 63
Summary
The output of the project is a synthesis of methods to assess environmental impacts in other countries caused by consumption in Sweden. Over the last couple of years a number of studies have been performed testing methods and refining data sets for these types of studies. The following six areas of assessment are taken into account in this study: greenhouse gas emissions, other emissions to air, chemicals, water use, land use and biodiversity. The report includes short introductions to methods used in the different impact areas, references to performed studies and recent re-search. The data availability and available time series are mentioned as well as the methods’ strengths and weaknesses. The work is performed by literature studies, references to scientific articles, working papers and ongoing projects in Sweden and internationally.
Generally, when calculating environmental impacts caused by consumption in other countries one can either use a bottom-up method or a top down method. In the first case the impacts caused during the production processes for each product that is consumed are summed (LCA based methods). In the other case a consump-tion view is applied, i.e. data on consumpconsump-tion of a whole naconsump-tion is combined with environmental data for each industry branch and product categories (input-output based methods). There are also several hybrid methods, for example LCA methods that use input-output based data to fill in data gaps. Some of the methods described in this report are more suitable than others to use in further analyses, for example in designing policies. These methods are the ones which links environmental impact to the total economy in a nation. To get a useful indicator on the environmental pressures linked to consumption we recommend choosing a method which can be used in further analyzing. An input-output based model makes it possible to study what implications changes in consumption, or changes in emission intensities, can have on environmental impacts.
For two of the six assessment areas there exist mature methods to assess environ-mental impacts in other countries caused by consumption in Sweden, namely for greenhouse gas emissions and other emissions to air. The recommended methods to use for these areas are the environmentally extended input-output model. Data and time series are published by Statistics Sweden. Even though these methods are considered mature, they are still under development and enhancements can be fore-seen in a near future. To go further with these analyses, one could start looking deeper into the factors that the consumption model can provide. That means com-paring results by product groups and also to focus on the improvement of environ-mental data that are needed to calculate country intensities, i.e. for emissions caused in the countries where the production process takes place.
For emissions of chemicals we are suggesting to apply an input-output based ap-proach, which to our knowledge, still has not been tried out for Sweden. We
sug-gest using the Pollutant Release and Transfer Register (PRTR) which contains data on 90 emissions on substances by industry in an environmentally extended input output analyses. For chemicals there is a possibility to weight the chemicals ac-cording to an existing method or to work with specific chemicals. When weighting the chemicals a ”toxic potential” is obtained, which sums up the loads from differ-ent substances emissions. Emission intensities for differdiffer-ent trade partners must be developed to get good result on emission in other countries. On the input side, i.e. the use of chemicals, there are experiences to use input-output analyses.
For the three remaining areas, land use, water use and biodiversity there are no straight forward and ready to use methods or data sets. Instead we suggest initiating studies within the areas and point out possible ways to go forward. The assessment of these areas probably requires the dimension of the state in the environment, as the linkage between environmental impact and pressure is not always obvious. Regarding land use one can add the land use and land cover statistics to the input-output model. A prerequisite is to divide these data on industry branches. This has not been performed to a full scale and need to be initiated. Probably some reference to the state in the environment needs to be done, by using for example the HANPP index (human appropriation of net primary production in earth’s terrestrial ecosys-tem), in order to get interpretable results. The HANPP index gives a measure on how much biocapacity that is removed from the available biocapacity and is based on forestry and agriculture statistics, and global data is available. To get relevant land use data in the countries where the products that we import are produced the availability on international data must first be mapped. This method has yet to be tested before we can say how the results can be interpreted. A product view can be pragmatic in this area as a starting point. Critical products could possibly be identi-fied, products known to be linked to negative land use effects, if experts can set up relevant criteria. The Swedish trade with these products can be analyzed, pointing out how Swedish consumption contributes to changes in land use in different coun-tries. A possible way forward would be to utilize land use data for some major categories such as agriculture or forestry in the countries from which Sweden im-ports goods and gradually develop a database with more environmentally relevant information on the type of land use.
Regarding water use one can add water use statistics to the environmentally ex-tended input-output model. The availability on international data must first be mapped in order get relevant water use data in the countries where the products that we import are produced. This could be combined with some kind of index which indicates the state in the environment to be useful, as in the case of land use. Such an index is for example the water scarcity index which shows the global status in water basins. One could also apply a product perspective. It is known that agricul-tural products are those most related to water problems globally. These products can be identified in the Swedish trade, data can be analyzed and this together with the scarcity index could say something about Swedish consumption’s contribution
to water related problems. These suggested methods have yet to be tested before we can say how the results can be interpreted.
Biodiversity is a complex area and is also connected to the other areas to a large extent. There is no biodiversity index ready to use and probably not foreseen in a near future. However, if the five areas above are added to an environmentally ex-tended input-output model they probably together give a relatively good measure on biodiversity related pressures. As a starting point, however, a product view can be useful to apply. In this case critical products must be listed, if this can be done by experts, so that the study of the trade with these can be performed. The outtake of wood and fish should at least be included in such a study.
As the six areas of assessment differ in method and data availability there are sev-eral options for the scope of further studies and research. Firstly one can make the most mature methods even better, to make more accurate calculations and hence focus on greenhouse gas emissions and other emissions to air. Secondly, one can initiate new studies to increase the number of extensions in the input-output based calculations. Emissions of chemicals, is an extension that seem to be possible to add to the environmentally extended input-output model under some limitations. One can also focus on those diverse areas where no exact methods are available and initiate studies or research so that these can be linked to consumption in Sweden in a near future. Land use and water use can probably also be added to the environmentally extended input-output model, whereas biodiversity seem to be more distant.
1 Introduction
1.1 Background
The environmental impact of goods has become more and more in focus since the 1990s (Swedish EPA, 2002). The look on environmental problems have shifted from local point sources of pollutants to diffuse sources, from local and regional environmental problems to global problems with an increased degree of complexity and a longer time period between cause and effect. The fact that environmental impacts occur not just during production processes but also throughout the entire lifecycle of a product has become obvious. The awareness has risen of producers' ability to reduce impact throughout the lifecycle by analyzing the construction and design of the products. Consumers also have become aware of that they can influ-ence both direct and indirect environmental impact by their choice of product. In later studies it has been shown that the level of income and gender, are factors that are strongly linked to the amount of emissions caused by consumption (Carlsson-Kanyama, 2010). The carbon footprint of a nation is also strongly correlated with per capita consumption expenditure (Hertwich and Peters, 2009).
Historically environmental pressure has been viewed upon in a national, production view. This picture has changed during later years, not only due to the fact that some environmental pressures literally moves across borders but also due to a much higher awareness of that a global economy makes consumption patterns in one country linked to environmental impacts in the producer country. Hence, a consumption view is needed to complete the picture. In an open economy, such as Sweden, a part of the environmental pressures are due to exports as well as that a part of the pressures abroad are due to consumption in Sweden.
In industrialized countries environmental technology is used to keep point sources of emissions down within the nation. There is still the fact that the consumption contributes to pollutants abroad, sometimes to a lesser extent than if the same goods where produced within the nation, sometimes to a larger extent. Of this fol-lows that changes of consumption patterns might be necessary to a shift towards a more sustainable life style as emission limitation within a nation might not be suf-ficient. A production view and a consumption view must go hand in hand to com-plete the picture of environmental impacts, and to avoid that production is moved to countries where the environmental policy is less developed.
When viewing environmental pressures and resource use in other countries, caused by consumptions in Sweden, the question is raised: what we can do about it in Sweden? More knowledge is needed to clarify how the consumption perspective can be used to eventually develop instruments to shift to a more sustainable life style. It would also be useful to rank, which consumer goods, that are most de-pendent on consumer behavior and hence would be fruitful to influence to a more
sustainable level. For example, transports and leisure items (toys, electronics) are goods that are strongly connected to consumption levels (UNEP, 2009).
In the governmental bill ‘Swedish environmental objectives – for a more effective environmental work’ it is stated:
“The overall goal of environmental policy is to provide the next generation a society in which the major environmental problems in Sweden have been solved. This should be done without causing increased environmental and
health problems outside of Sweden. The overall goal requires an ambitious
environmental policy in Sweden, EU and international contexts.”2 (Au-thor’s emphasizing)
As implied above, environmental pressures may not increase in other countries, and hence an international perspective must be applied in the work with the envi-ronmental objectives. It has been shown that in some cases, apparent decoupling3 of CO2 emissions or primary material use from economic growth is in fact the re-sult of the relocation of material and energy intensive production to other countries (Giljum et al., 2008b; Wiedmann et al., 2008), a situation that must be avoided. In the 2010 assessment of the Swedish environmental objectives, a consumption perspective was implemented as a first step to meet new guidelines from the gov-ernment. This was published in the ‘de Facto’ report (Miljömålsrådet, 2010) Hence, the topic is high on the environmental policy agenda and a lot of studies and research have been performed in the latter years.
The European Environment Agency has adopted a framework to describe the inter-actions between society and the environment, DPSIR:
• Driving forces (activities causing an environmental problem) • Pressures (physical activities causing the environmental problem) • States (the state in the environment)
• Impacts (effects or consequences)
• Responses (measures to decrease the problem)
When assessing environmental impacts from consumption the focus is on driving forces and pressures and not the state in the environment. In practice this means that in the case with emissions of carbon dioxide, the focus of assessment is on the activity: the use of fossil fuels and the release of carbon dioxide, not the state in the environment or the impact in the environment, i.e. the concentration of CO2 in the atmosphere or average temperature.
2 Authors own translation from Prop. 2009/10:155
3 In economics decoupling refers to the ability of an economy to grow without corresponding increases
The responses in the DPSIR model are the measures taken to decrease the envi-ronmental problem, contained in the envienvi-ronmental policy in the society. Different environmental policy instruments are used for different environmental impacts. These can be of different types and the most common are: legal, fiscal (e.g. envi-ronmental taxes and subsidies), voluntary policy levers (e.g. advice, information agreements). Some of the assessment methods described in this report are more suitable than others to use in further analyses, for example in policy design. These are the ones which link environmental impact to the total economy in a nation, as they enable the evaluation how changed consumption levels implicates changes in environmental pressures.
The focus of climate change has put much of the spotlights on greenhouse gas emissions. However, there are other areas which also need to be assessed to get a total view of the pressures caused by consumption. At the same time, many of the environmental pressures are linked to the use of fossil fuels and hence a simplifica-tion can be practical and relevant.
In the assignment of this study three starting points were given for the choice of areas of assessment:
1. The areas assessed in the consumption part of the 2010 deFacto4 report 2. Biodiversity
3. The Swedish Environmental Objectives
These areas should also be complemented if other areas of assessment where found to be of relevance. Hence, as a start an overview of studies of impacts from con-sumption was performed.
1.2 Purpose
The output of the project is a synthesis report containing methods to assess global environmental impacts caused by consumption in Sweden. The areas to be covered are: emissions of greenhouse gases, other emissions to air, chemicals, water use, land use and biodiversity of which the five first were covered in the 2010 assess-ment of the Swedish environassess-mental objectives. The areas should also be comple-mented with other areas if found relevant and with the Swedish environmental objectives.
The report includes short introductions to methods used in different areas, as refer-ences to performed studies and recent research. The methods’ strengths and weak-nesses in its usefulness when assessing global environmental impacts from Swedish consumption will also be made. The report will also point out what important gaps
there are to be fulfilled before the global environmental impact from Swedish con-sumption can be made.
The compilation should also be able to be used to evaluate how the consumption perspective can be used in the assessment of the Swedish environmental objectives. The results will also be used to fulfill the tasks given by the governmental bill, ‘Swedish environmental objectives – for a more effective environmental work’5.
2 Method
The synthesis is a compilation of methods, studies performed and suggestions on how to move forward in finding methods to assess global environmental pressures caused by consumption in Sweden. The work has been performed by literature studies with references to scientific articles, working papers and ongoing projects in Sweden and internationally. The recommendations on methods to use or where to focus future work are made on the basis of the gathered expertise of the project members. However, as this is not a static area, recommendations can be subject to changes due to new discoveries of for us unknown research.
3
Consumption and
Environ-mental impacts
Consumption is the final use of goods, which includes products as well as services. To keep track of the economy within a nation an internationally harmonized statis-tical System of National Accounts (SNA) is used. Statistics is reported to Eurostat6 at a regular basis and used within the nation for policy making. Within the national accounts the final demand is distributed on private and public consumption, in-vestments and exports and is met by domestically produced and imported goods, schematically shown in Figure 1. All the parts of final demand can be distinguished and handled separately in further analysis. Hence, the consumption within a nation is handled within the national accounts and is a part of final demand.
Domestic
production
Imports
consumptionPrivate Invest-ments ExportsFinal demand Public consumption
Figure 1 Goods and services from domestic production and imports is distributed on final demand by private and public consumption, investments and exports.
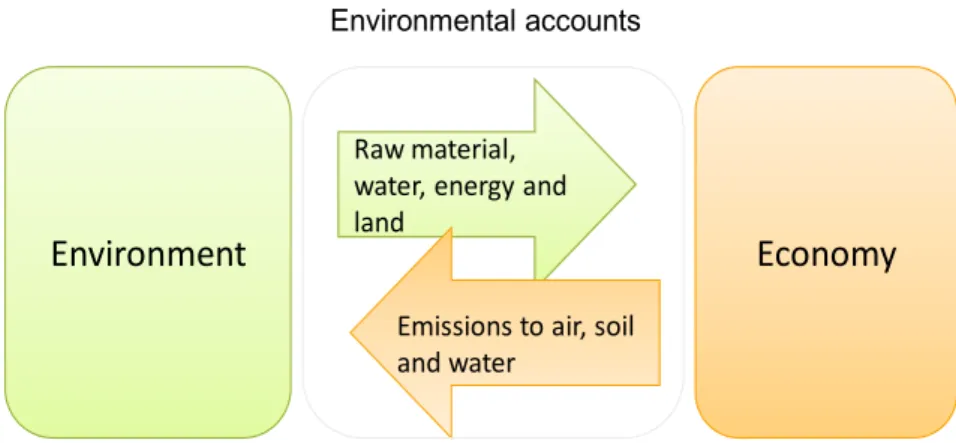
With a consumption perspective applied to environmental impact assessment the consumption of goods within a nation is concerned, whereas the environmental impact is distributed on product categories irrespectively of where in the world or where in the production chain the impact has occurred. To keep track of environ-mental impacts caused by consumption a system of environenviron-mental accounts can be used. The environmental accounts is a internationally harmonized statistical system that is designed to measure contributions from the environment to the economy (for example raw material, water, energy and land) and the impact on the environment from the economy (such as emissions to air, soil and water), as indicated in Figure 2.
6 Eurostat is the statistical bureau of EU
Environment
Economy
Raw material, water, energy and land
Emissions to air, soil and water
Environmental accounts
Figure 2 The environmental accounts describe the contributions from the environment to the economy and vice versa.
The environmental accounts also distinguish the environmental relevant activities (the environmental goods and services sector) and economic transactions from the national accounts (environmental taxes and subsidies). In the environmental ac-counts consumption is treated as a component of the final demand (Statistics Sweden, 2003).
In year 1993 Statistics Sweden, together with the National Institute for Economic research and the Swedish Environmental Protection Agency, was assigned to create a system to describe the relationship between the economy, environmental and natural resources, in monetary as well as physical terms and the state in the envi-ronment. At Statistics Sweden the work with environmental accounts started with the development of an accounting system for physical data linked to the economic activities described in the national accounts. In practice this means environmental and natural resource statistics connected to the industries, products groups and sectors that are used in the national accounts. A system, like the environmental accounts, that is based on the national accounts can also be called a ‘satellite sys-tem’ of the national accounts.
In year 2003 UN published a handbook about environmental accounts, Handbook of National Accounting – Integrated Environmental and Economic Accounting 2003 (SEEA 2003). According to SEEA 20037 there should be four categories of accounts:
• Flow accounts for pollution, energy and materials. These accounts provide
information at the industry level about the use of energy and materials as inputs to production and the generation of pollutants and solid waste.
• Environmental protection and resource management expenditure accounts.
These accounts identify expenditures incurred by industry, government and households to protect the environment or to manage natural resources. • Natural resource asset accounts. These accounts record stocks and
changes in stocks of natural resources such as land, fish, forest, water and minerals.
• Valuation of non-market flow and environmentally adjusted aggregates.
This component presents non-market valuation techniques and their appli-cability in answering specific policy questions.
The environmental accounts at Statistics Sweden consist of several parts and there is some developed statistics within three of the four categories listed above. In the work with this synthesis the following of the statistical production is of specific relevance:
• Emissions to air by industry sector
• Water accounts (water usage and emissions to water)
• Web-tool with input-output based simulation models with links between final demand, production, energy intensities and emissions
In further analysis, data on environmental related taxes and subsidies (both envi-ronmentally motivated and potentially harmful) can be retrieved from the environ-mental accounts at Statistics Sweden.
The web tool8 at Statistics Sweden is a platform for publishing the annual envi-ronmental accounts data in an analytical and interactive format. Data on twelve pollutants divided on stationary, mobile and process related emissions is presented by industry and in the same format as the annual detailed national accounts. The time series runs from 1993 to 2007. Added to this basis are a few simulation mod-ules based on input-output analysis. One of them is a household budget simulation module where the user can either compare emissions of CO2 by different household types (by region, income or demographics) or create a budget of their own, or changes in a given budget, and have that translated into changes in CO2 emissions. There are a number of possible development project for the web tool in the coming year. In a near future a linkage to, or inclusion of, environmental accounts data from other member states can be a reality. This opens up for more accurate esti-mates of the global effects of domestic consumption. With fairly detailed emission data per industry for our major trading partners, it will produce better estimates than has been possible to obtain until now.
The environmental accounting system does also allow for further analysis of some types of driving forces, such as increased consumption, changes of energy use or
changes in the use and in the demand for products and services over time. It is an international statistical system that allows for analysis of changing trade patterns and other economic driving forces on the environmental pressure. It is designed to use the existing economic statistics and environmental statistics and is in this re-spect a system that does not entail cumbersome new surveys that increase the bur-den on society’s information providers.
Within the EU environmental accounts is developed within several countries and the EU is proposing9 a regulation so that all member states will report environ-mental accounts data for some of the categories listed by the UN (SEEA 2003). The regulation is planned to be ready in 2011.
4
Methods to link
environ-mental impacts to consumption
This chapter contains an introduction to two principal methods that are used when linking environmental impacts to consumption, the LCA and the input-output based model. In the LCA a product view is applied and this can then be scaled up to the consumption. In the input-output based the consumption is linked to emis-sions and the result can then be divided into product groups or categories. These types are referred to as the bottom-up method or the top-down method respectively. There are also hybrid methods, for example LCAs where missing data is modeled using input-output methods.There are also several kinds of ‘footprint’ calculations when looking upon envi-ronmental impacts caused by consumption. Different footprints can be used to communicate environmental impacts caused by consumption. Common for the different footprints, for example the ecological footprint10 and the water foot-print11, (their start pages on the Internet are shown in Figure 3) is that they aim to include all impacts related to consumption translated to a symbolic measure. The footprints can be used for assessment, and for communication, when the emissions are known. Within the ecological footprint method the term carbon footprint is also used. However, there is no unambiguous definition of a carbon footprint; it is used as a generic synonym for emissions of carbon dioxide connected to a certain prod-uct or region12. The term carbon footprint of nations has been used by researchers describing a method to assess the emissions of carbon dioxide linked to the eco-nomic activities within a nation (Hertwich, Peters, 2009). The method used in that case was a multi-regional input-output model, further described in this report in section 6.1.1. There are ISO standardization projects going on both for water foot-print and carbon footfoot-prints of products more related to the eco-labeling incentive then the assessment of environmental impacts caused by consumption.
10 http://www.wwf.se/v/ekologiska-fotavtryck/1127697-ekologiska-fotavtryck 11 http://www.waterfootprint.org/?page=files/home
Figure 3. Web pages for water footprints and ecological footprints
There are a number of other methods or concepts used when dealing with con-sumption and environmental impacts. Two of these are for example Planetary Boundaries13 and the concept ‘fair share in environmental space’14. The main pur-pose with Planetary Boundaries is to define boundaries within nine areas which may not be trespassed without risking unacceptable changes in the environment. However, the focus is not on Swedish consumption’s environmental impact in other countries and will therefore not be referred to in this synthesis. The main purpose with the environmental space concept is that there is a limited amount of resources that can be used in a sustainable way. The resource use is calculated in different areas, which goes hand in hand with the areas in this report. These two methods are more related to setting boundaries for consumption, and do not con-tribute with methods on how to calculate the environmental impact of Swedish consumption in other countries.
4.1
Life cycle assessment
A life cycle assessment, commonly abbreviated as an LCA, is an investigation and evaluation of environmental impacts of a given product or service caused by or necessitated by its existence in a life cycle perspective, illustrated in Figure 4. In-formation on environmental interventions is collected at a detailed level. The unique feature of an LCA is the focus on products in a life-cycle perspective, and includes raw material acquisition, production, use to waste management (Finnve-den et al, 2009).
An LCA of a product can answer questions like “What are the most important envi-ronmental impacts of a given product’s life cycle?” or “Which of these modifica-tions of a production process is preferable in an environmental perspective?”.
13 More information can be found at http://www.stockholmresilience.org 14 More information can be found at http://www.foei.org/
Figure 4 Life cycle perspective of products (goods and services). From
http://lct.jrc.ec.europa.eu/pdf-directory/Indicators-framework-for-public-consultation-16082010.pdf The method to use when performing an LCA is described in several ISO standards. According to ISO 140 40 and ISO 14044, the life cycle analyses proceeds through several steps, these steps can be summarized as:
Goal and scope
In the first phase, the goal and scope of study is formulated and specified in rela-tion to the intended applicarela-tion. The system boundary are also defined they deter-mine which unit processes are included in the LCA and must reflect the goal of the study. Finally the goal and scope phase includes a description of the method ap-plied for assessing potential environmental impacts and which impact categories that are included.
Life cycle inventory
This second phase 'Inventory' involves data collection and modeling of the product system, as well as description and verification of data. This encompasses all data related to environmental (e.g., CO2) and technical (e.g., intermediate chemicals) quantities for all relevant unit processes within the study boundaries that compose the product system. Examples of inputs and outputs quantities include inputs of materials, energy, chemicals and 'other' – and outputs of air emissions, water emis-sions or solid waste.
Life cycle impact assessment
The third phase 'Life Cycle Impact Assessment' (commonly referred to as LCIA) is aimed at evaluating the contribution to impact categories such as global warming, acidification, etc. It consists of several steps, characterization, normalization and weighting. Of which the latter are both voluntary according the ISO standard. Dur-ing characterization each emission or resource consumption is modeled quantita-tively. Normalization provides a basis for comparing different types of environ-mental impact categories (all impacts get the same unit). Weighting implies assign-ing a weightassign-ing factor to each impact category dependassign-ing on the relative impor-tance.
Interpretation
The phase stage 'interpretation' is an analysis of the major contributions, sensitivity analysis and uncertainty analysis. This stage leads to the conclusion whether the ambitions from the goal and scope can be met. More importantly: what can be learned from the LCA? All conclusions are drafted during this phase. Sometimes an independent critical review is necessary, especially when comparisons are made that are used in the public domain.
Figure 5 Basket-of-products in LCA
The weighting element has always been controversial as it includes social, politi-cal, and ethical values (Finnveden et al, 2009). Still the weighting procedure is widely used and it is therefore important to be aware of the method used. Methods for weighing are described more in detail by Finnveden et al. 2002.
To get a consumption view one can combine knowledge of consumptions patterns with LCA which would give information on the total environmental impact caused by consumption, illustrated in Figure 5. The basket-of-products reflects the envi-ronmental impact and the resources used that are associated with the final con-sumption of an average citizen in a country or region over the entire life cycle of the included products (goods and services). However, the choice of products has been a major obstacle, as it tends to be a rather subjective choice. The EU has initi-ated some studies that take this basket-of-products into account, for example a proposal on indicators15.
When performing LCAs the extensive data need is met by the use of LCA data-bases. There is no Swedish LCA database in use. The most used database is Ecoin-vent16, which is developed in Switzerland but include data from many other coun-tries as well. A new version of Ecoinvent is planned to be in use in the end of 2011. The Joint Research Center (JRC)17 is building an LCA database.
4.2
Environmentally extended input-output
analyses
The foundations of the environmentally extended output-model are the input-output tables in the national accounts and the emissions by industry sector.
In economics an input-output model uses a matrix representation of a nation's (or a region's) economy to predict the effect of changes in one industry on others and by consumers, government, and foreign suppliers on the economy. Input-output tables (usually referred to as IOTs) are commonly maintained by countries to keep track on the flow of products through the economy.
The input-output tables give a total table of how much (in monetary units), of which product categories, are supplied to the market within a nation. Figure 6 shows a screenshot of a symmetric input-output table for Sweden, where there are prod-ucts in the rows and sectors in the columns. In the input-output table the consump-tion is allocated on input goods, private and public consumpconsump-tion, investments and exports. For example, the first cell in the input-output table in Figure 6 tells how much input of agricultural products the agricultural sector has used during a given year.
16 http://www.ecoinvent.ch/
Figure 6 Symmetric input-output table from
http://www.scb.se/Pages/ProductTables____11040.aspx
The consumption within an open economy is dependent on imported goods. The input-output table reflects the situation within the nation and emissions of imported goods caused in other countries must be handled separately, this can be done in several ways using the domestic technology assumption, taking into account bilat-eral trade or making a multi regional model. These methods are further described in section 6.1.1.
It is also important to note that the emissions that are calculated from the input-output model are the indirect emissions, i.e. emissions caused during the produc-tion processes. For some emissions, for example CO2, the direct emissions, i.e. emissions caused during usage (fuel for transportation or heating purchased by households) are large contributors to the total emissions, and hence must be added separately to get a total view. Indirect emissions are also sometimes referred to as ‘upstream’ emissions whereas direct emissions are referred to as ‘downstream’ emissions.
Investments in national accounts are for example the consumption of durable goods, such as for example machinery, housing, and livestock. A large part of the investments in a given year depend on the depreciations done in production capital during that year. This means that the investments should probably be seen as inputs instead of a part of final demand. Of this follows, that the environmental pressures must be reallocated to the part of final demand that used the production capital. Practically this means reallocating a part of the environmental pressures from gross investments to private and public consumption and to exports, as well as to the production of the net investment goods.
The environmental accounts at Statistics Sweden reports data to Eurostat on twelve emissions by industries (this is part Air Emissions Account18), for example CO2, N2O, CH4, NOx and SOx. The calculations are based on the usage of fossil fuels per industry and applying general or plant specific emission coefficients. These emissions per industry are then used in the input-output based calculations of emis-sions caused by consumption. Both the emisemis-sions by industry and the consumption simulation can be found at Statistics Sweden’s web tool19.
Environmentally extended input-output analysis
The basic input output relationship developed by Leontief (Leontief and Ford, 1970) gives the relationship between the total output x and final demand y, by the following formula:
x = (I - A)-1 y (1)
(I-A)-1is the inverse matrix or Leontief matrix. By applying an
intensity matrix F (kg/SEK) on equation 1 an extensive quantity of the emissions E (kg) can be calculated. This is shown in equation 2.
E = F (I-A)-1 y (2)
All types of emissions, or any type of variable, can be linked to consumption using the input-output model, given that the emission data is available per industry sector so that the intensity (i.e. emissions related to the monetary output of the industry) can be calculated (equation given in box above). In a Dutch study (Nijdam and Wilting, 2009), as an example of a less expected variable linked to consumption, noise from road traffic was linked to different consumer goods, showing that it was mostly caused by the consumption categories ‘leisure’, ‘labour’ and ‘food’ and it was mostly linked to direct environmental pressure (i.e. the environmental pres-sures occurs when the good is consumed while the indirect load is linked to the process before consumption).
Examples of policy questions that can be answered by environmentally extended input-output analysis have been provided by Moll and Watson (2009) and those related to consumption referred to in the final report of the Era-Net SKEP Project EIPOT (EIPOT, 2009). The most relevant questions for this study follows, with examples:
18 http://epp.eurostat.ec.europa.eu/cache/ITY_OFFPUB/KS-RA-09-004/EN/KS-RA-09-004-EN.PDF 19 http://www.mirdata.scb.se/MDInfo.aspx
Which consumed product groups are most responsible for indirect pressures activated by consumption?
These questions have been answered in several studies referred to in this report, for example in the UNEP report (UNEP, 2010) and the ETC/SCP working paper (EEA, 2009). They both point out the categories food and drink, housing and mo-bility as activities causing large shares of environmental impact.
How are indirect environmental pressures distributed across the categories of final use (private household consumption, government consumption, invest-ments, and exports)?
Answering this question makes for example the environmental impact from public consumption visible in relation to private consumption. A country can have an export of goods that are produced with a large environmental pressure, but still have a consumption that is not so intensive. Different countries can also be ex-pected to have varying government consumptions and investment patterns.
What is the ratio of indirect environmental pressures caused by national con-sumption which are emitted domestically compared to those taking place in the rest of the world?
This is of interest when assessing to which degree environmental impacts caused by Swedish consumption contribute to environmental pressure in other countries. The difference can be an effect of the size of the trade, but also on the environ-mental legislation in the respective countries, and is also depending on the energy systems in respective countries.
How do environmental pressures activated by national consumption
compare with environmental pressures activated by national
produc-tion?
Answering this question could increase the awareness of how much of the total emissions take place in other countries in which Sweden’s environmental policies are not effective.
4.3
Life cycle assessment in combination
with input-output analyses
As mentioned in the introduction to this chapter, there are hybrid methods combin-ing LCA and the input-output based method. In this hybrid LCA, or input-output LCA (IO LCA) (Suh, 2009), are the input-output tables connected to LCA studies. There are several developments of the hybrid techniques, such as the tiered-hybrid approach, the IO-based hybrid approach and the integrated hybrid approach (Suh and Huppes, 2005).
A benefit when using the hybrid technique is that the need to identify and exclude insignificant processes is reduced or eliminated as the input-output tables account for all upstream processes.
Another advantage with the hybrid technique is the elimination or decrease of the truncation error. Life cycle analysis and such process-analysis techniques are con-nected with a truncation error20. It has been shown that this error can be of consid-erable size, in some cases as much as 50 %. A study (Lenzen, 2001) shows that this error can be avoided when incorporating the LCA into an input-output model to a hybrid method.
5
Areas of assessment
As a starting point, in the assignment it was given to take the following environ-mental areas into account in this synthesis:
• Greenhouse gas emissions • Other emissions to air • Chemicals
• Water use • Land use • Biodiversity
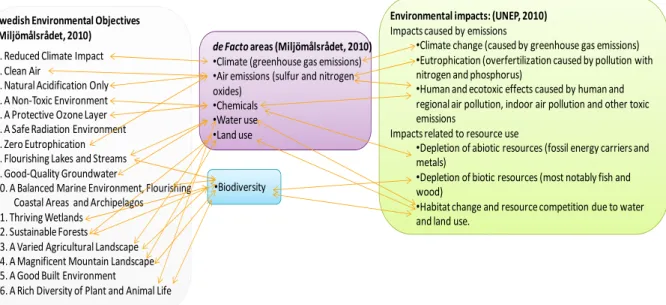
It was also given in the assignment to take the Swedish environmental objectives into account when relevant. The Swedish environmental objectives are listed in Figure 7:
1. Reduced Climate Impact
2. Clean Air
3. Natural Acidification Only
4. A Non-Toxic Environment
5. A Protective Ozone Layer
6. A Safe Radiation Environment
7. Zero Eutrophication
8. Flourishing Lakes and Streams
9. Good-Quality Groundwater
10. A Balanced Marine Environment, Flourishing Coastal Areas and Archipelagos
11. Thriving Wetlands
12. Sustainable Forests
13. A Varied Agricultural Landscape
14. A Magnificent Mountain Landscape
15. A Good Built Environment
16. A Rich Diversity of Plant and Animal Life
Figure 7 The Swedish environmental objectives from www.miljomal.nu
For the completeness of the synthesis report it was given in the assignment to com-plete with other areas if found relevant. A recent report Assessing the Environ-mental Impacts of Consumption and Production21 published by United Nations Environment Program (UNEP, 2010) gives a summary of environmental impacts of consumption and production. The report prioritizes which impact that globally are the most important and which consumption categories that contributes to them the most. As the UNEP report gives a summary of recent research in the field, it has been used in this synthesis as a reference when choosing areas of assessment and impacts.
According to the UNEP report the prioritization of environmental impacts are those due to:
• Impacts caused by emissions
- Climate change (caused by greenhouse gas emissions)
- Eutrophication (overfertilization caused by pollution with nitrogen and phosphorus)
- Human and ecotoxic effects caused by human and regional air pol-lution, indoor air pollution and other toxic emissions
• Impact related to resource use
- Depletion of abiotic resources (fossil energy carriers and metals) - Depletion of biotic resources (most notably fish and wood) - Habitat change and resource competition due to water and land
use.
The UNEP report also ranked which activities that have the most significant impact on environment globally. For industrialized countries these activities are:
• Housing • Mobility • Food
• Manufactured products.
The four areas are in alignment with the Sustainable Consumption and Production (SCP)22, a program within the European Environmental Agency (EEA) which embraces both a production view and a consumption view on emissions. Within the SCP there is a work ongoing to develop indicators to the reporting and follow-up of the shift towards sustainable production within nations, as well as sustainable con-sumption patterns for the nations. There is a suggested framework for the indica-tors within three main elements: Headlines (this element contains overall informa-tion on sustainability), Status and Trends in Consumpinforma-tion and Producinforma-tion and The Framework for Change. The element Status and Trends in Consumption and Pro-duction contains indicators on resources, proPro-duction, products, consumption, waste and key consumption cluster (food and drink, housing and buildings and mobility). This synthesis aims to cover the five areas that were assessed in the consumption part of the 2010 assessment of the Swedish environmental objectives report, ‘de Facto’ 2010 complemented with biodiversity, as well as the Swedish environ-mental objectives, when relevant. An overview of the areas that are wished to be covered is given in Figure 8 with their most important interconnections.
22 More information on ETC/SCP on http://scp.eionet.europa.eu/ and the indicator framework on
Environmental impacts: (UNEP, 2010) Impacts caused by emissions
•Climate change (caused by greenhouse gas emissions) •Eutrophication (overfertilization caused by pollution with nitrogen and phosphorus)
•Human and ecotoxic effects caused by human and regional air pollution, indoor air pollution and other toxic emissions
Impacts related to resource use
•Depletion of abiotic resources (fossil energy carriers and metals)
•Depletion of biotic resources (most notably fish and wood)
•Habitat change and resource competition due to water and land use.
1. Reduced Climate Impact 2. Clean Air
3. Natural Acidification Only 4. A Non-Toxic Environment 5. A Protective Ozone Layer 6. A Safe Radiation Environment 7. Zero Eutrophication 8. Flourishing Lakes and Streams 9. Good-Quality Groundwater
10. A Balanced Marine Environment, Flourishing Coastal Areas and Archipelagos 11. Thriving Wetlands
12. Sustainable Forests
13. A Varied Agricultural Landscape 14. A Magnificent Mountain Landscape 15. A Good Built Environment
16. A Rich Diversity of Plant and Animal Life Swedish Environmental Objectives (Miljömålsrådet, 2010)
de Facto areas (Miljömålsrådet, 2010) •Climate (greenhouse gas emissions) •Air emissions (sulfur and nitrogen oxides)
•Chemicals •Water use •Land use
•Biodiversity
Figure 8 Areas of assessment with their most important interconnections.
As can be seen in Figure 8 the areas are well interconnected, indicating that the proposed areas in the assignment are sufficient to assess the most important envi-ronmental impacts caused by consumption, according to UNEP (2010) and the Swedish environmental objectives. There are however two environmental objec-tives that do not have any clear interconnections to the proposed areas for the syn-thesis: 6. A Safe Radiation Environment and 15. A Good Built Environment. Ques-tions regarding radiation are more related to health aspects than the environment. The target for the built environment includes targets about waste, noise and energy use in buildings and others. While noise is more of a health issue and energy use is related to the objective reduced climate impact, waste needs to be elaborated.
The creation of waste is linked to consumption levels and the individuals’ handling of waste have also an effect on how much that is recycled. Waste connected to consumption is a quite unexplored area. A study performed in Finland 1999 (UNEP, 2009) showed that private consumption caused 17 % of the waste produc-tion in Finland, compared to 64 % of exported products. The waste caused by pri-vate consumption arises both from the extraction of raw material (in the production country), in the production processes (in the production country) and during use and scrapping of the product (in the country of consumption). As waste is also a product of trade, the trade of waste is also of relevance. There is also an illegal trade flow of waste globally. In Sweden and in the EU, waste is classified as either hazardous or non-hazardous waste. Within the environmental accounts data is pub-lished regularly on waste by industry. In theory, the data on waste can be linked to input-output analyses. The data on waste in other countries can be of different qual-ity and not always comparable as the classification of waste might differ from one country to another. Within the Pollutant Release and Transfer Register (PRTR)
there is some data of the transportation of waste. However, in the PRTR the limits of the amount of waste that must be reported are set high, so there is a large gap of data foreseen.
The different environmental problems related to waste is important. The different environmental aspects are linked to transportation, land use and emissions to air, soil and water. The handling of waste is linked to the environmental policy in each country. Some of the waste can be seen as a resource. In Sweden waste is used as an energy resource in district heating plants of which a part can be seen as renew-able. The arise of hazardous waste in the production processes in the countries from which Sweden imports goods might be more interesting to study. The amount of waste is not a sufficiently specific measure to be linked to consumption. The area of waste and its impact on environment and health in different countries need more exploration before it can be linked to environmental pressures caused by consumption in Sweden.
6
Results and discussion
This chapter contains short introductions to each assessment area, studies per-formed, a section about time series and data availability, a discussion about future development and a summary, for each of the areas. greenhouse gas emissions, other emissions to air, chemicals, land use, water use and, biodiversity.
6.1
Greenhouse gas emissions
Greenhouse gases (GHG) is the common name for gases that contribute to the greenhouse effect. The gases that are most important are carbon dioxide, methane, nitrous oxide, ozone and, water vapour. Carbon dioxide mainly arises from the use of fossil fuels, ozone from transportation and water vapour from various human activities such as combustion and transportation. Methane mainly arises from agri-cultural activities and nitrous oxides from agriagri-cultural soil management and mobile sources (Suh, 2009). Emissions of greenhouse gases are commonly presented in CO2 equivalents.
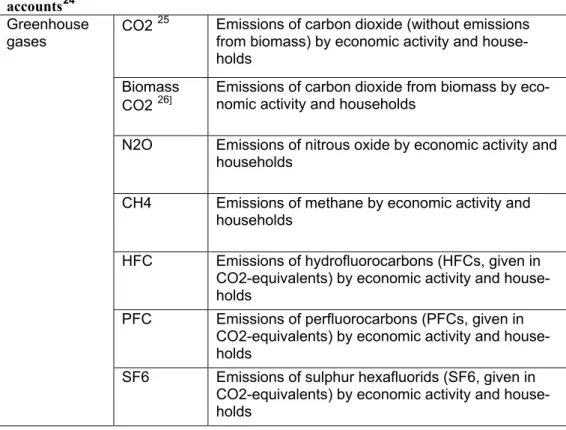
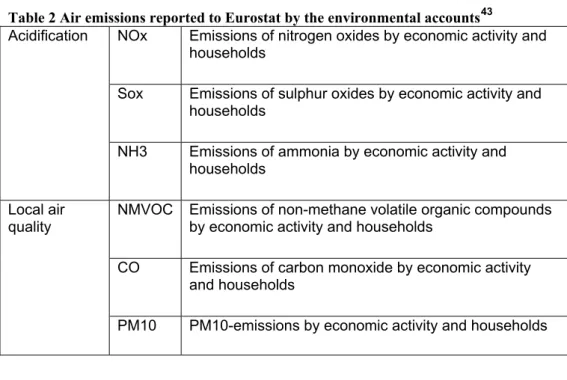
Within the environmental accounts there is the Air Emission Accounts23. The term air emission is used to denote the physical flow of gaseous or particulate materials from the economic system (production or consumption processes) to the atmos-phere. Air emissions comprise emissions of greenhouse gases as well as emission of air pollutants such as e.g. SO2, NOx, PM10 etc.12 emissions to air by industry are reported to Eurostat. Of these emissions that are reported are seven climate related, these are shown in Table 1. The emissions to air are calculated by different actors using different models. The allocation to industries is performed by the envi-ronmental accounts at Statistics Sweden.
23 Eurostat manual for Air Emission Accounts
Table 1 Emissions of greenhouse gases reported to Eurostat by the environmental accounts24
CO2 25 Emissions of carbon dioxide (without emissions from biomass) by economic activity and house-holds
Biomass
CO2 26] Emissions of carbon dioxide from biomass by eco-nomic activity and households
N2O Emissions of nitrous oxide by economic activity and households
CH4 Emissions of methane by economic activity and households
HFC Emissions of hydrofluorocarbons (HFCs, given in CO2-equivalents) by economic activity and house-holds
PFC Emissions of perfluorocarbons (PFCs, given in CO2-equivalents) by economic activity and house-holds
Greenhouse gases
SF6 Emissions of sulphur hexafluorids (SF6, given in CO2-equivalents) by economic activity and house-holds
In the IPCC report (Naturvårdsverket, 2008) it is stated that one fifth of the global climate gas emissions are caused by a change in land use and forestry. Problematic activities such as deforestation in tropic areas to cultivate for food or bio fuels, or live stock are linked to such emissions. A study has been performed on imports of agricultural and forestry products to Sweden and their effect on carbon leakage globally (Möllersten, 2008). The calculations are performed for palm oil, ethanol, soya beans and beef meat from countries with rain forests. The carbon leakage arises as land use is changed in the country where the products are cultivated, mainly through deforestation and drained peat land.
6.1.1 Performed studies
The assessment of pollution embodied in trade is most usually done by input output analysis27. Various approaches can be found in literature to make such estimates.
24
http://epp.eurostat.ec.europa.eu/portal/page/portal/environmental_accounts/methodology/data_collect ions
25 CO2 emissions from biomass are reported separately. 26 CO2 emissions from biomass are reported separately.
27 An alternative is to make LCAs for imported goods, but this is usually time consuming and can often
The simplest approach is to apply a shortcut, assuming that imported goods and services are made with the same technology as those produced domestically (e.g. Huppes et al., 2006; Palm et al., 2006; Hendrickson, 2006). This is called the do-mestic technology assumption. This assumption can lead to serious errors (Peters and Hertwich, 2006a and 2006b; Weber and Matthews, 2007; Ghertner and Fripp, 2007; compare also Ahmad, 2003; Ahmad and Wyckhoff, 2004).
To take into account trade between countries, researchers started to apply the bilat-eral trade approach. They identified the main trading partners of a country, made available environmentally extended input-output tables for these countries or coun-try groups, and calculated the embedded pollution and resource use in bilateral trade (see e.g. Weidema et al. (2005, Denmark); Peters and Hertwich
(2006b; Norway), Nijdam and Wilting (2005; Netherlands), Weber and Matthews (2007, US) and Norman et al (2007, Canadian-US trade)). A common feature of all these studies is that only bilateral trade was considered and trade with other coun-tries was ignored.
The bilateral trade application was for example used in a Swedish study
(Naturvårdsverket, 2008) where an assessment of the impact of greenhouse gases from consumption in Sweden was performed, including carbon dioxide, methane and nitrous oxide. The study used data from environmental accounts in different countries and input-output analysis. This was combined with information on trade partners and emission intensities. The overall view was combined with life cycle based assessments of some products used as examples to give a more detailed per-spective in some cases. The study showed that transportation, housing and food are the most significant activities giving arise to green house gas emissions inside and outside Sweden.
An EEA study (EEA, 2009) was performed where environmental extended input-output analysis was discussed to be used for answering the key questions within SCP (sustainable consumption and production). The method was considered being useful for assessing the two SCP perspectives; production and consumption. In the study four key aggregated environmental pressures were examined: greenhouse gas emissions, acidifying emissions, emissions of tropospheric ozone precursors and domestic material input. The economic sectors that dominate direct emissions are agriculture, electricity industry, transport services and some basic manufacturing industry. When analyzing emissions caused by consumption a few groups were identified that contributed significantly to direct and indirect emissions: construc-tion works, foods products (inclusive beverages and alcohol), electricity (together with gas, steam and hot water). Four limitations were found, that limit the method’s full potential: time lag in data, level of aggregation of economic sectors, production processes in other countries for imported goods, lack of environmental data.
In the Resources and Energy Analysis Programme28 (REAP), which has been de-veloped by Stockholm Environment Institute29 (SEI), an environmentally extended input-output model makes up the backbone of the model. REAP is a two-region model which distinguishes between products that are produced within the nation and imported products from the ‘rest of the world’. The REAP model generates ecological, carbon and greenhouse gas footprints results and baseline data for air emissions, heavy metals and material flows. The REAP is a policy model that tains a scenario module where several variables can be changed, population, con-sumption and technology. REAP is being developed for Sweden and for EU-27 through the One Planet Economy Network30.
A more comprehensive method would be a truly multi-regional approach, in which economies of the rest of the world are presented together with the country of inter-est in a multi-regional input-output table with environmental extensions (MR EE IO). One example is Wiedmann et al. (2008), who used Nijdam and Wilting’s (2005) data for the EU and other OECD and non-OECD countries and developed them as a true multiregional environmentally extended input-output table. Peters (2007) and Friot et al. (2007) used the GTAP31 multi-regional input-output data-base with various individual emissions as a basis for their modeling efforts. Peters (2007) was the first to perform a multi regional study using the complete GTAP database, work which was extended into the calculation of the ’Carbon footprint of nations’ by Hertwich and Peters (2009). In this study the life cycle perspective and trade between countries were taken into account. They also argue for including, not only the private consumption part of final demand, but also public consumption and investments. The study presents the carbon footprint of nations in t CO2 per person. The analysis of the results shows that nutrition, shelter (i.e. operation and maintenance of residence), private mobility, services (public administration, health, and defense) and manufactured products are the product groups with largest impact on the carbon footprint. The study also shows that that food is dominant in poor countries while mobility becomes more important for rich countries.
The Global Resource Accounting Model (GRAM) of Giljum et al. (2008b) uses OECD input-output and trade data extended by material extraction in combination with the GINFORS32 (Global Interindustry Forecasting System)model to calculate indirect material flows of traded products. The use of a complete multiregional environmentally extended input-output model offers the most detailed insights for
28 http://sei-international.org/reap 29 http://sei-international.org/
30 http://www.oneplaneteconomynetwork.org/ 31 https://www.gtap.agecon.purdue.edu/ 32 Information about the GINFORS model on
determining the specific causes of impacts and allocating impacts to producers or consumers (Lenzen et al., 2007; Peters and Hertwich, 2006a; Peters, 2007)
The ’domestic technology assumption’ approach usually leads to significant errors in estimates of pollution embodied in trade, particularly for small countries with open economies and whose economic structure differs highly from the countries from which it imports. The multiregional environmentally extended input-output approach is the most comprehensive one, but requires a significant number of data, that are largely lacking today. If a single country would set such a data system up, it would be forced to put more effort in data gathering for other countries, than for its own country. We see hence in practice that the only practical multiregional environmentally extended input-output efforts have used existing databases such as the GTAP33 multiregional input-output database, and the OECD input-output ta-bles. Still, these sources have important limitations in terms of environmental ex-tensions, sector detail, transparency and quality, and usually need additional work before they are ready for analytical use (e.g. Tukker et al., 2009)34.
Various efforts are under way, however, to improve this situation, mainly driven by the research community. Examples include:
• Countries such as Sweden, Finland, Denmark, Netherlands, the US, Canada and others have developed environmentally extended input-output tables for their own countries, and in some cases also made environmen-tally extended input-output tables for countries from which their main im-ports come, to assess ‘pollution and resources embodied in trade’ (i.e. the ’bilateral trade’ approach mentioned above)
• In Asia, the Japanese Institute for Developing Economies (IDE JETRO) has developed an Asian multiregional input-output analysis that includes also the US, and is now working on a multiregional input-output model that also includes the BRICS35 countries. Since this effort does not include extensions, it is less useful for the purpose of Swedish EPA in this project. • The EU FP736 funds the World Input Output Database (WIOD) project.
This project is mainly interested in economic productivity analyses, but as a part of it, builds time series between 1995 and 2006 of a multiregional environmentally extended input-output with about 40 countries, with a sec-tor detail of 30, and a limited number of extensions.
33 https://www.gtap.agecon.purdue.edu/
34 The OECD tables are for individual countries and need a specific effort to be trade linked. Both
GTAP as OECD in principle contain no or just limited extensions, which hence need to be gathered by practitioners. In practice such databases mainly have been used to make analyses with a limited number of pollutants, such as CO2, CH4 and SOx.
35 Brazil, Russia, India and China
• The EU FP637 funds the development of the first global, detailed harmo-nized environmentally extended input-output tables (the EXIOPOL pro-ject). It covers the 43 major economies in the world plus the Rest of World, with 130 sectors per country and around 150 extensions, but it focuses on a single year (2000)
• Under FP7 a follow up proposal on EXIOPOL has been selected for fund-ing, which will expand the extensions and build time series until a more re-cent date. The project will run until 2014.
• With Australian funding, the University of Sydney is developing a tool that is able create a multiregional input-output table from very different source data with relatively limited effort. To some extent this resembles the WIOD and EXIOPOL projects, but the emphasis is on development on automated harmonization and diagnostic tools. Also this project plans to deliver a global multiregional input-output with environmental extensions. • Eurostat has launched various projects that in 2-4 years should lead to a
multiregional input-output with environmental extensions for the EU27 discerning about 60 sectors and products and some 20-30 emissions and resources, based on the available national and environmental accounting data.
The studies performed take into account emissions of fossil fuels and process emis-sions, sources and sinks of land use are hence not included. Emissions due to land use have been showed to be a large contributor to overall greenhouse gas emis-sions, and future enhancements of these methods are hence possible to get a more complete view.
6.1.2 Time series and data availability
As the use of fossil fuels directly causes emissions of CO2, emissions from fuel based activities (i.e. production of goods) can be calculated as data is available from environmental and economic statistics. Time series are possible to obtain as data is available back to 1993, the current System of national Accounts (SNA) was implemented in 1993, and data is updated on a yearly basis.
Statistics Sweden publishes data (http://www.mirdata.scb.se) on a regular basis on emissions of CO2 equivalents connected to consumption. The underlying method is input-output analysis combined with emission data per industry. Emission caused in other countries by imported goods, are calculated with two methods: either as if the production occurs in Sweden (the domestic technology assumption) or with country intensities (bilateral trade).
6.1.3 Suggested way to go forward
Swedish EPA could opt for the ’bilateral trade’ approach, and link its own envi-ronmental extended input-output table to those of its most important trade partners. It is likely that for most of the direct trade partners (Norway, Denmark, some other EU countries, the US) environmentally extended input-output tables are available. If a more comprehensive approach based on multiregional environmentally ex-tended input-output is preferred, the following options exist:
• Existing databases such as the expanded GTAP databases developed for e.g. the ’Carbon footprint of nations’ analysis by Hertwich and Peters (2009) could be used to make estimates of greenhouse gases embodied in imports right away.
• In around a year from now (2011), both the EXIOPOL as WIOD projects will deliver their multiregional environmentally extended input-output data. As things stand now these data will be public (or available for a minor fee). For environmental analyses, the EXIOPOL data will probably be the best to use in the type of analyses desired by Swedish EPA given sector detail and number of extensions.
• In a somewhat longer time frame, the EUROSTAT projects are likely to de-liver a full multiregional environmentally extended input-output table for the EU27. The advantage here is that – as far as trade with the EU27 concerns – Sweden can use these data for assessing pollution embodied in trade, using data with an official status38.
Another enhancement of the analyses would be to split industrial sectors and prod-uct categories into a finer level in relevant sectors, for example NACE 01, agricul-ture. If a finer breakdown becomes available it would for example be possible to analyze how emissions would change in a shift to a less meat intensive diet. Something that can be further analyzed is how the result is affected by the fact that production of the same product is connected to different costs and different emis-sions, depending on producer country. A possible way of forthcoming is to analyze the 50 to 150 goods that are included in the input-output analysis and trade statis-tics that are weighted with for example WRI (World Resources Institute), comple-mented with more detailed statistics from the Air Emission Accounts.
A quantification of the size of the error that is a result from allocation problems in the trade statistics is wished for. As an example, the EU imports large amounts from China, of which some is processed and traded within EU. This trade is regis-tered as if the origin is EU, and hence environmental impact connected to this trade
38 Note that Swedish ESA95 SUT and related national accounting matrices with environmental