http://www.diva-portal.org
Postprint
This is the accepted version of a paper presented at The 13th Scandinavian Conference on Artificial
Intelligence (SCAI 2015), 5-6 November, 2015, Halmstad, Sweden.
Citation for the original published paper:
Barua, S., Begum, S., Ahmed, M. (2015)
Clustering based Approach for Automated EEG Artifacts Handling.
In: Halmstad
N.B. When citing this work, cite the original published paper.
Permanent link to this version:
Clustering based Approach for Automated
EEG Artifacts Handling
Shaibal BARUAa,1, Shahina BEGUMa and Mobyen Uddin AHMEDa aSchool of Innovation, Design and Engineering
Mälardalen University, SE-72123 Västerås, Sweden
Abstract. Electroencephalogram (EEG), measures the neural activity of the central
nervous system, which is widely used in diagnosing brain activity and therefore plays a vital role in clinical and Brain-Computer Interface application. However, analysis of EEG signal is often complex since the signal recoding often contaminates with noises or artifacts such as ocular and muscle artifacts, which could mislead the diagnosis result. Therefore, to identify the artifacts from the EEG signal and handle it in a proper way is becoming an important and interesting research area. This paper presents an automated EEG artifacts handling approach, where it combines Independent Component Analysis (ICA) with a 2nd order
clustering approach. Here, the 2nd order clustering approach combines the
Hierarchical and Gaussian Picture Model clustering algorithm. The effectiveness of the proposed approach has been examined and observed on the real EEG recording. According to the result, artifacts in the EEG signals are identified and removed successfully where the artifacts handled EEG signals show acceptable considering visual inspection.
Keywords. Electroencephalogram (EEG), Machine-Learning, Ocular artifacts,
Muscle artifacts
1. Introduction
The Electroencephalogram (EEG) signal analysis has become an important research area and plays a vital role in medical, health, and in Brain Computer Interfaces (BCI) applications. However, EEG signal is non-stationary and non-linear as characterized by Klonowski (2009) in [1], where ‘3N’ : nonstationary, nonlinear, and noisy. Moreover, physiological signals other than brain activity, which contaminate the EEG signals, are referred to as artifacts [2, 3]. EEG artifacts have also been defined as any undesired signals or potential differences due to an extra-cerebral source that interfere with recorded signal [4, 5]. Artifacts make EEG signal uninterruptable and in the EEG signal analysis it can also lead to serious misinterpretation. Therefore, artifacts and noise handling is one of the cornerstones, to identify, whether the signals originated from the brain or from other physiological sources like heart, eye, muscles, or by electrical components from the equipment’s.
The traditional Ocular Artifacts (OAs) correction methods are linear filters and regression-based methods [6]. In linear filter approach certain frequency bands that belong to OAs range are removed from the EEG signal. One of the problems of this
technique is that it can also cause significant loss of neural activity in EEG data because of spectral overlaps between neurological and OA signals [7]. On the other hand, regression-based method computes propagation factors or transmission coefficients to determine correlation between one or more electrooculogram (EOG) channels and each EEG channel. [6]. The problem with regression analysis is that it not only reduces ocular artifacts but it may also remove interesting cerebral activity. It also requires EOG reference channel for artifact removal and requires a calibration trail to determine the transfer coefficients between EOG and EEG channels[6].
This paper presents a hybrid approach that combines Independent Component Analysis (ICA) and a 2nd order clustering approach to handle ocular and muscle artifacts in the EEG signals. Here, recorded EEG signals are decomposed applying ICA to separate mixing signals from the EEG signals and thereafter features are extracted from each independent component. In this paper, 19 channels EEG signals are time-synchronized with respect to ocular and muscle activity tasks. Each EEG recording is segmented considering the trials that have conducted for each subject during the data collection. Here, ICA is applied on each segment of EEG recording then these independent components (ICs) are categorized in ocular and muscle artifactual components using a 2nd order clustering approach i.e., the Hierarchical-clustering in 1st order and the Gaussian Mixture Model in 2nd order. Finally, in the signal reconstruction phase identified ocular and muscle artifactual components are removed and artifacts handled EEG signals are obtained. From the comparison between recorded EEG and artifacts handled EEG signals, results show that the quality of the artifacts handled EEG signals improved around 50% after removal of the artifacts from the ocular activity segments and signals quality improved around 15% in the muscle movement
activity segments.
The rest of the paper is organized as follows: Section 2 presents background and related work on EEG artifacts identification and removal. Section 3, describes the proposed approach and methods. Section 4, discusses the experimental work and results. Finally, Section 5 concludes with summary and discussion.
2. Background and Related work
The EEG signal is recorded from the scalp surface by electrodes and characterized by amplitude and frequency. The amplitude of the EEG signal is between 10-100 µV [8]. The sources of EEG artifacts are the ocular and the muscle activities. Both kind of artifacts overlap with neural brain activity and recorded signals and increases the difficulty to correctly interpret the EEG signals. The hypothesis on these artifacts is that, they are independent from the brain activity, either collected from normal or pathologic subjects [9]. The human eyes act as a dipole where cornea is positive and retina is negative. The change of electrical dipole due to eye movements and blinks produces EOG signal [8]. EOG waveform depends on factors, for example, the direction of the eye movements. Eye blink artifacts have low frequency (<4 Hz) and large amplitude. Eye movement artifacts are represented by low frequency (<4 Hz) but with higher propagation [10]. In addition, a fraction of EOG can contaminate the EEG signal and ocular artifacts can produce strong in the EEG signals [10]. Muscle activities are another source of contamination in the EEG recording. Body movement, chewing, swallowing, muscle twitches, or general muscle tension are caused most of these muscle activities in the face, neck, on the scalp, which leads to muscle artifacts in EEG
signal. EEG recording of frontal and temporal region mainly affects by muscle artifacts, however, any head electrode can also be obscured due to artifacts [11]. In the time domain normal EEG signal contaminates by muscle artifacts due to an excessive amount high frequency signal components that deluges the power spectra at Beta and Gamma frequency band of EEG signal [12].
Daly and his colleagues [13] have developed the FORCe: Fully Online and automated artifact Removal tool for BCI application combining wavelet transform, ICA and thresholding. Thresholding is applied on the independent components (ICs) to identify artifactual components, and it reconstructs clean EEG signal by removing the ICs that contains artifacts. Authors reported that FORCe outperformed two other methods i.e., LAMIC and FASTER. FASTER [14] is a thresholding based method to remove artifacts from EEG signal. LAMIC [15] is a clustering algorithm based method that has been developed to remove artifacts automatically from the EEG signals. A Blind source separation algorithm called the Temporal Decorrelation Source Separation (TDSEP) has been applied to decompose EEG signals. Later, clustering has been done on the components based on the similarity of their lagged Auto-Mutual Information (AMI). Furthermore, machine-learning algorithms have been combined with ICA to automate the artifacts handling techniques [16-18]. Recently, ICA that belongs to blind source separation algorithms has been proved as an effective method to identify and correct artifacts from the EEG signals. However, most of the techniques based on ICA require visual inspection to identify OAs. In the articles [15, 19-21], ICA and clustering algorithms have been used to classify artifacts in the EEG signals. In the article [21] a hybrid algorithm using iterative ICA and fuzzy clustering has been proposed for artifacts rejection. In [19] ICA and k-nearest neighbor were used to classify different eye movement activities in the EEG signals.
3. Material and Methods
3.1. Data Collection
EEG signals are recorded at 2048 Hz sample rate following the international 10-20 electrode placement system, where 19 channels locations are used. A controlled data collection scenario was used during the data collection and subjects were asked to perform different ocular and muscle movement activities, i.e. smooth pursuit eye
movement, eye blink and saccades, jaw clenching, yawning, stretching and trunk movement. For the ocular activities a cross symbol was moving, flashing and jumping
around the computer screen, and the participants were asked to follow the cross symbol. In order to generate muscle artifacts, the participants were instructed to clench their jaw, yawning, perform stretching etc.
3.2. Approach
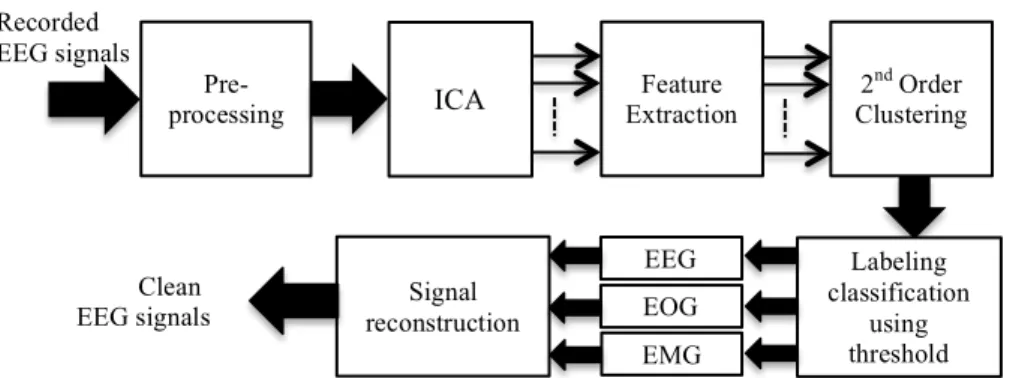
A step-by-step process of the proposed system for artifacts handling in EEG signals is presented in Figure. 1. In the pre-processing, 50 Hz channel noise are removed from the recorded EEG signals using notch filter and then signals are divided into segments for the each ocular and muscle movement activities.
Figure 1. Steps of the proposed approach in order to correct artifacts in EEG signals.
After pre-processing, recorded EEG signals are decomposed by applying ICA. ICA is a statistical method, which can decompose observed signals in to statistically independent components. ICA assumes a data model 𝑋 = 𝐴𝑆, where X is a queued column vectors of data recorded from individual EEG channels, A is a weight matrix for mixing independent components back to original signals, S is queued column vector of statistically independent components. The M observed EEG signals 𝑥 𝑡 =
𝑥! 𝑡 , 𝑥! 𝑡 , … , 𝑥! 𝑡 ! are generated as a sum of the N independent components 𝑡 = 𝑠! 𝑡 , 𝑠! 𝑡 … , 𝑠! 𝑡 !: 𝑋 = 𝐴𝑆 The mixing matrix A is consisted of mixing coefficients 𝑎!,! 𝑖 = 1,2, … , 𝑁 𝑗 = 1,2, … , 𝑀 . In the ICA model, number of sources
N and the mixing matrix A are usually unknown. It is commonly supposed that M=N
and the task of ICA method is to recover unknown source signals 𝑠 𝑡 by introducing unmixing matrix W: 𝑌 = 𝑊𝑋, where W is inverse matrix of the mixing matrix A, W obtained by considering the independence of the signal and Y represents the independent components that are approximations of sources S. Since there is no knowledge of matrix A, it is not possible to determine W exactly.
3.2.1. Feature Extraction
In order to identify ocular and muscle artifactual components, several features are extracted from each independent component (IC). Two sets of feature vectors are created; a) for ocular artifacts identification that consists of 6 features (Hurst Exponent,
Hjorth’s descriptors, Skewness, 𝜆, and average log band power of frequency band 8
and 13 Hz), and b) for muscle artifacts that consists of 3 features (Spectral ratio, Energy ratio, Spectral edge frequency).
Hurst Exponent usually used to evaluate the self-similarity and correlation
properties of fractional Brownian noise. It is the measure of the smoothness of a fractal time series based on the asymptotic behavior of the rescaled range of the process. For a time series of length n, 𝑋 𝑁 , 𝑁 = 1, … , 𝑛, Hurst exponent can be calculated by
𝐻 =!"# ! !
!"# ! (1)
Where T is the duration of the sample of data, R is the range of first n values and S is the standard deviation, and R/S is the corresponding value of rescaled range. Long-range dependencies and its degree in time series can be evaluated using Hurst exponent.
Hjorth’s descriptors are defined by three descriptors as activity, mobility and
complexity [22]. The activity, mobility and complexity are calculated as follows:
Clean
EEG signals reconstruction Signal
ICA Extraction Feature Clustering 2nd Order
Recorded EEG signals Pre-processing Labeling classification using threshold EMG EOG EEG
Activity(𝑋!)=𝑣𝑎𝑟 𝑋! = 𝜎! (2) Mobility(𝑋!)=!!!!! != 𝜎!/𝜎! ! ! (3) Complexity 𝑋! = 𝜎4 𝜎2 𝜎2 𝜎01 2 = 𝜎! 𝜎! ! ! (4) Here, 𝑋! is the time series data, var(𝑋!) is the variance of the normalized signal,
also represented by 𝜎!, and 𝜎𝑋!is the standard deviation of the first derivative of 𝑋! that is 𝜎! and 𝜎!is the variance of second derivative of 𝑋!. In Hjorth’s descriptors, Activity represents the signal power; Mobility represents the mean frequency, and Complexity represents the change in the frequency.
Skewness is a measure that estimates the degree of deviation from the symmetry of
a normal or Gaussian distribution. It has been used to identify artifacts [23, 24] that provide some measure of distribution of amplitude values of EEG signal. Eye blinking increases the symmetry of the EEG signal segments and has positive or negative skewness. Moreover, EOG components have high skewness than normal EEGs [24]. Skewness corresponds to a third-order statistic of the data and for each IC it is calculated by:
𝑆𝑘𝑒𝑤𝑛𝑒𝑠𝑠 =𝐸 𝑋𝑛 3𝑖
𝜎𝑋3 , 𝑛 = 1,2, … , 𝑁 (5)
Where 𝑋! is one of the N ICs, E is the statistical expectation function of 𝑋! and 𝜎! is the standard deviation. Eye blinking increases the symmetry of the EEG signal segments and has positive or negative skewness.
Two features are adopted from [18], one is 𝜆 that describes the deviation of a component’s spectrum from a prototypical 1/frequency curve and its shape; and the second feature is the average log band power of the frequency band between 8 and 13 Hz.
Spectral ratio [12] has been proposed as a feature of muscle artifacts that estimates
power spectral ratio of two frequency ranges. Spectral ratio can be expressed as:
𝑆𝑝𝑒𝑐𝑡𝑟𝑎𝑙 𝑅𝑎𝑡𝑖𝑜 = 𝐻 𝑋! 𝑓 𝐿 𝑋! 𝑓 (6)
Where 𝑋! 𝑓 is the power spectra of signal, f is the frequency range, 𝑋! 𝑁 and 𝐻 𝑋! 𝑓 and 𝐿 𝑋! 𝑓 arecalculated by Equation 7 and Equation 8 respectively.
𝐻 𝑋! 𝑓 = !
!∈ !",!" !∈ !",!" 𝑋! 𝑓 (7)
𝐿 𝑋! 𝑓 = min!∈ !,!" 𝑋! 𝑓 (8)
Energy ratio is proposed in [25] that calculates the weighting parameter for all
independent components and the reasoning ration is chosen instead of energy is that energy can vary from component to component. It is obtained from each component using the following equitation:
𝐸𝑛𝑒𝑟𝑔𝑦 𝑅𝑎𝑡𝑖𝑜 = 𝐸 55 𝐻𝑧 ≤ 𝑓 ≤ 100 𝐻𝑧 𝐸 𝑓 < 20 𝐻𝑧 (9)
Spectral edge frequency (SEF) is another frequency parameter, which is sensitive
to high frequencies. SEF is defined by minimal frequency below which 95% percent of the total powers of a given signal are located. Muscle activity results more power in the high frequency range which shifts the SEF towards the end of the spectrum [11].
3.2.2. Identification of artifacts applying 2nd order clustering approach
For the identification of artifactual components a 2nd order-clustering approach is
considered where the Hierarchical Clustering algorithm is applied in 1st order and
Gaussian mixture model is applied in 2nd order, in Figure. 1. The
Hierarchical-clustering algorithm clusters data over a variety of scales by creating a hierarchical structure (tree) or ‘dendrogram’. The tree is not a single set of clusters, but rather a multilevel hierarchy, where clusters at one level are joined as clusters at the next level [26]. Here, from each component 6 features are extracted that are used for ocular artifacts identification and Hierarchical clustering applied to categorize ICs into two clusters. In Hierarchical, the distance between pairs of objects is calculated using the Euclidean distance, as a ‘correlation’ parameter of the MATLAB function ‘pdist’. The linkage function applies ‘complete’ (i.e. Furthest distance) as parameter, which determines the objects in the data set that should be grouped into clusters. Finally, a cluster function is applied to group the sample data set into clusters by specifying the cluster’s number. Then kurtosis of each cluster is estimated. The expection-maximization (EM) algorithm has been applied on kurtosis values to compute the threshold. The cluster consists of OA components is determined that has kurtosis value above the threshold.
On the other hand 3 features that are obtained from each component are considered for muscle artifacts identification in the second stage and Gaussian mixture model algorithm has been applied on the cluster consists of non-ocular artifacts components. Gaussian Clustering is associated with fitting a set of Gaussian to data. It identifies a set of Gaussian distribution that presents the highest probability for the data. Here initially the k numbers of components are generated randomly by combing the Multivariate normal density components [27]. Since muscle artifacts and EEG signals has different distribution in frequency components and all three features are obtained from frequency spectrum, hence Gaussian Clustering algorithm is applied. Same as 1st
stage, components are divided into two clusters. To identify cluster consists of muscle artifacts and EEG components, first frequency power upto 100 Hz of each cluster is estimated and then cluster that has greater power is considered as candidate cluster consists of muscle artifacts. Then EM algorithm is applied on energy ratio of each component to compute threshold value. From the candidate cluster muscle artifactual components are identified that are greater than threshold value.
Thus three groups are created that contain ocular artifactual components, muscle artifactual components and EEG components. In the signal reconstruction, ICA components are projected back by removing the ocular and the muscle artifactual components.
4. Results and Evaluation
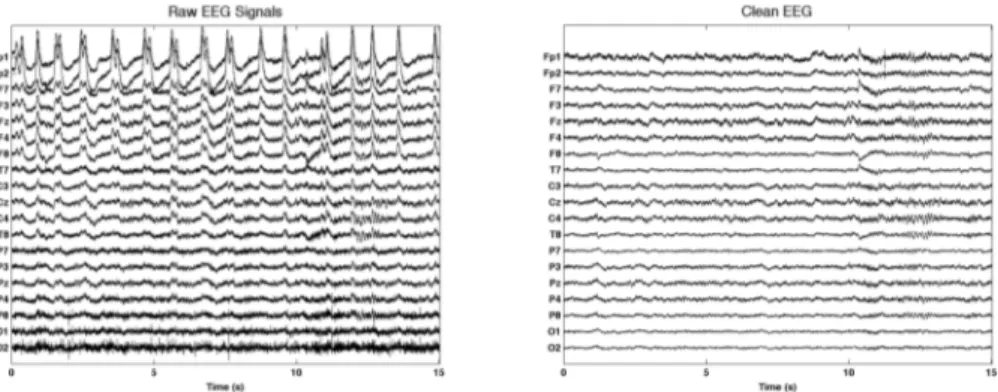
This section presents the results and the evaluation of the proposed EEG artifact handling approach. Artifacts handling has been applied on the recorded EEG signals using the proposed approach. EEG recording with artifacts during eye blink and stretching activities are shown in Figure 2 (a) and 3 (a) respectively.
The resulted signals after artifacts handling are depicted in Figure 2(b) and Figure 3(b). Eye blink artifacts are mostly visible in the pre-fontal and fontal channels. Moreover, muscle artifacts are visible in T8, P7, P8, O1 and O2 channels in both Figure 2(a) and Figure 3(a). It can be observed from Figure 2(b) and Figure 3(b) that the proposed artifacts handling technique can effectively remove artifacts from the recorded signals.
From the visual inspection it is clearly showed that artifacts are removed from the original signals as presented earlier, while looking and comparing two signals. However, the ratio between recorded signals and artifacts handled signals is also important issue to observed. Thus, an experiment has performed to observe the difference considering signal frequency in different artifacts activities. Here, Signal
Quality Index [13, 23] in terms of standard deviation of the amplitude values
(StdAmp), maximum amplitude values (MaxAmp) and mean of the amplitude values (MeanAmp) are calculated for eye movement, eye blink, saccades, trunk movement and
stretching. The calculated value on 5 individual trails both for the recorded EEG with
and artifacts handled EEG signals are presented in Table 1 and Table 2. As can be seen from the table that most of the time, the value is higher when it is with artifacts, which is reduced by the proposed approach. Table 3 presented the difference between recorded EEG and artifacts handled EEG signals where average value on 5 trails is calculated. The table also presented a percentage value from the difference that shows how much artifacts is removed. It can be observed that the quality of the EEG signals
Figure 3. a) EEG signal with artifacts during stretching task b) EEG signal after artifacts handling
.
improved around 50% after removal of artifacts from the eye movement, eye blink,
saccades activity segments. Similarly, EEG signals quality improved around 15% in trunk movement and stretching segments.
Table 1. Signal Quality Index of the recorded EEG signals.
Activity Parameter Trail 1 Trail 2 Recorded EEG signal Trail 3 Trail 4 Trail 5
Eye movement StdAmp 16.29 21.73 16.61 18.39 13.0 MaxAmp 83.2 118.1 60.91 83.51 36.75 Kurtosis 3.23 3.27 0.97 1.99 1.16 Eye Blink StdAmp 20.9 17.59 17.15 16.08 19.41 MaxAmp 118.5 80.64 80.93 80.48 121.3 Kurtosis 3.41 1.53 1.23 1.51 3.57 Saccades StdAmp 21.03 17.42 16.46 18.0 18.4 MaxAmp 88.91 107.5 100.9 78.39 90.74 Kurtosis 1.36 3.06 3.04 1.26 1.09 Trunk movement StdAmp 23.54 20.01 112.1 7.35 26.88 MaxAmp 156.8 110.4 872.3 35.24 164.2 Kurtosis 4.41 3.5 4.98 1.86 4.21 Stretching StdAmp 21.56 109.2 37.17 19.2 23.07 MaxAmp 81.81 852.8 442.1 113.8 128.2 Kurtosis 0.39 5.29 23.41 1.53 2.46
Table 2. Signal Quality Index of the artifacts handled EEG signals.
Activity Parameter Trail 1 EEG signal after handled artifacts Trail 2 Trail 3 Trail 4 Trail 5
Eye movement StdAmp 6.5 13.72 8.71 9.1 7.26 MaxAmp 21.37 66.93 29.23 25.51 21.85 Kurtosis -0.17 3.0 0.007 0.53 0.02 Eye Blink StdAmp 8.23 8.86 7.8 8.84 8.53 MaxAmp 32.34 39.3 32.17 40.5 83.1 Kurtosis 0.33 1.7 0.29 0.8 2.75 Saccades StdAmp MaxAmp 8.63 36.77 9.42 46.53 10.08 70.91 9.29 35.27 8.88 38.65
Kurtosis 0.79 0.74 3.13 0.52 0.8 Trunk movement StdAmp MaxAmp 16.15 136.7 17.88 78.88 103.1 793.3 7.35 35.24 16.76 125.56
Kurtosis 5.96 0.86 5.05 1.91 4.92 Stretching
StdAmp 7.75 103.6 35.33 11.62 11.62 MaxAmp 34.13 805.9 386.7 95.98 74.48 Kurtosis 0.91 5.49 20.31 2.35 3.22
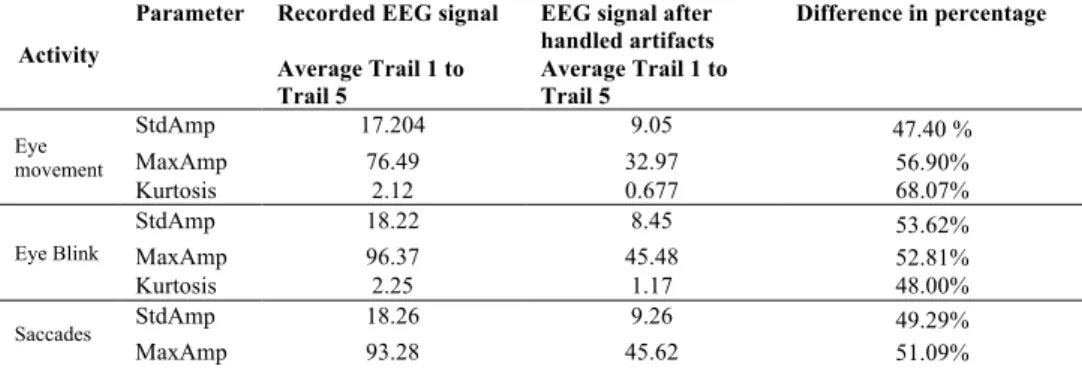
Table 3. Difference in recorded EEG and artifacts handled EEG signals where average value on 5 trails is
calculated
Activity
Parameter Recorded EEG signal EEG signal after handled artifacts
Difference in percentage Average Trail 1 to
Trail 5 Average Trail 1 to Trail 5
Eye movement StdAmp 17.204 9.05 47.40 % MaxAmp 76.49 32.97 56.90% Kurtosis 2.12 0.677 68.07% Eye Blink StdAmp 18.22 8.45 53.62% MaxAmp 96.37 45.48 52.81% Kurtosis 2.25 1.17 48.00% Saccades StdAmp 18.26 9.26 49.29% MaxAmp 93.28 45.62 51.09%
Kurtosis 1.96 1.19 39.29% Trunk movement StdAmp 37.97 32.24 15.09% MaxAmp 267.78 233.93 12.64% Kurtosis 3.792 3.74 1.37% Stretching StdAmp 42.04 33.98 19.17% MaxAmp 323.742 279.43 13.69% Kurtosis 6.616 6.456 2.42% 5. Conclusion
In this paper an approach has been proposed for handling ocular and muscle artifacts in the EEG signals. It is important to handle artifacts in the EEG signals before performing EEG signal analysis for diagnosing pathological disease or in the BCI applications. Various researchers have been intended to develop methods for artifacts handling in the EEG signals. However, most of the techniques used EOG and EMG signals as a reference to identify artifacts in EEG signals. The proposed approach is a combination of ICA and 2nd order clustering algorithm using Hierarchical and Gaussian
Mixture model clustering. The approach does not require any reference signals to identify artifactual components from the EEG signals. Since the proposed approach is based on clustering algorithms, unlike other methods, it does not require any prior classification or templates to identify artifactual components. In addition, expectation-maximization algorithm has been used as a thresholding technique in this paper where methods required different thresholding techniques for each type of feature. From the results it is noticeable for ocular artifacts handling it can improve signal quality up to 50% and for body movement i.e., trunk movement and stretching signal quality improve up to 15%. Here, one problem with muscle artifacts handling is that there are various muscle activities are involved in stretching and trunk movement. Therefore, in future the system can be updated for instance, threshold-learning method can be improved for Gaussian mixture model clustering so that it can identify muscle artifacts more accurately.
Acknowledgement
This research work is supported by the Vehicle Driving Monitoring (VDM) project funded by Swedish Governmental Agency for Innovation Systems (VINNOVA).
References
[1] W. Klonowski, “Everything you wanted to ask about EEG but were afraid to get the right answer,”
Nonlinear Biomedical Physics, vol. 3, no. 1, pp. 1-5, 2009/05/26, 2009.
[2] D. Migotina, A. Calapez, and A. Rosa, “Automatic Artifacts Detection and Classification in Sleep EEG Signals Using Descriptive Statistics and Histogram Analysis: Comparison of Two Detectors,” in Spring Congress on Engineering and Technology (S-CET), 2012, pp. 1-6.
[3] D. Talsma, “Auto-adaptive averaging: Detecting artifacts in event-related potential data using a fully automated procedure,” Psychophysiology, vol. 45, no. 2, pp. 216-228, 2008.
[4] N. A. Chadwick, D. A. McMeekin, and T. Tan, “Classifying eye and head movement artifacts in EEG signals,” in Digital Ecosystems and Technologies Conference (DEST), 2011 Proceedings of the 5th IEEE International Conference on, 2011, pp. 285-291.
[5] D. W. Klass, “The continuing challenge of artifacts in the EEG,” American Journal of EEG
Technology, vol. 35, no. 4, pp. 239-269, 1995.
[6] H. Ghandeharion, and A. Erfanian, “A fully automatic ocular artifact suppression from EEG data using higher order statistics: Improved performance by wavelet analysis,” Medical Engineering &
Physics, vol. 32, no. 7, pp. 720-729, 9//, 2010.
[7] R. Mahajan, and B. I. Morshed, “Sample Entropy enhanced wavelet-ICA denoising technique for eye blink artifact removal from scalp EEG dataset,” in Neural Engineering (NER), 2013 6th International IEEE/EMBS Conference on, 2013, pp. 1394-1397.
[8] G. Gratton, “Dealing with artifacts: The EOG contamination of the event-related brain potential,”
Behavior Research Methods, Instruments, & Computers, vol. 30, no. 1, pp. 44-53, 1998/03/01,
1998.
[9] R. Romo-Vazquez, R. Ranta, V. Louis-Dorr et al., “EEG Ocular Artefacts and Noise Removal,” in Engineering in Medicine and Biology Society, 2007. EMBS 2007. 29th Annual International Conference of the IEEE, 2007, pp. 5445-5448.
[10] S. Pourzare, O. Aydemir, and T. Kayikcioglu, “Classification of various facial movement artifacts in EEG signals,” in Telecommunications and Signal Processing (TSP), 2012 35th International Conference on, 2012, pp. 529-533.
[11] M. van de Velde, G. van Erp, and P. J. M. Cluitmans, “Detection of muscle artefact in the normal human awake EEG,” Electroencephalography and Clinical Neurophysiology, vol. 107, no. 2, pp. 149-158, 4//, 1998.
[12] J. Ma, P. Tao, S. Bayram et al., “Muscle artifacts in multichannel EEG: Characteristics and reduction,” Clinical Neurophysiology, vol. 123, no. 8, pp. 1676-1686, 8//, 2012.
[13] I. Daly, R. Scherer, M. Billinger et al., “FORCe: Fully Online and automated artifact Removal for brain-Computer interfacing,” Neural Systems and Rehabilitation Engineering, IEEE Transactions
on, vol. PP, no. 99, pp. 1-1, 2014.
[14] H. Nolan, R. Whelan, and R. B. Reilly, “FASTER: Fully Automated Statistical Thresholding for EEG artifact Rejection,” Journal of Neuroscience Methods, vol. 192, no. 1, pp. 152-162, 9/30/, 2010.
[15] N. Nicolaou, and S. J. Nasuto, “Automatic Artefact Removal from Event-related Potentials via Clustering,” The Journal of VLSI Signal Processing Systems for Signal, Image, and Video
Technology, vol. 48, no. 1-2, pp. 173-183, 2007/08/01, 2007.
[16] A. Jafarifarmand, and M. A. Badamchizadeh, “Artifacts removal in EEG signal using a new neural network enhanced adaptive filter,” Neurocomputing, vol. 103, no. 0, pp. 222-231, 3/1/, 2013.
[17] H.-A. T. Nguyen, J. Musson, F. Li et al., “EOG artifact removal using a wavelet neural network,”
Neurocomputing, vol. 97, no. 0, pp. 374-389, 11/15/, 2012.
[18] I. Winkler, S. Haufe, and M. Tangermann, “Automatic Classification of Artifactual ICA-Components for Artifact Removal in EEG Signals,” Behavioral and Brain Functions, vol. 7, no. 1, pp. 1-15, 2011/08/02, 2011.
[19] O. Aydemir, S. Pourzare, and T. Kayikcioglu, “Classifying Various EMG and EOG Artifacts in EEG Signals,” PRZEGLĄD ELEKTROTECHNICZNY (Electrical Review), vol. 88, no. 11a, pp. 218-222, 2012.
[20] Z. Yuan, J. Hart, and R. Jafari, “Automatic EEG artifact removal based on ICA and Hierarchical Clustering,” in Acoustics, Speech and Signal Processing (ICASSP), 2012 IEEE International Conference on, 2012, pp. 649-652.
[21] U. Patidar, and G. Zouridakis, “A hybrid algorithm for artifact rejection in EEG recordings based on iterative ICA and fuzzy clustering,” in Engineering in Medicine and Biology Society, 2008. EMBS 2008. 30th Annual International Conference of the IEEE, 2008, pp. 50-53.
[22] R. Palaniappan, Biological Signal Analysis: Ramaswamy Palaniappan & Ventus Publishing, 2010. [23] I. Daly, F. Pichiorri, J. Faller et al., “What does clean EEG look like?,” in Engineering in Medicine and Biology Society (EMBC), 2012 Annual International Conference of the IEEE, 2012, pp. 3963-3966.
[24] L. Shoker, S. Sanei, and J. Chambers, “Artifact removal from electroencephalograms using a hybrid BSS-SVM algorithm,” Signal Processing Letters, IEEE, vol. 12, no. 10, pp. 721-724, 2005. [25] A.-D. Nguyen Thi, D.-N. Tran, T.-H. Nguyen et al., "An effective procedure for reducing EOG
and EMG artefacts from EEG signals." pp. 328-332.
[26] G. Chen, S. A. Jaradat, N. Banerjee et al., “Evaluation and comparison of clustering algorithms in anglyzing ES cell gene expression data,” Statistica Sinica, vol. 12, pp. 241-262, //, 2002. [27] N. Ueda, R. Nakano, Z. Ghahramani et al., “Split and merge EM algorithm for improving
Gaussian mixture density estimates,” in Neural Networks for Signal Processing VIII, 1998. Proceedings of the 1998 IEEE Signal Processing Society Workshop, 1998, pp. 274-283.