School of Innovation, Design and Engineering
BACHELOR THESIS IN
AERONAUTICAL ENGINEERING
15 CREDITS, BASIC LEVEL 300
Evaluation of fuel saving for
an airline
Author: Tobias Berglund Report code: MDH.IDT.FLYG.0188.2008.GN300.15HP.FP
Abstract
A study of which methods and measures that can be used to reduce fuel consumption and harmful discharges in an airline.
The study begins with an investigation containing calculations of the differences between estimated fuel consumption calculated by a computer program called Skytrack and actual fuel consumption. Results from this study allows synchronization between actual consumption with calculated consumption. In addition to this methods and configurations to reduce weight and thus weight onboard aircrafts e.g. carpet exchange, lightweight trolleys and water reduction has been created and analysed.
To bring the thesis to an end, the author has investigated other methods and configurations which TUIfly Nordic is implementing for fuel conservation.
The thesis results in several conceivable areas for fuel conservation with calculated savings of 830 000 EUR which for the moment is implemented in TUIFly Nordic.
Sammanfattning
En undersökning om vilka metoder och beräkningar som kan användas för att minska bränsleförbrukning och giftiga utsläpp i ett flygbolag.
Undersökningen inleds med en undersökning innehållande kalkyleringar utav skillnader mellan beräknad bränsleåtgång kalkylerad av ett program kallat Skytrack och faktisk bränsleåtgång. Resultat från denna undersökning tillåter synkronisering mellan faktisk åtgång med beräknad åtgång. Utöver detta beskrivs metoder och konfigurationer för att minska vikt sålunda vikt ombord på flygplan t.ex. mattbyten, lättviktsvagnar och vatten reducering har blivit skapade och
analyserade.
Som avslutning studeras andra metoder och konfigurationer som är på väg att genomföras inom TUIfly Nordic för bränslebesparing.
Arbetet resulterar i flertal tänkbara områden för bränslebesparing med kalkylerade besparingar värda 830 000 EUR som för tillfället implementeras i TUIFly Nordic.
Nomenclature
List of symbols
ACARS Aircraft Communication Addressing and Reporting System ACMS Aircraft Condition Monitoring System
ACU Air Conditioning Unit
AMM Aircraft Maintenance Manual APU Auxiliary Power Unit
CI Cost Index
FMC Flight Management Computer GOC Ground Operations Center OFP Original Flight Plan SB Service Bulletin SET Single Engine Taxi
TO Technical Order
TOW Take Off Weight
CO Carbon Monoxide
CO2 Carbon Dioxide
H2O Dihydrogen Oxide (Water)
NOx Nitrogen Oxide
Contents
1 Introduction ...1
1.1 Objectives of the Thesis ...1
1.2 Execution of the Thesis ...1
2 Description of the Methods ...2
2.1 Fuel Consumption Survey ...2
2.1.1 Synchronizing OFP Fuel Consumption with Actual Consumption...3
2.1.2 Single Engine Taxi ...4
2.1.3 Contingency Fuel...4
2.2 Research of the Needs of an Air Conditioning Unit...5
2.3 Reducing Weight ...5
2.3.1 Potable Water Tanks...6
2.3.2 Lightweight Galley Carts...6
2.3.3 Lightweight Carpets ...6
2.3.4 Removing Chillers from Galley ...7
2.4 Route Specific Taxi Fuel ...7
2.5 Route Specific Cost Index ...7
2.6 Winglets...9
2.7 Zonal Drying™ System ...10
3 Results ...11
3.1 Fuel Consumption Survey ...11
3.1.1 Synchronizing OFP Fuel Consumption with Actual Consumption...11
3.1.2 Single Engine Taxi ...11
3.1.3 Contingency Fuel...11
3.2 Research of the Needs of an Air Conditioning Unit...12
3.3 Reducing Weight ...12
3.3.1 Potable Water Tanks...12
3.3.2 Lightweight Galley Carts...13
3.3.3 Lightweight Carpets ...13
3.3.4 Removing Chillers from Galley ...14
3.4 Route Specific Taxi Fuel ...14
3.5 Route Specific Cost Index ...14
3.6 Winglets...14
3.7 Zonal Drying™ System ...15
4 Conclusions and Proposals for Further Studies ...15
5 Acknowledgements ...17
6 References ...18
Appendix ...1
1 Fuel Consumption Survey Sheet ...2
2 Fuel Consumption Survey Calculations and Results...3
3 Business Case for Single Engine Taxi...3
3 Business Case for Single Engine Taxi...4
4 Business Case for Air Conditioning Unit ...5
5 Business Case for Potable Water Tanks ...6
6 Business Case for Lightweight Galley Carts ...7
7 Business Case for Lightweight Carpets...9
1
Introduction
1.1
Objectives of the Thesis
The objective of this project is to lower the fuel consumption as much as possible in different areas, at the same time retain the highest levels of safety. By reducing fuel consumption TUIfly Nordic would not only lower costs, but also limit their impact on the environment. By saving 1% of fuel on a Boeing 737-800 would give a yearly reduction of fuel by 100 metric tons, which would decrease the emission of pollutants by 318.7 tons of CO2, 123.9 tons of H2O, 2.112 tons of
NOx, 98 kg of SO2 and 56 kg of CO (ref. [1]).
TUIfly Nordic is a member of the TUI group and is flying charter traffic for Fritids Resor with northern Europe as its base. TUIfly Nordic’s fleet consists of three Boeing 737-800 and two Boeing 757-200. All aircrafts flying from Stockholm, Gothenburg, Malmö, Oslo, Copenhagen and Helsinki to southern Europe. During winter period, one Boeing 767-300 is borrowed from
Thomsonfly, also member of the TUI group, to cover the higher demand of travels. This aircraft is foremost concentrating on destinations outside Europe like Thailand.
TUIfly Nordic has always been trying to lower the fuel consumption although in a limited effort. Since one year ago when IATA made an examination about what implementations and strategies TUIfly Nordic could do to lower the fuel consumption even more, a Fuel Conservation project has started in the company. The project covers pilot training for knowledge about useful methods to lower fuel consumption during flight and examinations about possibilities of interference on aircrafts and equipment onboard.
1.2
Execution of the Thesis
The first step of the project was to synchronize the flight plans calculated fuel consumption, calculated and issued by the Ground Operations Center (GOC) in Hannover, with the actual consumption of the flight. The actual consumption is simply the difference on the fuel gages before and after the flight. If the pilots gain confidence that the flight plans coincide well with the actual fuel consumption on each leg the pilots tend to avoid filling extra fuel, which results in less weight, which in turn results in lower fuel consumption, and still have enough fuel to conduct a safe flight. How the flight plans are adjusted is explained later in the thesis.
With the first step as the foundation for the project other possibilities to reduce fuel consumption were examined, which resulted in two main sub objectives: fuel saving policy implementation and fuel saving modifications to the aircraft. The latter examined through Business Cases to see if purchasing new equipment would be profitable.
2
Description of the Methods
2.1
Fuel Consumption Survey
The Original Flight Plan (OFP) contains among other things recommended fuel for the flight and the calculated route. Recommended fuel is divided into different parts. The main part is called “Trip Fuel”. That means fuel that is necessary for the calculated route. Added to that is different parts called: Contingency fuel which means fuel for unplanned holdings or bad weather, 1st alternate which means fuel needed for landing on different airport then planned, Final reserve which is fuel needed for safety’s sake and at last Taxi which means fuel for taxiing at the airports. Besides this, the pilot sometimes adds extra fuel which is called Additional fuel. This occurs if the flight crew believes there is a need for more fuel due to reasons not reflected in the flight plan. Typical examples being a sudden change in weather or if the crew believes there is a risk for a long holding.
When pilots are preparing and fueling for the flight their decisions are based on the OFP made in Hanover at the GOC. When creating the flight plans GOC uses a program called Skytrack. For the 737-800 Skytrack is linked to a database with information about every aircraft that is constantly updated for each flight that is conducted. For the 737-800 the data is automatically collected during flight and then sent to the ground by a system called ACARS. When Skytrack was implemented TUIfly Nordic pilots noted that they were on a regular basis landing with less fuel than stated on the OFP. An investigation was made to try and get to grips what the cause could be. The conclusion was that the data entered in to Skytrack was based on fuel data that was calculated by integrating the value measured by the fuel flow meters to get the total fuel consumption.
However, according to Boeing the fuel flow meters always have a slight error. An error that varies during the flight. This error can be between 1-10 per cent. To get to grips with the problem TUIfly Nordic on a regular basis conducts a Fuel Consumption Survey for each aircraft. The survey simply asks the pilot to fill in the value on the fuel gauges before and after the flight and to state if the flight was conducted according to the OFP. If it wasn’t conducted according to the OFP the data is disregarded. If the flight was performed according to the OFP the data is entered in to a spread sheet and compared to the value given by the OFP, see Figure 1.
The trip fuel on the OFP is calculated using a factor called “Drag Bias”. The Drag Bias is a factor comparing the drag increase of the aircraft during its life span compared to when the aircraft was new. This is due to that when the aircraft gets older the structure decays which results in higher drag because of skin friction, bad door sealing and weight increase (this is due to for example moisture in the insulation blankets). Since this Drag Bias factor is calculated by using the fuel consumption calculated by the fuel flow meters there is a risk for error. By performing the fuel survey the error between the OFP calculated trip fuel and the actual consumption can be found and the Drag Bias can be adjusted accordingly, thereby the future OFP trip fuel calculations will be closer to the truth.
For the Boeing 757-200’s there is a difference. Previously when Thomsonfly were operating these aircraft, performance gathering was done manually during flight by the pilots to give data to enable the calculation of the Drag Bias value for the Skytrack program. This was done because there is no ACARS system in the Boeing 757-200’s. Since it was 2-3 years ago that Thomsonfly were operating these aircrafts the Drag Bias values have not been updated for some time.
Therefore this survey was performed to get an updated Drag Bias value for the Boeing 757-200’s.
The pilots do not trust the OFP calculated fuel value to 100 per cent because of experience they know that the actual fuel consumption is a bit higher then the OFP calculated trip fuel. That is why they add additional fuel almost every time resulting in higher consumption because of extra
weight. Constructing a survey trying to synchronize the OFP calculated fuel value with the actual consumption should result in pilots getting more belief in the OFP and not adding additional fuel due to that the actual consumption is very close to the OFP calculated trip fuel.
2.1.1 Synchronizing OFP Fuel Consumption with Actual Consumption
The fuel gauges values were collected before and after completed flight, which will be referred to as the actual fuel consumption, because it shows the actual fuel volume before and after
completed flight. Apart from these, fuel consumption values from the ACMS were also collected which is based on the fuel flow meters. That value is not to trust 100 per cent because it is based on the fuel flow in different moments and then integrated by the computer to get the volume, which would accumulate the error margin more as longer the flight goes. The last value was the calculated trip fuel value from the OFP which also is the value the pilots base their fuel
consumption on. All these values were noted by the pilots during the flight on a ‘Fuel Consumption Survey’ paper, see Appendix (1).
By putting all these values into a Microsoft Excel worksheet the marginal of error was calculated by comparing the OFP calculated trip fuel consumption and the actual fuel consumption and also see how the ACMS value differs. Before doing this some adjustments were made since the OFP is based on values that differ from time to time. Take off weight and estimated time for flight are such values that may increase at the last moment due to changes in cargo and passengers. These changes were also noted on the ‘Fuel Consumption Survey’ paper. Therefore the OFP calculated trip fuel had to be changed before calculating the differs and getting the new fuel bias value for each aircraft.
By each extra 1000 kg added at the last moment 1.2% was added (Boeing 737-800) or 0.87% (Boeing 757-200) of the pre-calculated trip fuel. For each minute extra or less of the total flight time in relation to the estimated time 44,2 kg (Boeing 737-800) or 61.8 kg (Boeing 757-200) of
the calculated trip fuel was added or reduced. Those numbers and percentages were already known through earlier studies by pilots and engineers in different circumstances. The last thing needed to adjust was fuel for taxiing. In the OFP calculated trip fuel taxi fuel is not included, so for taxing 300 kg (Boeing 737-800) or 450 kg (Boeing 757-200) was added. However, sometimes the pilot’s uses just one engine when they are taxiing (Single Engine Taxi), in that case 2.3 kg (Boeing 737-800) or 5.2 kg (Boeing 757-200) was removed for each minute using SET, these values also known from earlier studies.
By getting an average value from all the flights of the now corrected OFP calculated trip fuel a value was calculated of how much the OFP calculated trip fuel differs from the actual
consumption on that aircraft. The value was given in per cent and also known the “fuel bias” value. By sending the values to GOC in Hannover for each aircraft, should this result in smaller differences between actual consumption and the OFP calculated trip fuel in the future.
2.1.2 Single Engine Taxi
By using one engine while taxiing it is possible to make big savings in fuel, which is why TUIfly Nordic is trying to implement it. This will hopefully result in pilots doing it as a standard
procedure. See Table (1) for approximated savings.
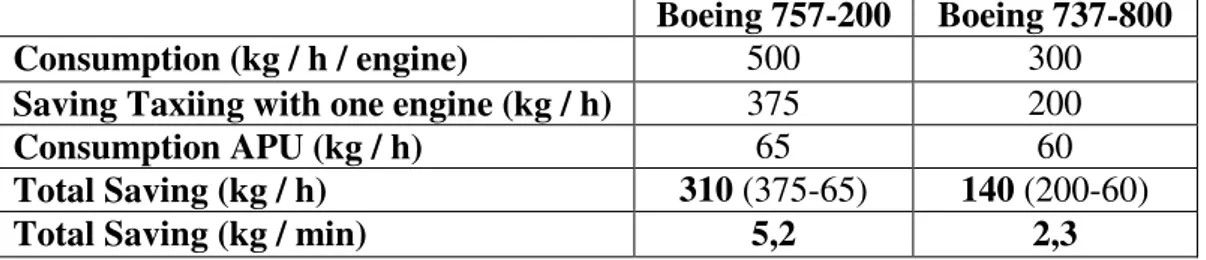
Table 1: Savings using Single Engine Taxi
Boeing 757-200 Boeing 737-800
Consumption (kg / h / engine) 500 300
Saving Taxiing with one engine (kg / h) 375 200
Consumption APU (kg / h) 65 60
Total Saving (kg / h) 310 (375-65) 140 (200-60)
Total Saving (kg / min) 5,2 2,3
Sometimes it is not an opportune moment to use SET because of weather and taxi way conditions. The airports may not allow this either because of bad taxi ways. If it is allowed and the conditions are good the pilot may use this method if he or she thinks it is appropriate. Before they turn one engine off it needs to be cooled, meaning that it has to be run in ground idle mode a while in order not to damage the engine. Cooling times for engines on Boeing 737-800 is 3 minutes and 1 minute for engines on Boeing 757-200 (ref. [2]).
From the worksheet based on the “Fuel Survey” paper information was obtained about how many times and how long time SET had been used. By dividing the total time for the different aircraft types with the number of cycles the author could get an average time for each cycle SET used. With that average time the author could see the average total SET time per year by multiplying it with total numbers of cycles per year.
2.1.3 Contingency Fuel
Contingency fuel is a part of fuel that all operators need to add on the calculated trip fuel from the OFP. This fuel is needed for cases when the aircraft is in holding times in the air because of heavy traffic or different weather conditions then expected. Usually the contingency fuel is 5 per cent of the trip fuel, but airlines can change this to 3 per cent which is already done at the Boeing 737 fleet in TUIfly Nordic. Before doing this at the Boeing 757 fleet TUIfly Nordic needs to be sure that 3 per cent is really enough. TUIfly Nordic chose that getting less difference between actual
and calculated trip fuel would be enough for lowering to 3 per cent meant that a second Fuel Survey needed to be performed after the fuel bias updates to see the results.
2.2
Research of the Needs of an Air Conditioning Unit
Research was done to find if an Air Conditioning Unit at Arlanda airport would be more
appropriate then running the APU while loading passengers and baggage in the summer when the hot climate heats up the cabin. An APU is a small jet engine installed in the tail at all passenger aircrafts. The main function of the engine is to deliver air when starting the main engines, but it is also used to deliver power and chilled or warm air to the cabin. The engine is very expensive to use because of the high fuel consumption and the expensive maintenance.
An ACU is a compressor that is connected into the airframe feeding the aircraft with chilled air. There are two different types of ACUs, electrical and diesel driven. An electrical ACU would not be optimal because of electrical power charges when used at gate. The diesel driven is more optimal because it is usable everywhere, even when not parked at gate for example when doing maintenance. That is why the diesel driven ACU was in focus.
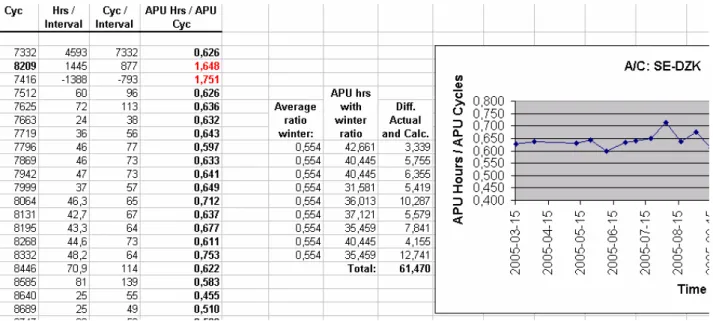
The first step was to look into APU data to see if the running hours were in fact higher in the summer then in the winter. This research was based on reports from the technicians doing their service check on the APU every 14 day, when they also recorded how many cycles and hours the APU had been doing in its lifetime. A good way to determine the usage is to compare cycles in relation to hours and see if the APU runs longer per cycle in the summer. By calculating a ratio between hours and cycles it was possible to calculate an average value for the winter, see Figure 2. This average value was then compared to the summer’s ratio to see the difference. By estimating a value for APU time saving it was possible to calculate what the savings would be and then
compare it to the cost for purchasing an ACU and operating it.
Figure 2: Calculations for average APU ratios
2.3
Reducing Weight
By removing unnecessary equipment or minimize unnecessary uplifting is it possible to make big savings. It is often difficult to know how much weight it is possible to remove and still retain
means of safety and passenger comfort. Therefore it is really important to have a good basis of information before doing changes or modifications to the aircraft.
2.3.1 Potable Water Tanks
The potable water tank contains water used during flight by both flight attendants and passengers. The tanks are refilled before each flight to the highest level possible, 60 US gallons (227 liters), on both Boeing 737-800 and 757-200. This is standard procedure and water is always filled until it starts running out from a hole in the airframe at which point the tank is full. On each tank in the aircrafts there is a standpipe leading the water from the tank outside the aircraft when overfilled, which is why the water runs out from the airframe. Boeing offers different standpipes to the tanks; on the Boeing 737-800 is it possible to use standpipes which limit the tanks max volume to 40, 50 and 60 US gallons, on the Boeing 757-200 is it possible to use standpipes which limit the tank max volume to 50 and 60 US gallons.
Another method to limit the amount of water in the tanks is to install an amount indicator near the refilling hole making it possible to see the amount of water in the tank. By making this
modification is it possible for the aircraft crew to order how much water they want for the flight from the water service person. Another possible solution for limiting the amount of water is to have a route specific amount of water which the person filling water adjusts to.
To see how much water that actually is used a potable water consumption survey was carried out to research the possibilities of lowering the amount of water below 60 US gallons, which is standard volume on TUIfly Nordic’s aircrafts. This was done by adding a text field on the cabin crew checklist where they had to fill in the water volume in the tanks before takeoff and after completed flight.
2.3.2 Lightweight Galley Carts
Galley carts also known as Trolleys are used by the crew onboard the aircrafts to serve food and beverages to passengers. TUIfly Nordic was going to buy 125 new carts for the upcoming season and two different quotations were asked for: one for standard carts and one for lightweight carts. The project was to calculate which one of these two types to use based on costs and benefits. Of the 125 carts were 100 of these full-size carts and 25 half-size carts. The lightweight full-size carts were 5.5 kg lighter and the lightweight half-size carts 4 kg lighter then the standard carts. The costs for the lightweight carts were 100 EUR extra for each cart in comparison with the standard carts. With this information was it possible to make different business cases for different scenarios to see if lightweight carts would be preferable.
2.3.3 Lightweight Carpets
This project was to calculate if the carpets used in the cabin and galley could be replaced with lighter carpets and still retain the same strength.
The standard carpet that is in use today on all aircrafts in the fleet weighs about 1600 g/sqm. By getting information from Thomsonfly about lightweight carpets that they had been starting to use, got the author and manager Petrus Boltjes in contact with the company doing the lightweight carpets, Lantal Textiles. They were offering a product with the same strength but with almost half the weight, 880 g/sqm. This carpet was not just lighter, but also cheaper.
To calculate the savings in weight were drawings showing how big and were the carpets should be placed used. From these drawings was the author able to calculate the area of carpets and by that calculate the weight difference between the original carpet and lightweight carpet.
To calculate the savings in cost the author had to calculate the consumption of carpets per year to see the savings. TUIfly Nordic is changing the carpets in the center walk of the cabin each 10 weeks and under the seats every 30 weeks. The area for these two different areas could be cleared from the drawing and by that information could the savings in cost be calculated.
2.3.4 Removing Chillers from Galley
In all Boeing 737-800 there is a chilling unit in the galley used for chilling the food for the passengers. All food that is served onboard is already deep frozen when loaded why this unit is never used.
By removing the chilling unit is it possible to save weight. To make this the author had to do a Technical Order containing information about what to do and why followed by a description how to do it. All TOs need to be referred to a part in the AMM or a SB where the methods is explained and authorized. The TO was referred to a SB that had been released 4 years ago containing
information about how to modify the compartments in the galley and also how to remove the chiller.
2.4
Route Specific Taxi Fuel
The idea with this project was to have a route specific amount of taxi fuel instead of a standard amount. When the calculations for the flight plan are made Skytrack always adds 300 kg (Boeing 737-800) or 450 kg (Boeing 757-200) of fuel for taxiing. All the taxi fuel is not always used because of shorter taxi times at certain airports, why the author wanted to ask about the pilots’ thoughts and experiences and make a research of average taxi times at airports TUIfly Nordic flies to. Taxi times are available in the IDPS database where data is saved automatically direct from the aircraft computers. By collecting these and calculating an average taxi time value is it possible to get an average value of fuel needed for taxiing. Those values could be used by estimating a route specific taxi fuel.
2.5
Route Specific Cost Index
Cost Index is a ratio between time-related cost of an aircraft operation and cost of fuel. Cost Index = Time Cost ($/hr) / Fuel Cost (cents/lb)
The CI value is entered into the Flight Management Computer (FMC), the FMC uses this value and other parameters to calculate the best way to fly regarding climb, cruise and descent speeds. By entering a zero for CI would result in maximum range with minimum fuel, by entering maximum value for CI would instead result in minimum time speed. Climb and descend are strongly influenced by the CI, to see the changes in climbing and descending for different CI see Figure 3 and 4.
The time cost is time-related operating cost, for example maintenance on engines and APUs but also crew wages. These values can also be fixed by calendar period and have no correlation to flying time, and if so, they should not be included. The fuel cost is more complicated because of highly variable fuel prices on all airports. By calculating one CI used for all aircrafts for all destinations is not optimal because of this.
Figure 3: Effect of Cost Index when climbing (ref. [4])
Figure 4: Effect of Cost Index when descending (ref. [4])
By using a route specific CI is it possible to get a CI that corresponds more exactly to each flight. This is done by calculating a different CI for each route based on fuel costs at the location where fuelling is performed resulting in optimal flying for each route regarding fuel and time-related costs.
2.6
Winglets
The purpose of a winglet is to reduce total drag. There is different types of drag influenced by a winglet, the profile drag increases with a winglet because of bigger area of the wing exposed to the air, the lift induced drag decreases with a winglet. To understand how this works knowledge about how these types of drags are created is necessary.
When the air is moving along a wing surface friction arises (due to the fact that air is viscous) between the surface and the air-molecules closest to the surface. It is possible to say that some of the energy from the wing goes to set the closest air in motion, and this energy is called profile drag.
The lift induced drag arises when lift is produced by the wing. In this situation a higher pressure exist on the bottom surface of the wing and lower pressure on the top surface of the wing. These pressure differences creates a spanwise flow that moves outward below the wing and inward over the wing, it is possible to say that the air gets pressed out from the lower surface due to higher pressure. This spanwise flow creates a swirling motion at the wingtip known as wingtip vortices, this vortex requires energy and that energy shows up as lift induced drag. See Figure 5 for differences in vortices with and without winglet.
Figure 5: Differences in vortices between conventional wingtip and blended winglet By adding a winglet at the wingtip works like an endplate which reduces the spanwise flow resulting in lift induced drag to decrease. The profile drag increases because of the extra wet area exposed for the air flow, but this increase is not much compared to the gain in lift induced drag.
Blended winglet is a type of winglet that is not completely perpendicular to the wing, it has a bigger angle between the wing and the winglet and is smoothly rounded off. Aviation Partners Boeing has patent on this type of winglet and is used on Boeing aircrafts.
2.7
Zonal Drying™ System
This is a system delivered by the company CTT Systems AB. The systems purpose is to lower the weight in aircraft by removing the condensation that creates between the inner and outer body. This results in weight savings up to 500 kg, reduces in internal corrosion, reduces in risk of electrical failure due to condensation and also the passengers comfort by eliminating rain in the plane.
When the aircraft is on the ground moisture enters both from open doors and passengers boarding. This moisture condenses on the inner skin of the aircraft because of the cold skin resulting in high weight of water and ice inside the airplane. When installing the Zonal Drying system the
moistured air enters an inlet fan and gets separated to two different airstreams. The first air stream passes through a rotor that absorbs the humidity and then releases it as dry air to the inner skin. The second air stream is regeneration air that gets heated up before entering the rotor were it absorbs the humidity collected from the first air stream, the second air stream then gets expelled through a separate outlet back to the cabin which results in higher moistured air in cabin.
3
Results
3.1
Fuel Consumption Survey
3.1.1 Synchronizing OFP Fuel Consumption with Actual Consumption
See Appendix (2) for detailed calculations and results.
The survey resulted in a new fuel bias value for each aircraft, these values were reported to GOC in Hanover and will be used in the future when calculating flight plans for the aircrafts. This gave more precise values on the flight plan that agreed better with the actual consumption regarding to pilots. Hopefully will this result in pilots not adding extra additional fuel that is not required for the flight because of gained trust to the flight plan. By doing a new Fuel Consumption Survey after the fuel bias values were updated could we see that the actual consumption and the OFP calculated trip fuel was much more equal then before.
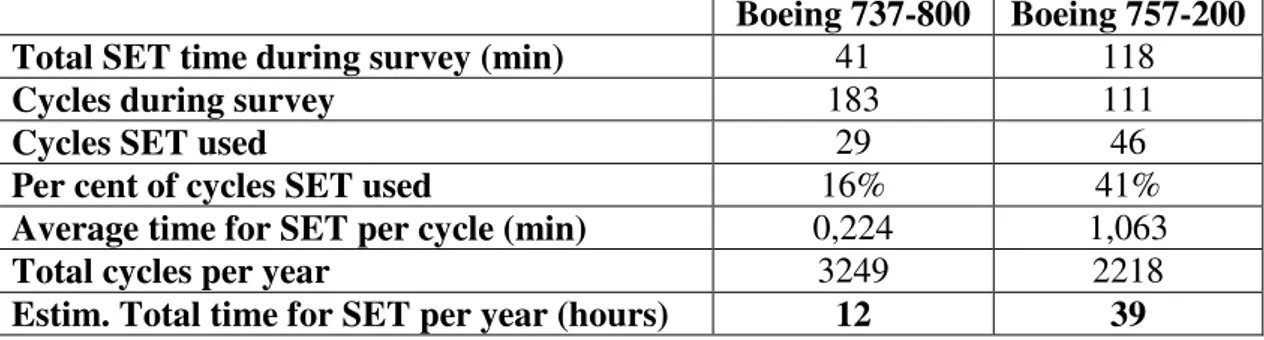
3.1.2 Single Engine Taxi
See Table (2) for results of calculations.
Table 2: Single Engine Taxi fuel survey data and results of calculations
Boeing 737-800 Boeing 757-200
Total SET time during survey (min) 41 118
Cycles during survey 183 111
Cycles SET used 29 46
Per cent of cycles SET used 16% 41%
Average time for SET per cycle (min) 0,224 1,063
Total cycles per year 3249 2218
Estim. Total time for SET per year (hours) 12 39 For economic benefits and savings calculations see Business Case in Appendix diagram (3). The survey showed that SET was used at 16 per cent of the cycles at the Boeing 737-800 fleet and 41 per cent of the cycles at the Boeing 757-200 fleet. Why SET usage on the Boeing 737-800 was lower then the Boeing 757-200 could be because of the longer cooling times. The result of the research showed that SET is used and implemented in the standard procedures and gives approximately a saving by 10 000 EUR per year for the whole fleet. We could also see that the SET usage on the Boeing 737-800 fleet was bigger on the latest Fuel Consumption Survey, almost 30 per cent. This could be due to the new summer schedule which means different destinations from the winter schedule. These airports may have longer taxi ways which could give more opportune moments for using SET.
3.1.3 Contingency Fuel
By doing the Fuel Consumption Survey TUIfly Nordic was able to change the amount of contingency fuel to 3 per cent instead of 5 per cent on the Boeing 757-200 fleet, resulting in weight savings about approximately 300 kilogram each flight corresponding in 30 000 EUR savings for each Boeing 757-200 aircraft per year. This was possible because of gained trust to the calculated fuel consumption on the flight plan. This may still mean pilots add extra additional fuel
because of contingency fuel per cent is lowered, especially in the beginning before the pilots get used to the new amount of contingency fuel. But probably they never add so much extra which would result in exceeding the old 5 per cent amount of contingency fuel, meaning this is still a big saving.
3.2
Research of the Needs of an Air Conditioning Unit
By the summer one Boeing 757-200 aircraft is flying fulltime from Arlanda and one Boeing 737-800 aircraft halftime. The summer schedule for these two aircrafts shows that it is almost possible to use one ACU for both aircrafts, of 22 departures in one week is it possible to use the ACU on 20 of these. By analyzing old APU data and compare it between an average summer period with an average winter period was the author able to see that TUIfly Nordic would save approximately 50 APU hours per aircraft with an ACU. Meaning with one and a half aircraft flying fulltime from Arlanda savings about 75 APU hours per year could be achieved. With these values and the cost for an ACU could the author make a business case, see Appendix (4).
The business case showed that approximately 16 years would be claimed before the cost for an ACU could be paid back. The cost for the ACU was much higher then expected and the payback time was to long which resulted in not investing in an ACU. 16 years in an airline are much meaning changes in the fleet resulting in aircraft types not compatible with the ACU.
3.3
Reducing Weight
The weight reduction calculations is based on known values from International Aviation Transport Association report for TUIFly Nordic (ref. [2]).By removing one kilogram on one Boeing 737-800 aircraft it is possible to save 144 USD per year, for a Boeing 757-200 it is possible to save 126 USD per year regarding IATA calculations.
3.3.1 Potable Water Tanks
By doing the water survey was it possible to see how much water that is used on each flight for each destination. Having this information made it possible to calculate an average value of how much water that was needed for each destination with an extra part of water for unforeseen circumstances.
The first method by using standpipes lowering the max volume in the potable water tanks
permanently would not me optimal for TUIfly Nordic due to big differences in flight destinations from summer to winter. During summer are the distances much shorter while much longer in the winter meaning during summer would this method work excellent but during winter could this end up with empty water tanks in the air. In some countries is it not possible to fill the water tanks because of bad water quality, which means tank need to be filled for two flights when leaving home base.
The second method using the water amount indicators near the filling hole could have been the best solution. We got in contact with Boeing to see if this modification were possible and answered that it was possible to do but they had to create a Service Bulletin with approved instructions how to do the modification which were very expensive.
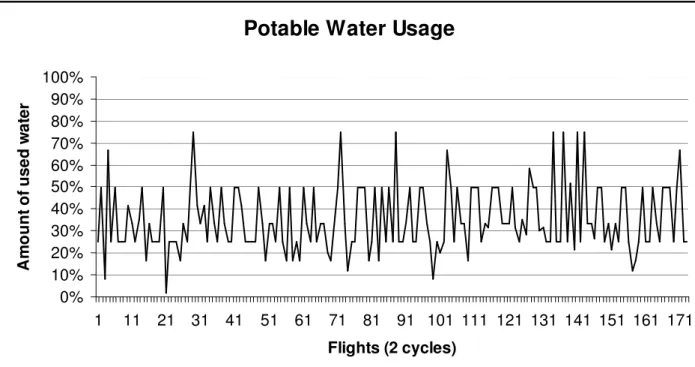
Potable Water Usage
0% 10% 20% 30% 40% 50% 60% 70% 80% 90% 100% 1 11 21 31 41 51 61 71 81 91 101 111 121 131 141 151 161 171 Flights (2 cycles) A m o u n t o f u s e d w a te rDiagram 1: Results of Potable Water Survey
Regarding to data from the water survey that previously been started is it possible to see that it is too much water on the flights, see Diagram 1. If it is possible to find a good method to limit the amount of water could the savings in weight at least be 50 kg by reducing the amount of water with 20 per cent which corresponds to a fuel saving worth 34 000 USD per year. See Appendix (5) for details.
3.3.2 Lightweight Galley Carts
After calculating extra costs for lighter galley carts and comparing it to savings in fuel chose TUIfly Nordic to buy the lightweight galley carts. The calculations showed the difference in cost would repay itself in fuel after six months if the lightweight carts could be used all the time. TUIfly Nordic already has many standard galley carts which also are being used, to make it more realistic were some of the calculations based on new galley carts being used 10 per cent of all flights meaning the payback time to be six years. By using the lightweight carts on all flights savings in fuel worth 25 000 EUR per year on the whole fleet is possible to achieve and 2 500 EUR if used on 10 per cent of all flights per year. See Appendix (6) for detailed calculations. Regarding durability and repair costs is there no difference between standard and lightweight carts from experiences from other airlines.
3.3.3 Lightweight Carpets
Regarding to Thomsonfly the lightweight carpet from Lantal Textiles is working well. The strength of the carpet is as the standard carpet and Thomsonfly has not been experiencing any other problems with the lightweight carpets.
The total carpet area in the Boeing 737-800 is 78.5 square meters. This would give a weight reduction by 57 kg, worth 6 050 EUR per year. For the Boeing 757-200 the total carpet area is 76.4 square meters which would give a weight reduction by 55 kg, worth 5 115 EUR per year. By using the lightweight carpet it is also possible to save 6 EUR per square meter because of the
lower price. For one Boeing 737-800 the consumption of carpet is 220 square meters per year giving a saving in cost by 1 340 EUR, for the Boeing 757-200 the consumption of carpet is 228 square meters giving a saving in cost by 1 390 EUR. See Appendix diagram (7) for detailed calculations and business case.
TUIfly Nordic has made an order from Lantal Textiles and will try these carpets next time when time for changing.
3.3.4 Removing Chillers from Galley
The technical order for removing the chillers were approved by the manager of engineering and placed as a job for the technicians to do when necessary time were found. By removing the
chillers from the galley TUIfly Nordic were able to reduce 26 kg at each Boeing 737-800 resulting in savings about approximately 2 600 EUR per year for each aircraft.
3.4
Route Specific Taxi Fuel
This project could be successful. By asking pilots of their experience and thoughts about having a route specific amount of taxi fuel the author’s conclusion was that this could be a good idea. Due to lack of time the author was not able to look into taxi times at different airports to calculate average taxi times. Regarding to Thomsonfly they have seen that the amount of taxi fuel is too big at different airports when comparing it to average taxi times at these airports. At some destinations may the standard amount of taxi fuel be too small compared to the average taxi time, the author still thinks that it is possible to reach savings anyway even if the taxi fuel is going to be bigger on some destinations.
3.5
Route Specific Cost Index
By changing to route specific cost index it is not sure that it results in fuel saving. The cost index is based on time costs and fuel costs meaning that this index is used to fly the most economic way for TUIfly Nordic, could mean the aircraft burning more fuel to minimize time in air if the time costs are high. Nowadays the fuel prices are very high which probably result in savings in fuel. Regarding to IATA calculations for TUIfly Nordic it is possible to save 0.25 per cent in fuel by changing to route specific cost index based on fuel prices today.
When GOC makes the flight plans in Skytrack it is possible at the same time to calculate a route specific cost index for each flight. Skytrack has information about current fuel prices at the different airports, meaning the only thing that needs to be entered into the Skytrack system is information about time costs for the aircrafts. TUIfly Nordic already has been starting to use route specific cost index on the Boeing 737-800’s. By doing new time cost calculations for both the Boeing 737-800´s and 757-200´s TUIfly Nordic were able to start using route specific cost index on all aircrafts in the fleet.
During winter TUIfly Nordic borrows a Boeing 767-300 from Thomsonfly by a package cost based on hours in air. This made it very easy for TUIfly Nordic to start using route specific cost index on that aircraft too when flown by TUIfly Nordic.
3.6
Winglets
By adding winglets on the wings it is possible to reach savings at 3-5 per cent in reduced drag calculated by Boeing. This contributes to a saving in fuel worth 655 000 EUR for the whole fleet. TUIfly Nordic has already installed blended winglets on the Boeing 737-800’s and has got the
200´s that will be joining the fleet when the two current ones will be given back to the owners in the beginning of the year 2008.
3.7
Zonal Drying™ System
The Zonal Drying System has been approved for the Boeing 757 where excess water is a big problem for TUIfly Nordic. The system will be installed on the two new Boeings 757-200’s that will be changed to instead of the two current ones in the beginning of the year 2008. The weight savings in reduced water carried is calculated to be 250 kg for each flight which corresponds to 29 000 USD per aircraft and year. This also contributes by reducing corrosion and electrical failures corresponding to 43 000 USD per year. These figures calculated by TUIfly Nordic and CTT Systems. Totally a yearly saving worth 101 000 USD for the whole fleet.
4
Conclusions and Proposals for Further Studies
The thesis covers only a small part of all the methods possibly to use to limit the discharges of harmful substances. The main objectives were known methods mentioned by IATA to limit discharges, from that start it was possible to look deeper into other areas particular for TUIfly Nordic for savings.
It is always possible to save fuel and limit the discharges, but it is not simple to know how much reduces that is possible to do regarding passenger comfort and safety. For example regarding the pilots’ way to fly and maneuver the aircraft could limit the discharges very much, but these savings gets really small if an incident would happen demanding a go-around or an extra stop for refueling. Another example could be limiting the amount of potable water to much resulting in empty water tanks during flight decreasing passenger comfort. That is why all changes and methods need to be implemented carefully.
It is hard to calculate how big the savings get by the methods implemented. Methods like using route specific cost index and synchronizing OFP calculated trip fuel with actual fuel consumption do not have a certain saving in fuel. They are made for reducing operational costs on the whole and gain trust in the OFP. Hopefully will they mostly generate savings in fuel but it would be impossible to calculate it during a 10 weeks thesis.
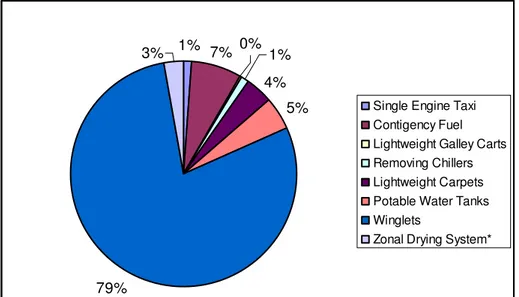
A compilation of all methods mentioned in this thesis covers a saving worth 830 000 EUR per year for the whole fleet which corresponds to 4 883 000 kg reduce in carbon dioxide emissions per year for the whole fleet. See Diagram 2 & 3 for distribution between the projects and Appendix (8) for compilation.
1% 79% 3% 7% 0% 4% 5% 1%
Single Engine Taxi Contigency Fuel Lightweight Galley Carts Removing Chillers Lightweight Carpets Potable Water Tanks Winglets
Zonal Drying System*
Diagram 2: Distribution of the savings
6% 35% 1% 18% 23% 13% 4%
Single Engine Taxi Contigency Fuel Lightweight Galley Carts Removing Chillers Lightweight Carpets Potable Water Tanks Zonal Drying System*
Diagram 3: Distribution of the savings except winglets
This saving can be a lot bigger by implementing other methods and changes on aircrafts. The biggest area were still a lot can be made is in the cabin and galley, were standard equipment can easily be changed to lightweight equipment. One kilogram reduction on a Boeing 737-800 in TUIfly Nordic contributes to a saving worth 106 EUR per year. The pilots’ procedures and way to fly the aircraft is also one of the most important areas to work with. Reduced flap landings and lower power take offs is two good examples of pilot procedures that can be implemented for fuel saving. Route specific taxi fuel is an area well worth of to look. Studying taxi times and collect data for different airports could result in big reductions in standard amount of taxi fuel at certain routes resulting in lower weight onboard.
5
Acknowledgements
I would like to thanks Petrus Boltjes, Manager of Engineering and Planning, and all the other members of the Engineering and Production Department at TUIfly Nordic for all the help and information you provided me with during my thesis.
Also I would like to thank Captain and Training Manager Leif Bielk for all the education and helping concerning flight operations.
6
References
[1] International Air Transport Association, Guidance Material and Best Practices for Fuel and Environmental Management, 1st Edition, Montreal - Geneva, December 2004
[2] TUIfly Nordic AB, Fuel and Environment Management Folder, Training Folder, January 2007 [3] International Air Transport Association, Fuel Efficiency Gap Analysis Final Report for TUIfly Nordic AB, Stockholm, September 2006
[4] Aero Quarterly, Bill Roberson, Fuel Conservation Strategies: Cost Index Explained, QTR_02 2007
Appendix
List of diagrams
Diagram 1.) Fuel Consumption Survey Sheet
Diagram 2.) Fuel Consumption Survey Calculations and Results Diagram 3.) Business Case for Single Engine Taxi
Diagram 4.) Business Case for Air Conditioning Unit Diagram 5.) Business Case for Potable Water Tanks Diagram 6.) Business Case for Lightweight Galley Carts Diagram 7.) Business Case for Lightweight Carpets Diagram 8.) Compilation of Savings
3
Business Case for Single Engine Taxi
Single Engine Taxi In (Boeing 737 & 757 fleet)
Benefits Savings Savings
per Year USD SEK
Fuel Saved Fuel Saved Fuel price per Hr per Year per Ton ($) 1. Less use of one engine due to SET (B737) KG Ton
Estimated SET hours: 12 (16%) 140 1,7 $700 $1 176 8 232
2. Less use of one engine due to SET (B757) KG Ton
Estimated SET hours: 39 (41%) 310 12 $700 $8 463 59 241
Total Yearly Benefits $9 639 67 473
Sensitivity
A 25% change in fuel price affects the:
4
Business Case for Air Conditioning Unit
Air Conditioning Unit for BLX Fleet at Arlanda
Cost Cost Cost
First Year Quantity Rate ($) per USD SEK
Quantity
Air Conditioning Unit 1 $99 425 -$99 425 -695 975
Total Investment First Year -$99 425 -695 975
Benefits Savings Savings
per Year USD SEK
Fuel Saved Fuel Saved Fuel price per Hr per Year per Ton ($)
1. Less Use of APU Due to ACU KG Ton
Estimated reduction: 75 Hrs 120 9,0 $700 $6 300 44 100
Total Yearly Benefits $6 300 44 100
Payback Time Months: 189
Sensitivity
A 25% change in fuel price affects the:
Total Yearly Benefits with: $1 575
5
Business Case for Potable Water Tanks
Potable Water Tanks
Benefits Savings Savings
per Year USD SEK
Cost of Cost of
weight per kg weight
1. Lower Weight Due to Less Water Carried per year per a/c per year per a/c
Estimated reduction (B737): 50 kg 144,3 7215,0 $21 645 151 515 Estimated reduction (B757): 50 kg 126,5 6325,0 $12 650 88 550
Total Yearly Benefits $34 295 240 065
Sensitivity
A 25% change in fuel price affects the:
6
Business Case for Lightweight Galley Carts
Using Lightweight Carts Instead of Standard Carts
Cost based on all carts and benefits based on lighter carts always carried on B738 and B752 fleet
Cost Cost Cost
Quantity Cost Diff. EUR SEK
(EUR)
Lighter Full Size Carts (5,5 kg) 100 €100 -€ 10 000 -90 000
Lighter Half Size Carts (4 kg) 25 €100 -€2 500 -22 500
Total Investment -€12 500 -112 500
Benefits Savings Savings
per Year EUR SEK
Savings (EUR)
Savings (EUR)
of weight of weight
Lower Weight Due to Lighter Carts Carried per kg per a/c* per a/c
Estimated reduction B738: 49 kg €106,1 €5198,9 €15 597 140 370 Estimated reduction B752: 52 kg €93 €4836 €9 672 87 048 Total Yearly Benefits -whole fleet €25 269 227 418
Payback Time Months: 6
Sensitivity
A 25% change in fuel price affects the:
Total Yearly Benefits with: €6 317
and Increases/decreases the payback time with Months: 1,2
Estimated reduction based on:
Boeing 737-800: 6 Full-size carts = 33 kg 4 Half-size carts = 16 kg Total: 49 kg Boeing 757-200: 8 Full-size carts = 44 kg 2 Half-size carts = 8 kg Total: 52 kg
Using Lightweight Carts Instead of Standard Carts (B737-800) Based on one set carts for each aircraft always carried
Cost Cost Cost
Quantity Cost Diff. EUR SEK
per aircraft (EUR)
Lighter Full-size Carts (5,5 kg) 6 €100 -€600 -5 400
Lighter Half-size Carts (4 kg) 4 €100 -€400 -3 600
Total Investment
per A/C -€1 000 -9 000
Benefits Savings Savings
per Year EUR SEK
Savings (EUR)
Savings (EUR)
of weight of weight
1. Lower Weight Due to Lighter Carts Carried per kg/year* per year
Estimated reduction: 49 kg €106,1 €5198,9 €5 199 46 790
Total Yearly Benefits per A/C €5 199 46 790
Payback Time Months: 2
Sensitivity
A 25% change in fuel price affects the:
Total Yearly Benefits with: €1 300
and Increases/decreases the payback time with Months: 0,5
7
Business Case for Lightweight Carpets
Lightweight Carpets
Benefits Savings Savings
per Year EUR SEK
Savings (EUR) Savings (EUR)
of weight of weight
1. Lower Weight Due to Lighter Carpets Carried per kg per a/c* per a/c
Estimated reduction B737 a/c: 57 kg € 106,1 € 6 048 € 18 143 163 288 Estimated reduction B757 a/c: 77 kg € 93,0 € 7 161 € 14 322 128 898
2. Cheaper Carpets per sqm per a/c per a/c
Estimated area B737 a/c: 220 sqm € 6,1 € 1 342 € 4 026 36 234 Estimated area B757 a/c: 270 sqm € 6,1 € 1 647 € 3 294 29 646 Total Yearly Benefits - B737 & B757 fleet € 39 785 358 066
Sensitivity
A 25% change in fuel price affects the:
8
Compilation of Savings
Completed Projects Savings in fuel (EUR) - whole fleet Savings in fuel (SEK) -whole fleetSingle Engine Taxi € 10 000 90 000 kr
Contigency Fuel € 60 000 540 000 kr
Lightweight Galley Carts € 2 500 22 500 kr
Removing Chillers € 7 800 70 200 kr
Total (per year): € 80 300 722 700 kr
Ongoing Projects Lightweight Carpets € 32 000 288 000 kr
Potable Water Tanks € 40 000 360 000 kr
Winglets* € 655 000 5 895 000 kr
Zonal Drying System* € 22 500 202 500 kr
Total (per year): € 749 500 6 745 500 kr
* Savings calculated by manufacturer

![Figure 3: Effect of Cost Index when climbing (ref. [4])](https://thumb-eu.123doks.com/thumbv2/5dokorg/4558525.116279/12.892.206.690.156.524/figure-effect-cost-index-climbing-ref.webp)