This work was published in Wear (284/285) pages 18-29 in 2012. Online version: http://dx.doi.org/10.1016/j.wear.2012.01.016
A pin-on-disc study of the rate of airborne wear particle emissions from
railway braking materials’
Saeed Abbasi¹, Anders Jansson², Lars Olander³, Ulf Olofsson¹, Ulf Sellgren¹ 1KTH Machine Design, SE 100 44, Stockholm, Sweden
2Stockholm University Applied Environmental Science, SE 106 91, Stockholm, Sweden
³KTH Building Service Engineering, SE 100 44, Stockholm, Sweden Corresponding author’s email: sabbasi@md.kth.se
ABSTRACT
The current study investigates the characteristics of particles generated from the wear of braking materials, and provides an applicable index for measuring and comparing wear particle emissions. A pin-on-disc tribometer equipped with particle measurement instruments was used. The number concentration, size, morphology, and mass concentration of generated particles were investigated and reported for particles 10 nm to 32 µm in diameter. The particles were also collected on filters and investigated using EDS and SEM. The effects of wear mechanisms on particle morphology and changes in particle concentration are discussed. A new index, the airborne wear particle emission rate (AWPER), is suggested that could be used in legislation to control non-exhaust emissions from transport modes, particularly rail transport.
This work was published in Wear (284/285) pages 18-29 in 2012. Online version: http://dx.doi.org/10.1016/j.wear.2012.01.016
1. Introduction
The generation of airborne particles is a multi-faceted issue of interest to many researchers. Physicists and chemists are interested in the characteristics of these particles at the nano-scale, because of the huge property differences between nano-scale and bulk materials. Environmental researchers, physicians, and occupational health organizations study the mass, number, size, and morphology of these particles because of their possible adverse effects on human health.
Wear has been studied extensively with a focus on surface wear in various metallic and non-metallic materials (see for example [1]). In addition, wear particles are of great concern as they can be detrimental to sliding and other processes [2]. Unlike the case of exhaust emissions, concern about the effects of airborne wear particle characteristics on air quality has been limited in recent years. This matter is described as particle emissions from non-exhaust road transport sources, and brake pads, tyres, and the road surface are the main sources of such wear particle emissions. Methodologies for investigating such particles, along with the results so obtained, have recently been reported [3]. According to these results and methodologies, the mass of generated particles is measured in mg km–1 according to the size fractions of particles. The gross weight, operational conditions, and functionalities of road vehicles affect the emission rate of particles from these sources, particularly from tyres and brake pads [4].
A century ago, the high mass concentrations of wear particles in subways attracted research interest, prompting the measurement of particle mass concentrations in the New York subway [5]. Since then, several studies have confirmed and characterized the high mass concentrations of particles in underground rail traffic and reviewed the adverse health effects of these particles [6,7]. However, none of them attempts to explore the actual mechanisms of wear particle generation. The braking materials (i.e., brake blocks against railway wheels and brake pads against brake discs) have been recognized as the main sources of non-exhaust emissions in rail transport [6–9].
This work was published in Wear (284/285) pages 18-29 in 2012. Online version: http://dx.doi.org/10.1016/j.wear.2012.01.016
However, measurement noise and external disturbance are intrinsic to field testing; eliminating these problems calls for laboratory testing under controlled conditions. Sundh et al. [10] performed laboratory tests under selected loading conditions representing different contact conditions in a real wheel–rail contact. They found that the number of generated particles increased when the applied load increased, but that the particle size distribution was not dependent on the applied load. Abbasi et al. [11] simulated train mechanical braking at 70 km h–1 and reported a good correlation between particle size distribution in both field tests and laboratory simulations.
Notably, only a few studies have examined the characteristics of particles generated from railway components. Above all, no emission factor has been introduced to link airborne wear particle emissions from their source to real operational conditions. The main objective of this study is to investigate the characteristics of particles from various railway sources under controlled conditions. To this end, a series of laboratory tests has been conducted to investigate the number, size, size distribution, and morphology of particles generated from railway brake blocks, and brake pads. In addition, a new factor has been introduced that can be used to compare the particle emissions generated from various railway components. It can be extended to other industries as well.
Four particle measurement devices were used under different test conditions. To investigate particle morphology, a field emission scanning electron microscope (FESEM) with energy dispersive spectroscopy (EDS) was used.
2. Airborne wear particle emission rate
There are different end results for the resulting wear debris from abrasive, erosive, fatigue, and adhesive wear:
- They can leave mating surfaces and transfer to the airborne.
- They can stick to the regions of the mating surfaces where it is not interacting with the wear process.
- They can stick to the regions of mating surfaces in the interacting wear process.
In the last case, wear debris has the potential to repeat the above scenario and contribute to the generation of particles.
Even though a schematic model is presented in [11] to show the generation of airborne particles, until this moment no mathematical model has been provided to consider all of the forces that may affect detached wear debris or particles. Abbasi [12] suggested that the particle characteristics, air properties, airflow conditions, surface forces and temperature on contacts are crucial factors in the process of transforming detached wear debris into airborne particles. He concluded the overall effects of affected forces on wear debris can result in fluidised particles converted into airborne particles.
This work was published in Wear (284/285) pages 18-29 in 2012. Online version: http://dx.doi.org/10.1016/j.wear.2012.01.016
As it is elaborated before some wear particles can become airborne during wear process. This property is referred to in this work as the airborne wear particle emission rate (AWPER).
AWPER is defined as the ratio of the mass of generated airborne particles (in mg) to the length of time (in h) two objects are sliding against each other under controlled conditions. The sliding velocity (in m s-1) and mean contact pressure (in MPa) between the two objects remain constant in those conditions.
The relation between the registered particles concentration and AWPER in a sealed box equipped with an inlet/outlet and constant airflow can be modelled as follows: the rate of change of airborne particle mass in the test box is the difference between the outlet particle flow rate and the airborne particle generation rate in the box. Since no other airborne particles can enter the sealed box, due to the 99.95% efficiency of the filter used. It can be assumed that the particle concentration at the outlet measurement point equals the concentration in the test box (Fig. 1). The mass balance for the airborne particles can then be formulated as follows:
= –qC + AWPER equation (1)
where
V = box volume (m3)
q = inlet airflow = outlet airflow (m3 h–1) C = concentration (mg m–3)
AWPER = airborne wear particle emission rate (mg h–1) By rewriting equation (1), the following is obtained:
+ C = equation (2)
Since AWPER and C are functions of time, while q and V are constant factors, the solution will be:
C = dt equation (3)
where C0 is strongly related to the initial dust concentration in the box (in mg m–3). Therefore, if
we know the function of AWPER(t) and the initial conditions are known, the concentration C at the outlet can be obtained. As airborne particles are generated from wear debris, AWPER must
Fig. 1 An illustration of a box model. q is the inlet and outlet airflow; the inlet concentration is zero and the oulet concentration is C(t); the airborne particle emission rate in the box is AWPER(t).
This work was published in Wear (284/285) pages 18-29 in 2012. Online version: http://dx.doi.org/10.1016/j.wear.2012.01.016
be influenced by the changes in the contact state and by the transitions between different wear mechanisms.
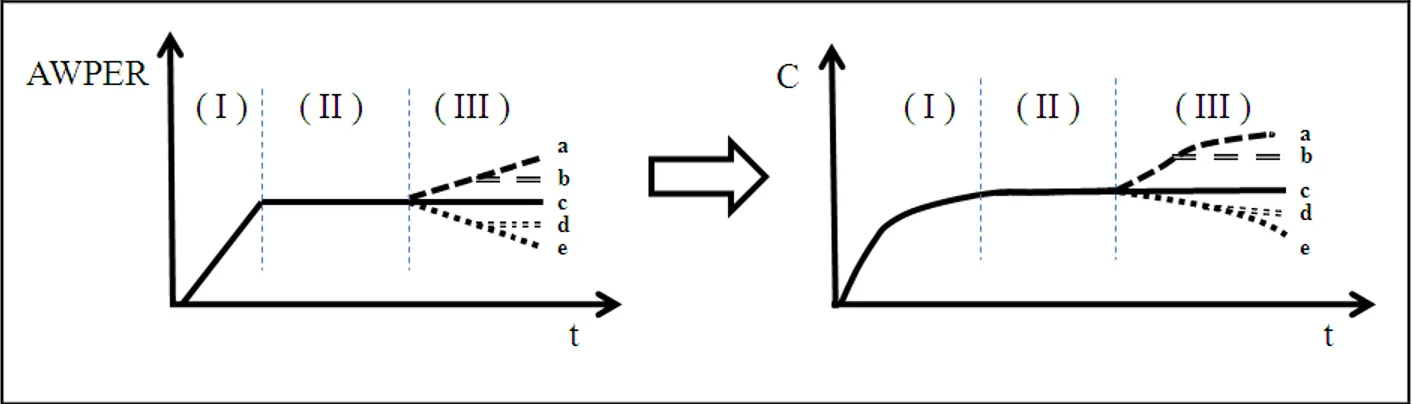
As presented in equation (3), the registered concentration, C(t), is not linearly proportional to AWPER(t); nevertheless, equation (3) indicates that the concentration can change exponentially. This is the main reason why, when the applied load or sliding velocity changes, the recorded particle concentration is not directly proportional to the change in the applied load or sliding velocity. Fig. 2 shows the responses to five benchmark cases with different AWPER. These cases can be used to reason about the concentrations measured during testing. The average value of AWPER, can be used to represent all these changes.
In the other words, if the concentration at the outlet for a predetermined period of time from the beginning of the test (before stopping the rotating disc) is measured and the average concentration over that period is then calculated, it is then possible to calculate an average value of AWPER, i.e., the mean wear airborne emission rate ( (Fig. 3).
Notably, is similar to the non-exhaust emission rate of road vehicles. Both factors have been defined under specific load conditions and at a constant sliding velocity, even though the unit of the latter is mg km–1. The concentration of particles size fractions such as PM10, PM2.5,
Fig. 3. An illustration of real measurement concentration, curve fitting and
This work was published in Wear (284/285) pages 18-29 in 2012. Online version: http://dx.doi.org/10.1016/j.wear.2012.01.016
PM1 can be defined and used for the generated particles as well which was not the considered in
this study.
3. Experimental set-up 3.1. Particle instruments
Four particle measurement instruments were used in this study. The main instrument was a GRIMM 1.109 aerosol spectrometer (hereafter “GRIMM”), which measured airborne particles 0.25–32 µm in diameter in 31 size intervals and at concentrations from 1 to 2 × 10⁶ particles L–1 [15]. This instrument registered number concentrations with a time resolution of 6 s. As GRIMM is an optical counter, its stated particle sizes are approximate and depend on particle shape and refractive index [16]. The second device was a TSI P-TRAK condensation nuclei particle counter, model 8525 (hereafter “P-TRAK”), which measured the number concentration of airborne particles 0.02–1 µm in diameter with no size resolution [17]. Number concentrations were registered with a time resolution of 1 s.
The third instrument was a TSI DustTrak photometer, model 8520 (hereafter “DustTrak”), which measured the mass concentration in mg m–3. This is a laser photometer and measures particle concentrations roughly corresponding to respirable size fractions; it registered mainly particles in the 0.1–10 µm diameter range. The instrument is factory calibrated using a test dust (with a density of 2650 kg m–3), the size distribution, density, and refractive index of which differ from those of the particles measured here. Though the results could be used only as relative measures, they were useful in describing the changes in generated particle mass over time [18].
The fourth instrument was a scanning mobility particle sizer (SMPS) combining an electrostatic classifier (TSI model 3071) with a particle counter (TSI CPC model 3010). The particles were charged in a controlled manner and thereafter sequentially classified according to their electrical mobility; electrical mobility was then transformed into corresponding particle sizes [19]. The particle counter was a condensation nuclei counter that, by means of condensation, optically counted particles down to 10 nm in diameter. The size distribution was divided into 110 size classes in the 10–520 nm range; number concentrations as low as a few particles per cm³ could be registered. The SMPS produced a particle number concentration size distribution every 5.5 min.
3.2. Test equipment
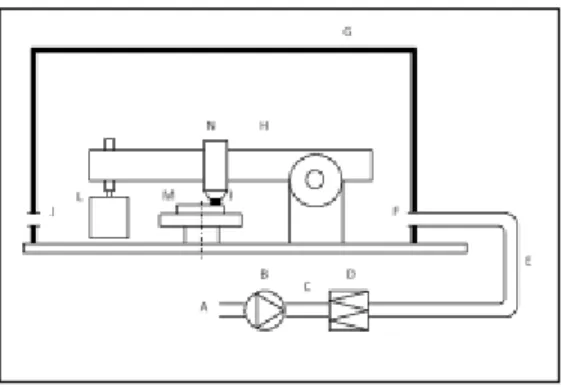
The laboratory tests were performed using a pin-on-disc machine equipped with a horizontal rotating disc and a dead-weight-loaded pin (Fig. 4); the entire set-up was mounted in a sealed box. The sealed box allowed us to control the cleanliness of the supply air and to sample air only containing wear particles.
This work was published in Wear (284/285) pages 18-29 in 2012. Online version: http://dx.doi.org/10.1016/j.wear.2012.01.016
The supply air was set to a flow rate of 7.7 m3 h–1 (2.1 L s–1). The sealed box volume was 0.135 m3, and the volume of the pin-on-disc machine was approximately 0.035 m3, giving an
approximate air exchange rate of 77 h–1, corresponding to a time constant of 47 s. The flow rate measurement system consisted of a straight calibrated tube equipped with separate connections for total and static pressure, measured using an ordinary U-tube manometer. The system was calibrated in the 2–50 m3 h–1 flow interval. The filter used to ascertain a particle-free inlet air was of class H13 (according to the EN 1822 standard) having a certified collection efficiency of 99.95% at maximum penetrating particle size (MPPS).
Two P-TRAK devices were used in this set-up, one connected to the sampling point at the inlet (F) and the other to the sampling point at the outlet (J).
This setup was previously used by Sundh et al. [10], Abbasi et al. [11], Olofsson et al. [20–21], and Wahlström et al. [22] to study the airborne particles generated from various materials under various test conditions.
During the tests, wear particles were collected from the box outlet air on filters. A volume of approximately 6 L of air was pumped through surface collecting filters (Nuclepore polycarbonate) with a pore size of 0.4 µm. The airborne wear particles collected on the filters were coated with gold and then analyzed using a FESEM with EDS.
The machine could run under stationary conditions with constant applied normal forces of up to 100 N and at constant rotational speeds of up to 3000 rpm. A load cell was used to measure the tangential force exerted on the pin.The fan (B) took the air from the room (A) and passed it into the chamber (G) via the flow measurement system (C), filter (D), and air inlet opening (F). The connections between the fan, measurement system, filter, and chamber were flexible tubes (E). The air in the sealed box (N) was well mixed due to the complicated volume of the pin-on-disc machine (H) and the high air exchange rate. This mixing was verified by registering particle concentrations from the box. The air in the sealed box transported the generated particles to the air outlet (J), where sampling points for the particle measurement devices were situated.
Fig. 4. Schematic of the test equipment.
A: Room air; B: Fan; C: Flow rate measurement; D: Filter; E: Flexible tube; F: Clean air inlet, measurement point; G: Sealed box; H: Pin-on-disc machine; I: Pin sample; J: Air outlet, measurement points; L: Dead weight; M: Rotating disc sample, N: Air inside chamber.
This work was published in Wear (284/285) pages 18-29 in 2012. Online version: http://dx.doi.org/10.1016/j.wear.2012.01.016
All disc samples were made from a wheel and a brake disc, while the pins were made from brake pads, and brake blocks. The 110-mm-diameter disc specimens were cut, using a water jet, from a railway wheel and a used piece of wheel-mounted steel brake disc from a Regina X54 train, while the 10-mm-diameter pins were sawn mechanically from a brake pad, a sintered brake pad, a cast-iron brake block, and an organic brake block.
Table 1 presents the specimen characteristics. Before testing, the disc specimens were cleaned ultrasonically for 20 min using both heptane and methanol. The test conditions are presented in Table 2.
3.3. Test conditions
Most of the selected test conditions are representing real operational situations. For example, the 12.4 m s–1 sliding velocity represented the X54 train travelling at 70 km h–1.
The whole system, including the pin-on-disc machine, was tested by starting all components simultaneously without any contact between the pin and disc. The measured particles concentration at the outlet became zero after 5–10 min, depending on earlier activity in the room and the box. Wear testing started after the concentration had reached zero. During the tests, the temperature was 20 ± 2°C and the relative humidity was 40 ± 5%. Two individual tests were run for each material combination.
Name Specimen Hardness Roughness(Ra)
Railway wheel (R7) Disc 270 HV 0.6 µm
Brake pad (Organic) Pin, Flat head - 9 µm Brake pad (Sintered) Pin, Flat head - 3 µm Brake block (Organic) Pin, Flat head - 1 µm Brake block (Cast iron) Pin, Flat head 270 HV 0.3 µm
Brake disc (Steel) Disc 320 HV 0.6 µm
Test
No. Pin material - Disc material Load (N) Sliding velocity (ms–1) pressure (Mpa) Mean contact
1A
Organic brake pad-Steel brake disc
60 12.4 0.87
1B 60 8.9 0.87
1C 20 12.4 0.55
1D 40 12.4 0.27
2A Sintered brake pad-Steel brake disc 60 12.4 0.87
2B 60 8.9 0.87
3A
Organic brake block-Railway wheel
60 12.4 0.87
3B 60 8.9 0.87
Table 1. The material characteristics of the test specimens.
This work was published in Wear (284/285) pages 18-29 in 2012. Online version: http://dx.doi.org/10.1016/j.wear.2012.01.016
4. Results
The effects of applying various loads, sliding velocities, and material combinations were investigated as specified in Table 2. Series of selected results obtained using P-TRAK, DustTrak, Grimm, and SMPS devices are presented in Figs. 5–12. Three particle size fractions were used, defined as follows: a coarse particle fraction comprising particles with diameters >1 µm, a fine particle fraction comprising particles with diameters between 100 nm and 1 µm, and an ultrafine particle fraction comprising particles with diameters <100 nm.
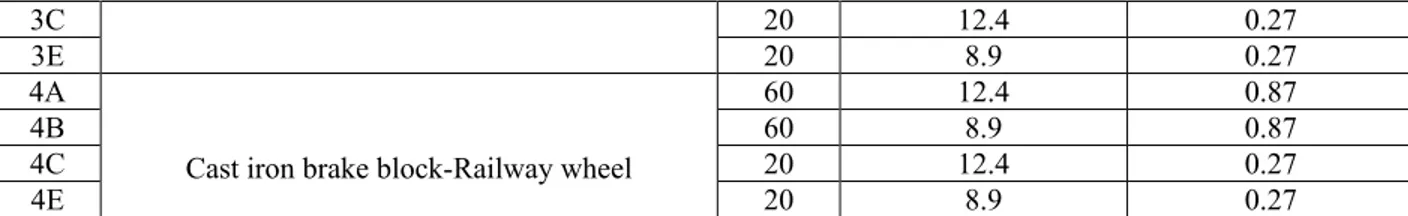
3C 20 12.4 0.27
3E 20 8.9 0.27
4A
Cast iron brake block-Railway wheel
60 12.4 0.87
4B 60 8.9 0.87
4C 20 12.4 0.27
4E 20 8.9 0.27
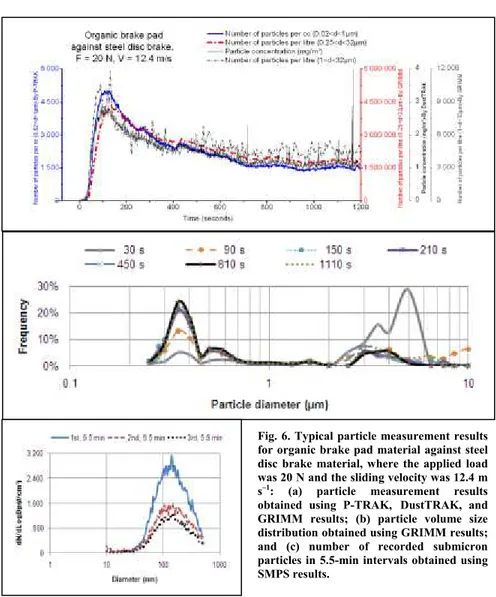
Fig. 5. Typical particle measurement results for organic brake pad material against steel disc brake material, where the applied load was 60 N and the sliding velocity was 12.4 m s–1: (a) particle
measurement results obtained using P-TRAK, DustP-TRAK, and GRIMM results; (b) particle volume size distribution obtained using GRIMM results; and (c) number of recorded submicron particles in 5.5-min intervals obtained using SMPS results.
This work was published in Wear (284/285) pages 18-29 in 2012. Online version: http://dx.doi.org/10.1016/j.wear.2012.01.016
Figs. 5–7 show the results associated with the particles generated from the organic brake pad material and the steel brake disc material using various loads and sliding velocities. A decrease in applied load (Fig. 6) or sliding velocity (Fig. 7) resulted in lower particle concentrations and lower number concentrations of ultrafine, fine, and coarse particles.
These results were reproduced in both test replicates and under the other test conditions. In Figs. 5(b), 6(b), and 7(b), the GRIMM volume size distributions have been calculated from number
Fig. 6. Typical particle measurement results for organic brake pad material against steel disc brake material, where the applied load was 20 N and the sliding velocity was 12.4 m s–1: (a) particle measurement results
obtained using P-TRAK, DustTRAK, and GRIMM results; (b) particle volume size distribution obtained using GRIMM results; and (c) number of recorded submicron particles in 5.5-min intervals obtained using SMPS results.
This work was published in Wear (284/285) pages 18-29 in 2012. Online version: http://dx.doi.org/10.1016/j.wear.2012.01.016
size distributions assuming a spherical particle shape. Under all test conditions, the submicron particle fraction increased with time, whereas the fraction of particles with diameters over 1 µm decreased. A peak at approximately 3–6 µm in diameter in the coarse region, two peaks at 300– 400 nm and 500–600 nm in the fine region (Figs. 5(b), 6(b), and 7(b)), and a peak at approximately 100 nm in the ultrafine region (Figs. 5(c), 6(c), and 7(c)) were recorded under all test conditions. Fig. 5(c) shows another peak in the fine region at a particle size of 280 nm.
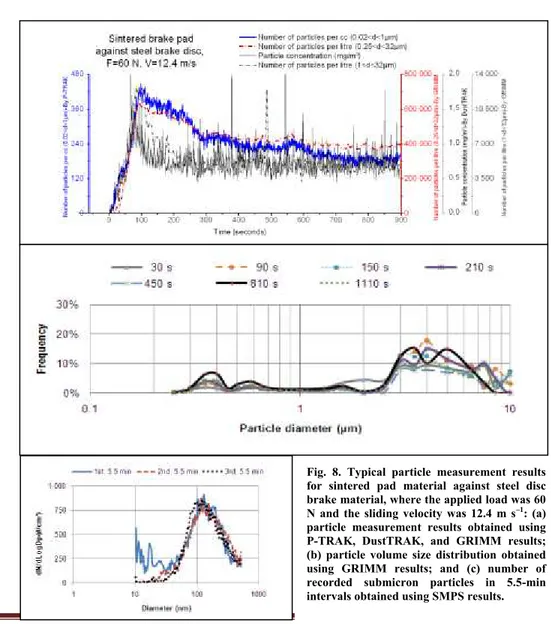
The concentration characteristics of the particles generated from the sintered brake pad material over time (Fig. 8) were akin to those from the organic brake pad material; however, the
Fig. 7. Typical particle measurement results for organic brake pad material against steel disc brake material, where the applied load was 60 N and the sliding velocity was 8.9 m s–1: (a) particle
measurement results obtained using P-TRAK, DustP-TRAK, and GRIMM results; (b) particle volume size distribution obtained using GRIMM results; and (c) number of recorded submicron particles in 5.5-min intervals obtained using SMPS results.
This work was published in Wear (284/285) pages 18-29 in 2012. Online version: http://dx.doi.org/10.1016/j.wear.2012.01.016
submicron particle fraction of the total recorded number of particles was significantly smaller than for the organic brake pad particles.
A peak at approximately 3–6 µm in diameter in the coarse region, two peaks at 300–400 nm and at 500–600 nm in the fine region, and a peak at approximately 100 nm in the ultrafine region were also recorded under all these test conditions. The applied load was 60 N and the sliding velocity was 12.4 ms–1.
Fig. 8. Typical particle measurement results for sintered pad material against steel disc brake material, where the applied load was 60 N and the sliding velocity was 12.4 m s–1: (a)
particle measurement results obtained using P-TRAK, DustTRAK, and GRIMM results; (b) particle volume size distribution obtained using GRIMM results; and (c) number of recorded submicron particles in 5.5-min intervals obtained using SMPS results.
This work was published in Wear (284/285) pages 18-29 in 2012. Online version: http://dx.doi.org/10.1016/j.wear.2012.01.016
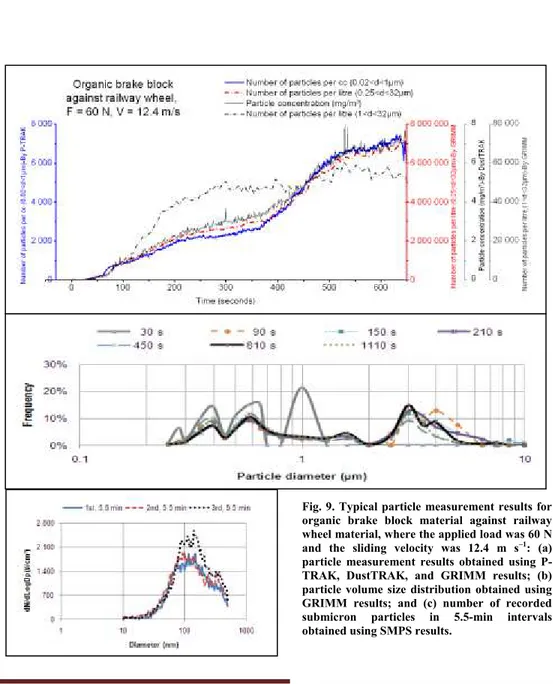
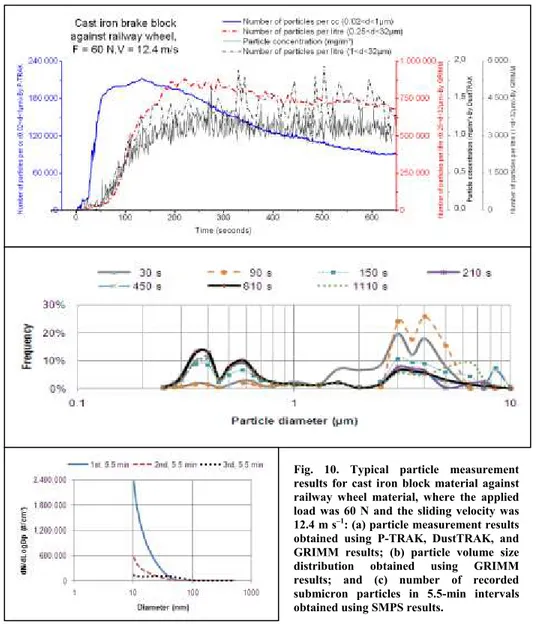
Fig. 9 presents the characteristics of particles generated from the organic brake block material against railway wheel material. Fig. 10 presents the corresponding characteristics of particles from cast iron brake block material. In both cases, the concentrations increase continuously from the start. For the organic brake block material, these trends continue, while the concentrations level off for the cast iron brake block material. For the latter, behaviour of the number concentrations of fine and ultrafine particles differ.
Fig. 9. Typical particle measurement results for organic brake block material against railway wheel material, where the applied load was 60 N and the sliding velocity was 12.4 m s–1: (a)
particle measurement results obtained using P-TRAK, DustP-TRAK, and GRIMM results; (b) particle volume size distribution obtained using GRIMM results; and (c) number of recorded submicron particles in 5.5-min intervals obtained using SMPS results.
This work was published in Wear (284/285) pages 18-29 in 2012. Online version: http://dx.doi.org/10.1016/j.wear.2012.01.016
According to Fig. 9(c), two peaks, at approximately 100 nm in the ultrafine region and at 300– 400 nm in the fine region, were recorded for organic brake block material. A peak in the ultrafine region at approximately 70 nm for cast iron brake block material seemed to appear during the third 5.5 min of measurement.
Figs. 9(b) and 10(b) show a peak at approximately 3–6 µm in the coarse region and peaks at approximately 300–400 nm and 500–600 nm in the fine region.
Fig. 10. Typical particle measurement results for cast iron block material against railway wheel material, where the applied load was 60 N and the sliding velocity was 12.4 m s–1: (a) particle measurement results
obtained using P-TRAK, DustTRAK, and GRIMM results; (b) particle volume size distribution obtained using GRIMM results; and (c) number of recorded submicron particles in 5.5-min intervals obtained using SMPS results.
This work was published in Wear (284/285) pages 18-29 in 2012. Online version: http://dx.doi.org/10.1016/j.wear.2012.01.016
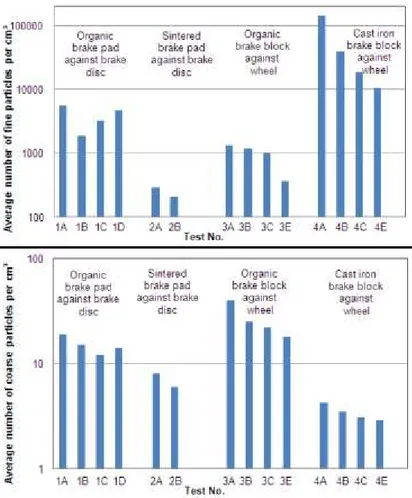
According to Figs. 5–10, the particle concentrations and volume size distributions remained fairly constant after 7200 m under all test conditions presented in Table 2. We summarize the average number concentrations of fine and coarse particles over this distance under all test conditions in Fig. 11.
Figs. 11(a) and 11(b) show that the number concentrations of both the fine and coarse fractions increase with sliding velocity and applied load, although the relationship is not linear.
According to Figs. 11(a) and 11(b), the particle number concentrations were lower in the sintered brake pad tests than in the organic brake pad tests. This result was obtained independent of size fraction and test conditions. However, quite different results were obtained from the brake block tests.
Fig. 11. Summary of the average number concentration in both the fine and coarse fractions over an equal sliding distance under all test conditions: (a) fine fraction particle number concentration for particles of 0.02–1 µm in diameter obtained using P-TRAK results; and (b) coarse fraction particle number concentration for particles of 1–32 µm in diameter obtained using P-TRAK results.
This work was published in Wear (284/285) pages 18-29 in 2012. Online version: http://dx.doi.org/10.1016/j.wear.2012.01.016
The fine particle fraction number concentrations obtained in the cast iron block tests were lower than those obtained in the organic brake block tests. In contrast, the coarse particle fraction number concentrations obtained in the cast iron block tests were lower than those obtained in the organic brake block tests.
Fig. 12. Typical images of particles collected on Nuclepore filters: (a) morphology of particles generated from organic brake pad material; (b) EDS results for particles generated from organic brake pad material; (c) morphology of particles generated from sintered brake pad material; (d) EDS results for particles generated from sintered brake pad material; (e) morphology of particles generated from organic brake block material; (f) EDS results for particles generated from organic brake block material; (g) morphology of particles generated from cast iron brake block material; and (h) EDS results for particles generated from cast iron brake block material.
This work was published in Wear (284/285) pages 18-29 in 2012. Online version: http://dx.doi.org/10.1016/j.wear.2012.01.016
The morphologies and elemental compositions of the particles collected on Nuclepore filters were investigated using a FESEM equipped with EDS. Fig. 12(a)–(h) shows the morphologies and spectroscopy results for typical particles from various sources.
Fig. 13 illustrates the results of for all different braking materials. These results were calculated for the first 600 s of each test. The sintered brake pads had the lowest value of
and the organic brake block had the highest value of
5. Discussion
The three suggested regions in Fig. 2 can be explained by real situations in the conducted laboratory tests and by similar pin-on-disc studies [10,11,20–22]. Regions (I) and (II) correspond to the running-in of a sliding contact. In region (I), AWPER increases from zero to a constant value, which marks the start of region (II). The time interval in this region is dependent on two factors: first, the time it takes to accelerate the disc to the target rotational speed and, second, the time it takes for a steady-state particle concentration to be reached in the sealed box. Region (II) ends when contact surface changes, such as flash temperature, oxidation, and tribochemical film formation, start to influence the wear process. Case (c) presents the situation in which AWPER remains constant. In this situation, the cumulative effect on AWPER of changes in the contact surface state is neutral, so AWPER remains constant. Cases (b) and (d) represent situations in which the cumulative effect of changes in the contact state affects the AWPER level. In case (b), this effect is positive and increases AWPER, while in case (d), AWPER decreases. However, the increase in case (b) is not infinite, and AWPER approaches a constant value after a short while. Cases (a) and (e) represent unstable situations in which the effect is unlimited. In case (a), it is
This work was published in Wear (284/285) pages 18-29 in 2012. Online version: http://dx.doi.org/10.1016/j.wear.2012.01.016
assumed that the AWPER keeps increasing linearly, resulting in an increase in the concentration. In contrast, in case (e), a linear decreasing rate is assumed, resulting in a decrease in the concentration.
At the beginning of all tests conducted in this and previous studies [10,11,22], the particle concentration suddenly increases, reflecting a burst of airborne wear particle emissions. This burst is followed by a decrease in emission and, in most tests, a levelling off (see Figs. 5(a),(c), 6(a),(c), 7(a),(c), 8(a),(c), and 10(a),(c)). These results are in agreement with the proposed model in cases (c) and (d). The results for the organic brake block material (see Figs. 9(a) and (c)) are exceptions. As depicted in Fig. 14, the particles generated from organic brake block material are more elongated; on the other hand, the amount of aluminium in this material is somewhat higher than in the brake pad material, whereas the amounts of antimony and copper are lower. According to Hutchings [1], particle composition and shape play crucial roles in determining the wear coefficient and hence directly affect the particle generation. Higher angularity in wear debris can increase the wear coefficient. In addition, the existence of more elongated particles among organic brake block particles can be used as an index to distinguish abrasive wear as the dominant wear mechanism [2]. Materials such as aluminium could cause higher abrasiveness, whereas materials such as copper and antimony compounds could reduce the wear rate. Materials such as alumina also follow the proposed model in cases (a) and (b). This result is also evident from the decreasing rate of generated particles greater than 1 μm in diameter and from the particle concentration results (see Figs. 5(a), 6(a), 7(a), 8(a), and 10(a)). Except for particles generated from the organic brake block material, the volume size distributions of particles increase in the submicron particle fraction (see Figs. 5(b), 6(b), 7(b), 8(b), and 10(b)). The increasing fraction of submicron particles might be explained by increasing temperature and the pulverizing of particles stuck to the disc. However, a decrease in the submicron particle fraction for organic brake block material is seen, whereas the coarse particle fraction does not change markedly (Fig. 9(b)). The effects of the presence of more abrasive braking material on particle characteristics were also studied by Wahlström et al. [22]. They compared the particle concentrations in low-metalic (LM) brake pads, which wore at a higher rate than did in non-asbestos organic (NAO) brake pads. According to their report, the particle concentrations in LM brake pads increased continuously, whereas the particle concentrations reached a constant value in NAO brake pads. Further study is needed to determine the wear rate and investigate the mode of transition from mild to severe wear in such contacts.
Thuresson reported a higher average wear coefficient for organic brake block material than for cast iron brake block material [23]. His tests were conducted in a test rig mounted with a sample of railway wheel. He reported a higher average wear rate in the organic brake block material, in line with the current results, according to which higher particle concentrations are reported for organic brake block material.
The exponential decrease in concentration observed is similar to that occurring at the end of tests reported by Sundh et al. [10] and Wahlström et al. [22], in which the disc reduced its rotating speed until it became stationary.
Nearly all of the submicron particles were spherical, a characteristic that was independent of the test conditions. Fig. 12(c), (e), (g), and (i) depict some of these spherically shaped particles. This phenomenon can be explained by the high temperature on the asperity tips [1] and high
surface-This work was published in Wear (284/285) pages 18-29 in 2012. Online version: http://dx.doi.org/10.1016/j.wear.2012.01.016
to-volume ratio in submicron particles, which facilitates rapid heat transfer and may cause particle melting, in whole or in part. Such melting can lead to spherical or semi-spherical particles.
Most coarse particles generated from the brake pad and brake block materials were ellipsoid in shape, whereas most of the coarse particles from railway wheel and rail materials were flake shaped with sharp edges. Elongated wear particles were dominant in number among the particles generated from the organic brake pad material, while rounded particles were dominant in number for the other samples. These characteristics are attributable to the different wear modes occurring among different pairs of materials. In brake materials, abrasive and adhesive wear modes are dominant, whereas in wheel and rail materials, fatigue and delamination modes are the dominant wear mechanisms.
Several studies [6–8] report a similar dominant peak range in the coarse particle fraction. The dominant peak range in the fine particle fraction, which is reported to be 300–400 nm, is in line with field results presented by Abbasi et al. [8] and Fridell et al. [9]. These results were obtained by making stationary measurements in subways, except for studies in [8–9], who made on-board measurements in a train running aboveground, the particle size distribution being recorded during braking.
Based on field studies in three locations, Gustafsson [7] reports that the maximum frequencies of fine particles occur in three ranges, i.e., 10–20 nm, 20–50 nm, and 60–80 nm, which are higher than the values we obtained. In all three locations Gustafsson studied, the diesel locomotives did not use the main rail line; however, detailed information about the techniques used for measurement and to eliminate other possible particle sources was not mentioned [7].
The typical values of depicted in Fig. 13 confirm that the proposed index can be obtained in real cases. However, those values are calculated based on the proposed test conditions, test setup, and selection of the first 600 s of sliding time. Any changes in those factors can affect the magnitude of calculated
6. Conclusions
The following general conclusions can be made based on an analysis of the test results:
- A relationship between increased sliding velocity and increased particle concentrations was detected in the wear processes occurring in the braking materials.
- A relationship between increased contact pressure and increased particle concentrations was detected in the wear processes occurring in the braking materials.
- The rate of ultrafine particle emission from cast iron brake block material was significantly higher than from the organic brake block material.
- The rate of fine and ultrafine particle emission from the sintered brake pad material was significantly lower than the emission rate of the same-sized particles from the organic brake pad
This work was published in Wear (284/285) pages 18-29 in 2012. Online version: http://dx.doi.org/10.1016/j.wear.2012.01.016
material under similar test conditions. There were negligible differences in coarse particle emissions between different pad materials.
- Three particle size regimes were identified:
In the ultrafine particle region, a peak occurred at diameters of approximately 70–120 nm In the fine particle region, two peaks occurred at diameters of 300–400 and 500–600 nm In the coarse particle region, a peak occurred at diameters of approximately 3–6 µm. The fraction of this peak is highly dependent on material composition and test conditions. - A new index, airborne wear particle emission rate (AWPER), was introduced; this index is suggested to be used as a comparative index for non-exhaust emissions.
7. Acknowledgments
This research was performed under the auspices of the Railway Group at Royal Institute of Technology (KTH), Stockholm, Sweden. The author acknowledges valuable assistance from Dr. Wubeshet Sahle and Mr. Peter Carlsson at KTH.
References
[1] I.M. Hutchings, Tribology: Friction and Wear of Engineering Materials, Edward Arnold, Cambridge, UK, 1992.
[2] G.W. Stachowiak, G.P. Stachowiak, P. Posidalo, Automated classification of wear particles based on their surface texture and shape features, Tribology International 41 (2008) 34–43. [3] P. G. Boulter, A review of emission factors and models for road vehicle non-exhaust particulate matter, PPR065 Project, TRL limited, UK. 2005. Online <
http://uk-air.defra.gov.uk/reports/cat15/0706061624_Report1__Review_of_Emission_Factors.PDF >
[4] UK emission inventory team, AEA Group, UK informative inventory report (1980 – 2009), 2011 Online <http://uk-air.defra.gov.uk/reports/cat07/1103150849_UK_2011_CLRTAP_IIR.pdf> [5] ANONYMOUS, Hygienische Forderungen für Untergrundbahnen. Internationale Wochenschrift für Wissenschaft, Kunst und Technik 38 (1909) 1205–1208.
[6] I. Salma, Air pollution in underground railway systems, in: R.E. Hester, R.M. Harisson (Eds.), Air Quality in Urban Environments, Royal Society of Chemistry, Cambridge, UK, 2009, pp. 65–85.
This work was published in Wear (284/285) pages 18-29 in 2012. Online version: http://dx.doi.org/10.1016/j.wear.2012.01.016
[7] M. Gustafsson, Airborne particles from the wheel–rail contact, in: R. Lewis, U. Olofsson (Eds.), Wheel–Rail Interface Handbook, CRC Press, USA, 2009, pp. 550–575.
[8] S. Abbasi, L. Olander, U. Olofsson, C. Larsson, A. Jansson, U. Sellgren, A field test study of airborne wear particles from a running regional train, Journal of Rail and Rapid Transit, 2011, In press
[9] E. Fridell, M. Ferm, A. Björk, A. Ekberg, On-board measurement of particulate matter emissions from a passenger train. Journal of Rail and Rapid Transit, 225 (2011), 99-106. [10] J. Sundh, U. Olofsson, L. Olander, A. Jansson, Wear rate testing in relation to airborne particles generated in wheel–rail contact, Journal of Lubrication Science 21 (2009) 135–150. [11] S. Abbasi, L. Olander, U. Olofsson, J. Wahlström, C. Larsson, U. Sellgren, A study of airborne wear particles generated from organic railway brake pads and brake discs, Wear, 273 (2011) 93– 99
[12] S. Abbasi, Characterisation of airborne particles from rail traffic, Licenciate thesis, Royal Institute of Technology (KTH), Stockholm, Sweden, 2011.
[13] http://delphi.com/pdf/emissions/Delphi-Passenger-Car-Light-Duty-Truck-Emissions-Brochure-2010-2011.pdf
[14] http://ec.europa.eu/environment/air/transport/road.htm
[15] T. Peters, D. Ott, P.T. Shaughnessy, Comparison of the Grimm 1.108 and 1.109 portable aerosol spectrometer to the TSI 3321 aerodynamic particle sizer for dry particles, Annals of Occupational Hygiene 50 (2006) 843–850.
[16] Y. Liu, P.H. Daum, The effect of refractive index on size distribution and light scattering coefficient derived from optical particle counters, Journal of Aerosol Science 31 (8) (2000) 945– 957.
[17] Y. Zhu, N. Yu, T. Kuhn, W.C. Hinds, Field comparison of P-Trak and condensation particle counters, Journal of Aerosol Science 40 (2006) 422–430.
[18] Y.H. Cheng, Comparison of the TSI model 8520 and Grimm Series 1.108 portable aerosol instruments used to monitor particulate matter in an iron foundry, Journal of Occupational and Environmental Hygiene 5 (3) (2008) 157–168.
[19] H.J. Fissan, C. Helsper, H.J. Thielen, Determination of particle size distribution by means of an electrostatic classifier, Journal of Aerosol Science 14 (1983) 354–359.
[20] U. Olofsson, L. Olander, A. Jansson, Airborne wear particles generated from a sliding contact, Journal of Tribology 131 (2009) 044503-(1-4).
[21] U. Olofsson, A study of airborne wear particles generated from the train traffic: block braking simulation in a pin-on-disc machine, Wear 271 (2011) 86-91 .
This work was published in Wear (284/285) pages 18-29 in 2012. Online version: http://dx.doi.org/10.1016/j.wear.2012.01.016
[22] J. Wahlström, L. Olander, U. Olofsson, A. Söderberg, A pin-on-disc simulation of airborne wear particles from disc brakes, Wear 268 (5–6) (2010) 763–769.
[23] D. Thuresson, Thermomechanic of block brakes, Ph.D. thesis, Chalmers University of Technology, Göteborg, Sweden, 2006.