M.
F.
c ...
zz~:.z
____ _
Cop_y;
No,
---~
. .··
-~
(
r
"--··.
(
WIN-83 Metallurgy-~w Materials' ~ 1-T.OPICAL REPORT WIN-83
ALKALINE LEACH RESIN-IN-PULP PILOT PLAN'T TESTIN'G OF MONUMENT VALLEY ORE
By
W. D. Charle.s and R. L. Shimmin
June 1, 1958 ·
w.
D. Charles Manager12L~
R. L. Shimmin '~K~
C. K. McArthur Technical DirectorU. S. Atomic Energy Commission Contract N'o. AT(49-6)-924
National Lead Company, Inc. Raw Materials Development .Laboratory
( ( . h __
c
(
ABSTRACT W:IN-83 2-During the period of November 27, 1955 ttirough January 31, 1956, various. -portions of the Monument Valley ore, Monticello Stockpile 46, were treated in the Alkaline Leach Resin-In-Pulp ;pilot Plant a.t
Grand Junction, Colorado, to study ion exchange characteristics with a low u.ranium .to vanadium ratio in the icin exchange fe·ed. The uranium to vanadium conc·entrations were s.uch that a ratio as low as 1.5:1 was attained with no detrimental effect on the ion exchange characteristics. The report contains detailed information on grinding, leaching, sand-slime separation, ion exchange, and precipitation as related to the processing of this ore.
c
TABLE OF CONTENTSINTIWDUCTION
SUMMARYFLOWSHEET DESCRIPTION
A• Grinding R. LeachingC. Mill Solution Make,.up
D. Sand-Slime Separation
E. Res:in-In-Pulp
F. Precipitation and Eluant Make~up
C~
TEsT WoRKA, Grinding
B. Leaching
C. Mill Solution Make-up
D.• Sa:nd -slime Separation
E, Resin Adsorption
F. Elution and Precipitation
METALLURGICAL BALANCE · A?PENDIX
(
WIN~83 ~ 3 -4 5 7 7 7 7 9 9 10 1414
17
18c
c
(
INTRODUCTION WIN-834
-Monument Valley ore, Monticello Stockpile 46, was treated in the Alkaline Leach Resit)-In~Pulp Pilot Plant at Grand Junction, Colorado', at the request of the Raw Ma.teria:ls Division of the Atomic Energy Commission. The test program was from November 27, 1955 to January
·31,
1956. Purpose of the run was to determine tlie effect, if any, ofoperating with an ion exchange feed having a uranium to vanadium ratio of approximately 1:1. The amenability of Monument Valley ore to the .Alkaline Leach RIP process was also investigated.c
c
(
SUMMARY
From November 27, 1955 through January 31, 1956, an amenability test was conducted on Monument ·valley pre in the Alkaline Leach Resin-In-Pulp Pilot Plant. Various portions of the Monument Valley Btockpile were treated in .an attempt to achieve a low uranium to vanadium ratio in the ion exchange feed, in the range .of 1:1. This
ratio wa:s not '~~ot.t.ained; however, the uran.ium to vanadium
concen-trations were such that a ratio as low as 1.5:1 was attained with no detrimental effect on the ion exchange characteristics. The
adjus.tment of the ion exchange feed pH .to a range of 10.8 J:.o 11.1
did not prevent the adsorption of vanadium but successfully shifted
the adsorption equilibrium to favor the preferential loading of uranium.
With the feed to the circuit averaging 0.239% U30a and 0.837% v 2
o
5 ,grinding conditions were adjusted to produce a class.ifier overflow pulp averaging 18.2 per cent solids which contained 25.4 per cent plus 100-mesh and 49.8 per cent minus-200 mesh material. The ball mill thickener operated effectively with an average underflow density of 1.49 (48.8 per cent solids) and required 0.09 lb of flocculent/ton of ore. With an average leach contact time of 43 hours, a .temperature of 90°C, a pulp density of 1.49, and aeration air added for oxidation, uranium and vanadium leach extractions were 96.3 and 25.0 per cent;, respectively. Decreasing the
tempera-ture to 80°C had essentially no effect on uranium extraction; however, there was a slight decrease in vanadium extraction.
Reagent requirements for mill solution make-up based on inventory
figures were 64.4 lb Na2
cn
3 and 17.5 lb NaHC03 per ton of ore. Thereagent recovery system was not used during the test.
The sand-slime separation circuit rejected approximately 58 per
cent of the total mill feed solids as sands with a solution averaging
0.037 g U30a/l. This represented a soluble loss of 0.38 per cent
.of the uranium in the mill feed. Water requirements were 0.66 gpm/tpd
to maintain an ion exchange feed.densi'ty .<>f 1.05.
Caustic requirements for pH adjustment of the ion exchange feed were 9 lb/ton of .ore. During a period from January 3 through January 15 hydrated lime was added to the ion exchange feed for pH adjustment and found to have no effect on ion exchange recovery; however, 4.0
per cent of the
u
3o
8 in solution was precipitating in .the sand-slimecircuit due to localized high pH values and reported in the washed sands. Lime requirements under these conditions were 15 lb/ton of or·e.
c
c
WIN-83
6
-With an average ion exchange feed assay of 0.56 g U308 and 0.27
g
v
2o5 per liter, the RIP circuit was operated successfully at anintended resin loading of 3.4 lb
u
3o8/cu ft WSR.!/
The ion exchangecircuit was operated at a solution to resin ratio of 6:1 with seven banks on exhaustion and five .on elutlon. The average change,- over time was 4.9 hours and a recovery of 98.7 per cent was realized.
Elutions were made with 1 ~ NaCl and the pregnant eluate
precip-itated by the acidification-n~utralization procedure. Pregnant
eluates averaged 9.88 g
u
3o8/l and reagent requirements were6.12 lb NaCl, 1.40 lb H2so4 , and 0.31 lb MgO per pound of
u
3o8produced. The final product averaged 70.2%
u
3o8 and 1.46% V205.The calculated over-all uranium recovery amounted to 92.9 per cent while the actual recovery based on barrel weights and assays was 90.2 per cent resulting in an unaccountable loss of 2.7 per cent. Only 0. 5 per cent of the total V 2o5 in the mill feed reported in the final product.
c
.FLQWSHEET DESCRil'TION
WIN~83
7
-A description of the flowsheet and process equipment us.ed in the Alkaline Rll' 1/ Pilot Plant ha& been reported previously. 2/ The. flowsheet-is shown in Figure 1 and the process is desc'i="ibed briefly as follows:
A. Grinding
Ore received from the Feed Preparation Plant is minus 3/16-in. and is fed to a 24 x 18-in. ball '!'ill in closed circuit with a 12-in. Dorr rake classifier. Mill solution is added from a steady-head tank to maintain the pulp at the desired density for grinding.
The classifier overflow is pumped to a 12 x 8-ft thickener. The thickener overflow returns to the mill solution make-up tank which is feeding the circuit.
( B. Leaching
The underflow from the ball mill thickener goes directly to the leach circuit which consists of two 5 x 5-ft and three ~ x 4~-ft
tanks arranged in series. The tanks are insulated with Fiberglas and the pulp is heated with steam coils. Agitation is provided by a variety of high speed impellers and pulp flow from tarik to
tank is by gravity. Provisions are made to add water to mill
solution at five points to make up for evaporation losses. Aeration air is. introduced into each tank through two pipes which discharge on opposite sides of the tank at impeller height and a chemical oxidant, if needed, is added by hand to the tanks.
c. Mill Solution Make-up
Make-up of depleted mill s.olution is. a batch operation using two 10 x Bjif.t. tanks. When the tank which is receiving the overflow from the grinding circuit thickener is full, it is sampled and dry Na2co3 and NaHC03 are added to bring the s.olution up to leaching strength. It is then put on stream feeding the circuit while the second tank is filled.
1/ Resin-In~)?ulp
'i_!
Topical Report WIN-ll, Preliminary Pilot Plant Testing of ,Resin-In-Pulp Ion Exchange of Alkaline Leach Pulps, byORE GRINDING
m1·~t·~·~~·~U·~J·~· ~
ADSORPTION SLI ES (To TailinGI) ION EXCHANGE*WHEN REQUIRED Figure I
ALKALINE LEACH RIP PROCESS
DESANDING YEl-LOWCAKE PRECIPITATION :0:
'!;;!
CX>I (X)'"'
c
D. Sand-Slime Separation
WIN-83
9
-The sand-slime separation circuit consists of four rubber-covered Esperanza-type drag classifiers, the first with 10-in. flights and the other three 4-in., and two 2-in. Dorrclones connected in series. A surge tank between the discharge of the second Dorrclone and the RIP cells helps to prevent surging of the ion exchange feed.
Underflow from the grinding circu~t thickener is pumped with overflow
from the first drag classifier to the first Dorrclone. The underflow
from this cone discharges into the first classifier and the overflow is the feed for the second cone. Underflow from the second cone dis-charges, into the second classifier and the cone overflow is ion
exchange feed. Sodium hydroxide is added to the overflow from the
first cone to raise the pH of the ion exchange from 10.0 to the range of 10.8 to 11.1. Water is added to the last classifier and the sands are washed countercurrently and discharged to tails. The sand-slime separation circuit is operated to produce a minus 325-mesh
slime product of an average density of 1.05.
l/
c·J
-E. Resin-In-Pulp UnitsThe ion exchange circuit consists of 14 one-cell units or banks arranged in a cascading system with provisions made for pumping back to the first bank. Each bank contains one 17-in. basket which holds 1.1 cubic foot of wet settled resin. The baskets move up and down at the rate of ten 6;-in. s.trokes per minute while pulp or solution flows through the bank.
In general, seven banks are on the loading or adsorption cycle, six are on elution, and one bank is being prepared for the next adsorption cycle. The dilute slime product from the sand-slime separation
circuit is the ion exchange feed and is fed to the first bank on adsorption. When the resin in this bank has been given sufficient time to reach an.intended U308 loading, the feed is advanced to the next bank and the pulp in the loaded bank is returned to the
ion exchange feed surge tank. The spare bank then becomes the
last bank on adsorption. Pulp from the last bank on adsorption
goes to tailings. The loaded bank which was removed from the adsorption cycle is washed free of pulp and becomes the last bank on elution. At this time, the eluate in the lead bank previously removed from the head of the elution circuit is pumped to the next bank _on elution and, hence, through the circuit. This is then followed by a volume of made-up eluant. Displaced pregnant eluate from the sixth, or last, bank on elution goes to precipitation.
c
\
WIN-83
10
-Although the resin remains fixed within· any one basket, the manner in which solution or pulp is advanced from bank to bank produces a countercurrent effect. Changeover time, or the time a bank is in any one relative position, is calculated from the feed rate and uranium content of the ion exchange feed and from the desired or possible resin capacity.
F. Precipitation and Eluant Make-up
Although various precipitation and eluant make-up procedures are available, the H2S.04 -MgO procedure is commonly utilized.
Pregnant eluate is s.tored in one of two 5 x 41J;-ft stainless steel tanks in 500 gallon batches. !1ixing is by slow-sweep agitators. The uranium is precipitated as. follows: (1) sulfuric acid is added to pH 2.5 to 3.0 and the s.olution is heated to SO"C to drive off· CO~ and (2) the pH is raised to 7.0 by adding MgQ. The resultant ·precip1tate is filtered in a plate and frame filter press and the
filtrate .is discarded. The filter cake is washed with water and the wash liquor is returned to one of two 6 x 6-ft tanks for eluate make-up to 1
!i
NaCl. The yellow cake is dried, sampled, barreled, and shipped.(
·~ '-c
TEST WORK WIN:-83 11-The flowsheet shown in Figure 1 was used during the treatment of Monument Valley ore, A sunnnary of operational data obtained during
this alkaline RIP amenability test is presented in Table L A
total of 206.58 dry tons of ore was processed at a rate of 3.89
tons per day; During 1273 .8 hours of operation, the leach extraction
varied from 91.5 to 96.5 per cent and averaged 95.4 per cent,
Altho'ugh ion exchange adsorption data for the run averaged 98,6 per· cent, recovery was over 99 per cent a large portion of the time,
A. Grinding
The minus 3/16-in. crushed ore, which had an average assay of
0.239'-
u
3o
8 and 0.837% V205 , was fed to the ball mill and wasground in mill solution which contained 40 g Na2C03 and 10 g NaHC03 per liter, Daily belt feed data are presented in Appendix Table 1. Leaching solution was added to the ball mill discharge to control the density in the classifier overflow at 1.18, or 18.2 per cent
solids, for the entir~e run, Under these conditions, the classifier
overflow solids averagecl 25.4 per cent plus 100-mesh and 49.8 per cent minus 200-mesh·material.
The ball mill thickener operated effectively with an average under£low density of 1.49 .£1.8.8 per cent solids) and a flowrate
of 0.81 gpm. Separan 26l~addition for flocculation of the pulp
was 0 .087 lb/ton of ore. Daily grinding and ball mill thickener
data are included in Appendix Table 2. Daily flow data are presented
in Appendix Table 3 ..
B. Leaching
Average leach constants for the run consisted of a 43-hour residence time at a pulp density of 1.49 (48.8 per cent solids) with aeration air added for oxidation: Daily leaching data are shown in Appendix Table 4. During the periocl from November 27 through December 21,
the leach temperature in the Alkaline RIP Plant was 90°C, On
December 22, the temperature was decreased to 80°C in order to determine the effect of a somewhat lower temperature on extraction .in the leach circuit. Uranium and vanadium leach gradients were
taken under both condition~ and the data are shown in Table IL
The amount of water required for make-up of evaporation losses in the leach tanks was 1"5 tol)s per ton of feed at 90°C .as compared to 0.72 ton per ton of feeq at 80°C.
1/
The use of Separan 2610 does not constitute an endorsement ofc
c
Table I
Sunnnary of Pilot Plant Data Alkaline Leach - RIP Pil.ot Plant
Monument Valley Ore Grinding ·and Leaching
Total dry tons milled
Ore feed rate, dry tons/24 hr Hours of operation
Leach contact time, hr Ore feed assay,
%
U303%
v2o5 Leach concentration, g/11./
Na2co3 NaHC03 Residue assay, % U303
%
v2os Leach ext' n, '7. U 3o8%
v2o5 Sand-Slime SeparationSand tails solution assay, g U303/l Soluble loss, %of U308 in feed Adsorption Feed, density gpm gpm/ton/day g
u
3o
811 gv
2o
511 g Na2co
3 /l g NaHC03/l Tails, g U303/l Recovery,%
U303 ElutionEluate volume to precipitation, gal/cu ft resin Pregnant eluate assay, g
u
3o8 /lPrecipitation
Press filtrate, Water washes, g
1./
No. 5 leach tank dischargeWlN-83 12 -206.58 3.89 127 3.8 43.0 0.239 0.837 33.50 10.94 0.011 0. 716 95.41 14.50 0.037 0.38 1.05 2.51 0.65 0.56 0.27 10.90 1.03 0.007 98.6 36.6 9.88 0.004 0.050
Sample
c
Belt feed BMCO Thickener Leach tank 1 2 3 4 5 Belt feed BMCO Thickener Leach tank 1 2 3 4 5(
Table II Leach Data Alkaline Leach - RIP PilotMonument Valley Ore Leach Tempe.rature, 9o•c
Plant
WIN.~83
13
-Date: December 20, 1955
. Solids Assax2
%
%
Extraction!!A
Y2.Qs.
!!3.Qa.
vzos
.294 1.16 .245 1.07 1.7 7.8 .1n 0.97 39.8 16.4 .042 0.89 85.7 23.3 .019 0.87 93.5 25.0 .014 0.86 95.2 25.9 .012 0.83 95.8 28.4 .011 0.87 96.3 25.0 Leach Temperature, 80"c .Date: January 8, 1956 .284 1.06 .231 1.01 1.9 3.8 .189 0.84 33.4 20.0 .037 0.82 83.4 22.7 .019 0.82 93.3 22.7 .013 0.85 95.3 19.8 .012 0.88 95.7 17.0 .011 0.96(?) 96.2 9.4
(.
c
(
WIN-.8) 14
-The data indicate that through the leaching circuit, decreasing the temperature to 80°C had essentially no e.ffect on uranium extraction. However, there is a slight decrease in vanadium extraction with this 10" reduction in leach temperature.
C. Mill Solution Make-up
Daily mill solution make-up data are shown in Table III. Con-sidering Na2C.03 and NaHC03 requirements to fill the circuit and the i.nventciry at the end .of the run, reagent use based on a runni.ng inventory was 64.4 lb NazC03 and 17.5 lb NaHG03 per t(ln of ore.
D. Sand-Slime Separation
The sand-slime circuit rejected an average of 2.26 tons of dry solids per day to tails at approximately 74 per cent solids.
A tot.al of 0.86 tons of solution assaying 0.037 g
u
3o
8 /l was sentto tails during the same period. This represented a soluble loss
of 0.36 per cent of the uranium in the mill feed. Daily drag
sands data are found in Appendix Table 5.
The data shaw that 41.8 per cent of the total solids which entered the Alkaline Pilot Plant was sent to the i.on exchange circuit. This necessitated a water addition of 2.56 gpm or 0.66 gallons per minute per ton of ore per day to. maintain an ion exchange feed density of 1.05 and resulted in a 15.2:1 water to solids ratio in the ion .exchange feed.
During the period from January 3 through January 14, pH adjustmll!nt of the ion exchange feed was accomplished with hydrated lime
instead of caustic. The lime w.as added as a dry powder to the overflow of No. 1 drag classifier. llaily ion exchange data, presented in Appendix Tables 6 and 7, show that the use of lime
had no apparent effect on ion exchange.recovery based on solutio.n assays. Lime requirements were approximately 15 pounds per ton of ore treated as compared to 9 pounds NaOH per ton when using
caustic for pH adjustment. The discharge of No. 5 leach tank,
No.. 4 drag sands, and the ion exchange ta.ils were sampled period-ically and the solids assayed during the lime addition. The data
obtained are presented in Table IV. A similar sampling program
was initiated during the last two weeks ol;.the run while using caustic for pH adjustment. Solids assays during this period "+e
presented in T.able V. The data indicate that approximately 4.
p
per cent .of the U308 in so.lution was precipitating when hydrat,ad lime was used for pH adjustment. There was no evidence that
caustic addition had a similar effect. Precipitation of dis<';qlved
u
3o
8 was probable due to localized high pH value.s near the :;urfaceof sniall CaO particles. This localized pH effect might be minimized in future aperatio.ns if lime were added as a smooth slake at approxi• mately 20 per cent s.olids ins.tead of as a dry powder.
c
c
Table III
Daily Mill Solution Make-up Data
.Alkaline .Leach - RIP Pilot l'lan.t
Monument Valley Ore
Malte-up
WIN-83
.~ 15 "
Date Make-up Rea!!ient2 lb .Concentrati.on 2 !!iLl
1955 - 56 No. Na2co3 NaHC03 Na2
co
3 NaHC0311/27 1 1385.0 350.5 38.9 11.8 11/28 2 366.0 168.0 37.5 9.1 12/3 3 1375.0 347.0 42.5 8.9 12/11 4 1323.0 341.5 33.7 11.6 12/15 5 1337.0 275.0 30 .. 6 14.8 12/19 6 1400.0 650.0 33.6 10.2 12/21 7 1309.0 312.0 30.8 11.3 12/28 8 1247.0 281.3 30.4 9.7 1/6 9 1313.0 312.0 45.8 13.0 1/11 10 1010.3 345.5 29.2 10.1 1/15 11 1310.0 302.0 27.8 11.8 1/20 12 1284.0 268.0 25.9 12.7 Avg 33.9 11.2 Total 14659.3 3952.8 Inventory, 1/31/56 1355.6 337.6 Total reagents used, lb 13303.7 3615.2 lb/ton 64.4 17.5
(
c
(
1956
l2!!.:!&
1/5
1/6
1/7
1/6
1/9
1/10
1/11
Table
IVWIN-63
16
-Uranium in Leached Solids Using Lime for pH Adjustment
Alkaline Leach - RIP Pilot Plant
Monument Valley Ore
Lime
Overflmr
Steady
Add
1n
~!!;308 in So;!,ids
Ho.
l
llJ:ag
~adIAnk !,b,LTon
No,
2
I..
I•
Dl;:ag SAnds
\
10,92
n.01
19.2
,010
,009
10,95
10.96
12.0
,010
,010
n.oo
10.96
13.7
.on
.010
n,20
10.92
15.6
.on
,010
10,96
10.92
19.6
,012
n,20
10,97
13.7
.on
.010
n,lO
10.92
16,7
,012
,010
Avg
.on
,ow
Weighted Avg
,021
Ia:t!le
Y.
~:J:ails
.046
•042
.056
.040
.036
,036
,Oil!~Uranium in Leached Solids Using Caustic for pH Adjustment
Alkaline I.each - RIP Pilot Plant
Monument Valley Ore
H
NaOH
1956
Overflmr
Steady
Add'n
$
ll~06in Solids
Date
No, 1 Drag
Head :J:ank Lb,LTon No, 5 L,:J:. Drag Sands IX Tails
1/23
10,12
10.92
9.3
.013
.on
.027
1/24
10.12
10.91
9.5
.on
,007
.026
1/25
10.13
10.90
10,3
.010
,006
.024
1/26
10,15
10.65
n.l
,010
.007
,025
1/27
10.12
10.90
10,9
.on
,006
,025
1/26
10,10
10,60
n.9
.010
.007
,0231/29
10.40
.
10.96
7.3
,010
,006
.• 026
Avg
.on
,007
,026
c
c
/\
.E .•. Resin ~ption W.Itf~83 - 17 ·~Rohm & Haas, XE.-123, resin
lf
was used in t)le ion exchange circuit during this test program on Monument Valley ore. This: res:i.n had been used previously during amen11bility tests. on La Sal .and Utex ore. A resin loss of 1.5 per cent was noted in 1275 hours of operation of the ion exchange .circuit, Part of this 1os.s is thought to be from attrition Md part was caused by sl!Inpling and spills.The ion exchange feed from the sand-slime circuit at
a
contained approximately 6 .·2 per cent solids by weight. the pulp after adjustment with caustic aver11ged 10.95,density of 1.05 The pH of
The primary objective of this test work on Monument Valley o;re was to determine the effect, if any, of operating with an ion exchange feed having .a uranium to vanad,ium ·ratio of approximately 1:1. In
illl attempt to achieve this ratio. various high grade portions ·of
Stockpile 46 were processed. F.or the period from December 5 to JMuary 10 the feed to the plf~I~t var'f.ed as shown in Table VI.
As:
the data show,. a uranium to vanadium ratio of 1:1 was not attained, Further attempts to obtilin a higher grade vilnadium .ore fro!l;l this
stockpile were then ab.andoned. ·
Table VI
Alkaline Leach .,. Rll'. Pilot Plant
Monument Valley Ore
.Belt Feed 2 % lXF• g;/1 U308:V205
UJOS V205
.fuQa
. vzo§ Ratio.IX Tails., g/1 U;~Os
Vill5
12/5 .152 0.370 .500 .123 4.1:1 .007 .125 12/9 ,214 0.812 .520 .183 3.8:1 .002 .148 12/13 .251 0.784 .610 .231 2.6:1 .oo5 . 260 12/18 .275 1.14 .670. .375 1.8:1 12/22£:./
.243 0.964 .630 .344 1.8:1 .009 .312 .009 .340 12/27 .264 1.19 .530 .3.08 1. 7:1 .008 .291 12/31 .254 1.01 .510 .. 351 1. 5:1 .0.02 .. 316 1/6 .248 0.9.90 .440 .255 1. 7:1 .005 .249 1/10 .258 0.852 .480 .260 1. 9:1 .0.02 ,280The use of XE-123 does not constitute an end.orsetitent 9f this resin nor does it mean that XE-123 is the only res.in suit11ble for the R!l' process •
The temperature in .the leach circuit was de.creased fro!l;l 90"C to 80°C and the sand-slime circuit was operated to produce illl
:tX ilt a density of 1.05 to. 1.06 irtstead of 1.06 to 1.07 grli)D.s per ml.
c
c
(
WIN-83 18
-The ion exchange circuit was operated at a solution to resin ratio of 6:1 with seven banks on exhaustion and five on elution. With
the circuit operating under these conditions and the pH of the ion
exchange feed properly adjusted for vanadium elimination,
l/
sampleswere taken of the ion exchange feed pulp, eluting solution, and
resin in each basket on January 27. These samples were taken
simultaneously at changeover. The solution and resin samples were
assayed for both uranium and vanadium and the results plotted in
Figures 2 and 3. These data show the expected decrease in vanadium
on the resin as it becomes loaded with uranium. The adjustment of
feed pulp pH has not prevented the adsorption of vanadium but
rather has shifted the equilibrium to favor the preferential loading
of uranium.
Daily ion exchange data are summarized and presented in Appendix Tables 6 and 7. With an average ion exchange feed assay of 0.563 g U308/l and the circuit operating at an intended loading of
3.4 lb U308 per cu ft of wet settled resin, the ion exchange tails
averaged 0.007 g u3o8;1. The average changeover time was ~.9 hours
and a recovery of 98.7 per cent was realized.
F. Elution and Precipitation
Daily elution and eluate make-up data are shown in Appendix
Table 8. The eluant used was a neutral solution of l ~ NaCl. A
total of 40 gallons of pregnant eluate, 4.9 equivalent resin volumes,
was sent to precipitation per bank eluted. There were five banks
on elution with the eluate to resin ratio at 6:1. Pregnant eluates averaged 9.88 g u3o8 11 and final eluate from the lead bank on elution averaged 0.12 g u 3o8 /l. Samples of eluted resin which were stripped in the laboratory showed the elution was complete. Pregnant eluate was precipitated in 550-gallon batches. The pre-cipitated slurry was filtered and washed in a plate and frame press. Both the press filtrate and water washes were discarded. Daily filtrate and wash data are presented in Appendix Table 9 while daily reagent requirements for precipitation are shown in Appendix
Table 10. Additional precipitation data showing daily yellow cake
assays are presented in Appendix Table 11. A total of 20 precipi-tations were made producing 1269.2 lb of yellow cake containing 891.0 lb u 3o8 . Precipitations of the pregnant eluates were made by adding H2S04 to adjust the pH to 2.7 - 3.0, heating to so•c, agitating 2 - 3 hours, and then neutralizing to pH 7 with MgO. Reagent requirements for elution and precipitation were 1.40 lb
H2so4 , 0.31 lb MgO, and 6.12 lb NaCl per pound of
u
3o8 produced.l/
Topical Report :wrN-39, Alkaline Res.in-In-Pulp Process for the,!1
Exhaustion
..
Elutionl15.0
Ion Exchange Feed
. 56 _
g
u
3o
811 . 321s v
2o
511....
10.0 .... ... po ... 00 " 0.6 " s:: s:: 0 0....
.u....
.u"'
0.5"'
...
...
.u c v 2 : : .u s:: s::"'
"'
cJ"
s:: 0.4 s:: 0 o.- -.... 0 0"'
'
0 s:: 5.0 s:: 0 0....
0.3 U308....
.u .u"
"
....
....
0 0"'
0.2 CJl 0 0.1 U308 1 2 3 4 5 6 7 8 9 10 11 12 13 14 Bank I :0:: H,...z
Figure 2 \0 I 0>Alkaline RIP Elution Gradient I VJ
55 50 1>1 45
g.;
.-< 40...
00 00 35 0:"'"
""
30"'
0 ...:I"'
....
25"
·~ 20. 15 10 5 140---Exhaustion---~-- -.(---Elution---~--U308 1 2 3 4 5 v2o5 6 7Bank 8 9 Figure 3Alkaline RIP Resin Gradient Monument Valley Ore
10 12 13 14
'"'
H NZ 0 1 co I u>c
c
(
METALLURGICAL BALANCE WI~-83 21-A metallurgical balance with respect to uranium and vanadium for the Alkaline Leach - RIP Pilot Plant when Monument Valley ore was treated is presented in Tables VII and VIII, respectively. The uranium and vanadium content are from assays of samples taken in the Feed Preparation Plant and quantity of ore processed is based on truck weights. The calculated U308 recovery amounted 92.9
per cent. Actual uranium recovery based on ba.rrel weights and assays was 90.2 per cent resulting in an unaccountable loss of 2.7 per cent. Vanadium elimination in .the ion exchange circuit was successful, in that only 0.5 per cent of the total V205 in the mill feed reported in the final product. A vanadium unaccountable loss of 0.3 per cent is reported.
Table VII
U30s Metallurgical Balance Alkaline Leach - RIP Pilot Plant
Monument Valley Ore
U308
Tons
u
3og
Content TotalTreated % g/1 lb %
Feed 206.58 0.239 987.45 100.0
Residue 206.58 O.Oll 45.45 4.6
Leach liquor 942.00 95.4
Soluble loss in drag sands 0.039 3. 76 0.4
Adsorption uni.t feed 0.563 938.24 95.0
Adsorption unit tails 0.007 13.14 1.3
Solution to precipitation 9.88 925.10 93.7
P~;ess filtrate 0.004 3.81 0.4
Press water wash 0.043 4.40 0.4
Calculated product recovery 916.89 92.9
Product (1269.2 lb) 70.2 891.00 90.2
c
(
Table VIII
R2.0.5
Metallurgical Balance
Afkgl ine I.each -
RIP
Pilot Pla..'rltMonument Vall ey Ore
Tons
:i1:2Q;i
Treated
...:L
gfiill
Feed
206.58
0,837
3458.1
Leach residue
206.58
0,716
2958.2
Leach liquor
0,288
499.9
RIP tails
0.273
473.9
Eluate
0.168
26,0
Yellow cake
(1269.2
lb)
1.46
18.5
Unaccountable loss
7·5
WIN-8322
-Total
%'
100,0
85.5
14.5
13.7
o.8
0.5
0,3
(
c
APPENDix
WIN-83
23WIN-83 25
-c
Tab!e 1 (Contd) Daily Belt .Feed Data
Alkaline Leach - RIP Pilot Plant Monument Valley Ore
Time Dry Belt Feed Material
.~ hr Tons 1956
%
U~Osu
3o
8., lb%
V;!OSv
2os
1.lb 1/3 21.0 3.91 .269 21.02 1.14 89.08 1/4 24.0 4.01 .260 20.86 1.02 81.82 1/5 24.0 4.01 .288 23.10 1.13 90.65 1/6 24.0 3.98 ,248 19.75 0.990 78.84 1/7 24.0 4.02 .215 17.30!l;
72.
57.92 1/8 24.0 3.98 .284 22.62 1.01 80.44 1/9 24.0 4.00 .260 2(). 78 1.23 98.33 1/10 24.0 4.03 .258 20.80 0.852 64.66 1/11 24.0 4.02 . 241 19.38 . 0.964 77.53c
1/12 24.0 4.02 .275 22.12 1.034 83.15 1/13 24.0 4.01 .237 19.01 0.832 66.74 1/14 24.0 3.96 .219 17.35 0. 715 56.64 1/15 24.0 4.00 .266 21.28 0.778 62.24 1/16 24.0 4.01 .266 21.33 0. 739 59.27 1/17 24.0 4.01 .250 20.03 0.801 64.18 1/18 24.0 4.02 .263 21.16 0.815 65.58 1/19 24.0 3.99 .169 13.50 0.534 42.65 1/20 24.0 3.96 .195 15.46 0~589 46.68 1/21 24.0 3.99 .189 15.08 0.557 44.44 1/22 24.0 4.00 .199 15.92 0.671 53.68 l/23 24.0 4.03 .184 14.81 0.676 54.42 1/24 24.0 3.95 .211 16.66 0.766 60.47 1/25 6.0 3.96 .232 18.36 0.995 78.35 Avg 3.89 .239 0.837(
WIN-83 26
-c
Table 2
Daily Grinding .and Ball Mill Thickener Data Alkaline Leach - RIP Pilot Plant
Monument Valley Ore
Density, s;Lml
Classifier Thickener Flocc Add' n ·
Date Ball Mill O' flow U'flow ml[min lbLday
1955 11/27 1.58 1.20 7.8 O.lll ll/28 1.57 1.19 1.37 fl. 1 0.215 11/29 1.59 1.19 1.39 7.7 0.205 11/30 1.56 1.18 1.41 24.2 0.639 12/1 1.57 1.19 1.38 82.0 2.167 12/2 1.58 1.18 1.31 54.3 1.435 12/3 1.59 1.19 1.34 37.7 0.996 12/4 1.58 1.18 1.41 24.1 0.637
c
12/5 1.58 1.17 1.45 23.0 0.608 12/6 1.58 1.18 1.49 23.6 0.624 12/7 1.57 1.18 1.49 25.9 0.684 12/8 1.59 1.18 1.50 7:6 0.201 12/9 1.58 1.18 1.50 18.3 0.483 12/10 1.58 1.17 1.50 17.0 0.449 12/11 1.58 1.17 1.49 14.7 0.388 12/12 1.57 1.18 1.50 15.0 0.396 12/13 1.57 1.19 1.49 14.6 0.386 12/14 1.58 1.18 1.49 12.0 0.317 12/15 1.58 1.18 1.49 13.8 0.365 12/16 1.58 1.17 1.50 7.0 0.145 12/17 1.58 1.17 1.48 7.7 0.203 12/18 1.58 1.18 1.49 5.0 0.132 12/19 1.58 1.18 1.50 8.3 0.219 12/20 1.58 1.18 1.50 11.3 0.298 12/21 1.58 1.18 1.50 12.3 0.325 12/22 1.57 1.18 1.50 12.3 0.325 12/23 1.58 1.17 1.47 21.0 0.555 12/24 1.59 1.18 1.48 5.0 0.132 12/27 1.5~ 1.18 1.68 9.0 0.238 12./28 1.59 1.17 1.58 9.0 0.238 12/29 1.66 1.17 1.41 13.0 0.343 12/30 1.64 1.17 1.38 11.0 0.291 12/31 1.64 1.18 1.38 8.0 0.211(
WIN-83 27
-(
Table 2 (Contd)
Daily Grinding .and Ball Mill Thickener Data Alkaline Leach - RIP Pilot Plant
.Monument Valley Ore
Densit:~:, gLml
·Classifier Thickener Flocc Add'n
~ Ball Mill O' flow
1956
U' flow ml/min lb/dax
1/3 1.63 1.18 1.55 8.5 0.225 1/4 1.64 1.18 1.43 14.0 0.370 l/5 1.64 1.18 1.44 8.0 0.2ll l/6 1.63 1.18 1.44 13.0 0 .. 343 1/7 1.64 1.18 1.49 15.0 0.396 1/8 1.64 1.18 1.50 12.5 0.330 l/9 1.64 1.18 1.50 16.0 0.423 1/10 1/64 1.18 1.51 13.0 0.343
c
1/ll 1.64 1.18 1.52 14.0 0.370 1/12 1.64 1.18 1.53 20.0 0.528 1/13 1.64 1.18 1.52 16.0 0.423 1/14 1.64 1.18 1.51 25.0 0.661 1/15 1.65 1.18 1.53 27.0 0.713 1/16 1.63 1.18 1.54 30.0o.
793 1/17 1.65 1.18 1.51 34.0 0.898 1/18 1.62 1.18 1.51 28.6 0.756 1/19 1.64 1.18 1.53 ll.O 0.291 1/20 1.63 1.18 1.51 34.0 0.898 1/21 1.64 1.18 1.51 29.0 0.766 1/22 1.65 1.18 1.51 25.0 0.661 1/23 1.64 1.17 1.53 19.0 0.502 1/24 1.63 1.17 1.51 27.0 0.713 1/25 1.65 1.54 33.0 0.872 Avg 1.61 1.18 1.49 18.6 0.490(
WIN-83 30
(
-'-·
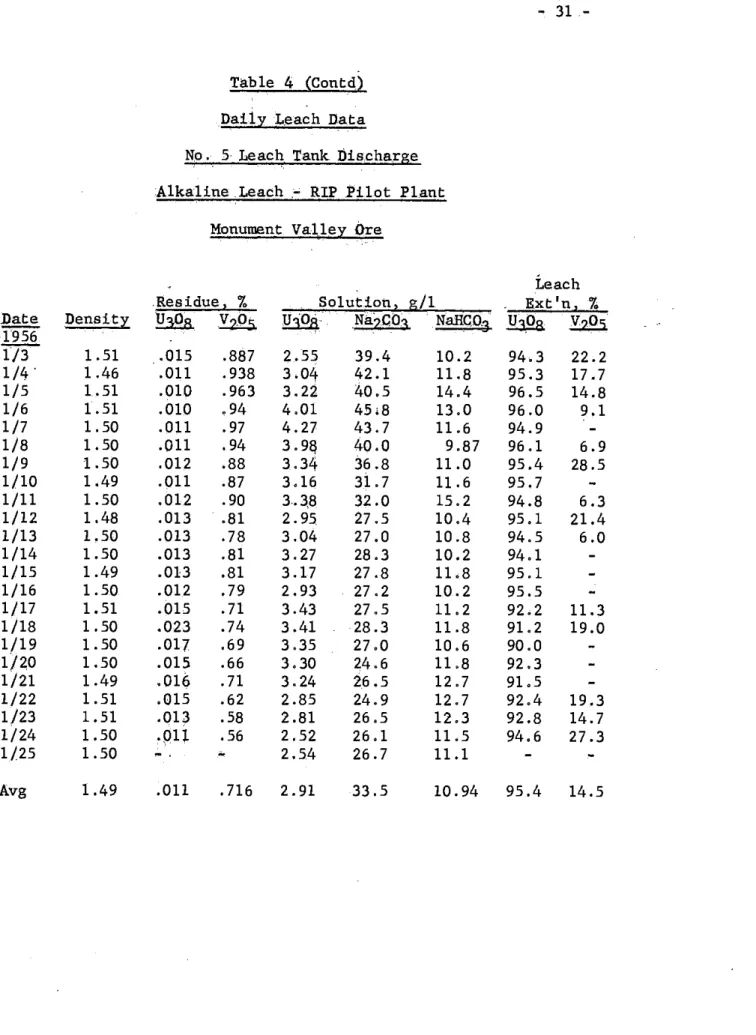
Table 4Daily Leach Data No. 5 Leach Tank Discharge Alkaline Leach , RIP Pilot Plant
Monument Valley ·Ore
Leach
R.esidue2 _% Solution, !!ill .Ext'n, '7.
~ O.ensity
tr3os
~u
3og .
Na2Co
3 NaHC03u1oa
v,os
..l9..55.
ll/27 11/28 ~ 11/29 11/30 L49 12/1 1.41 .012 .376 2.48 50.5 13.2 93.7 30.5 12/2 1.51 .011 .394 1.99 52.0 14 . .4 94.3 29.6 12/3 1.45 .011 .452 0.946 26.0 6.62 92.7 12/4 1.49 .016 .030 1.72- 42.5 8.86 89.2c
12/5 1.50.on
.514 2.00 47.6 10.90 92.2 12/6 1.51 .012 .494 2.09 45.5 12.60 91.5 12/7 1.47 .010 .466 2.4q 4?.2 11.50 94.8 31.9 12/8 1.50 .006 .356 2;25 ~8.0 10.50 97.5 49.2 12/9 1.50 .Ql;l .486 2.15 31.4 10.50 94.8 40.2 12/10 1.50 .011 .524 2.66 34.1 11.90 95.6 46.3 12/11 1.48 .010 .526 3.71 31.2 9.50 96.2 49.0 12/12 1.49 .011 .598 3.04 32.8 12.50 96.5 44.9 12/13 1.50 .012 .643 2.93 29.1 10.60 95.2 18.0 12/14 1.49 .012 . 754 3.25 30.7 10.60 94.4 12/15 1.50 .01:2 . 782 3.12 27.8 12.50 94.0 12/16 1.51 .010 . 745 2.83 27.0 9.53 97.0 35.5 12/17 1.50 .011 . 738 2.69 28.8 7.60 96.2 36.3 12/18 1.50 .011 . 754 2.80 32.5 7.60 95.8 33.8 lZ/19 1.50 .011 .815 3.19 33.6 10.20 96.3 29.7 ' 12/20 1.49 .b11 .868 3.28 37.0 8.90 95.5 11.8 12/21 1.47 .012 .885 2.92 30.8 9.90 95.4 16.9 12/22 1.49 .012 .885 2.93 29.9 9.30 95.2 8.2 12/23 1.50 .013 .937 3.32 33.6 7.60 93.4 12/24 1.50 12/27 1.47 .011 .880 3.12 36.3 11.4 95.8 25.9 12/28 1.51 .Oli .820 2.74 30.4 9.7 95.8 27.2 12/29 1.51 .011 .834 2.91 32.0 9.1 96.3 31.9 12/30 1.50 .009 .806 2.15 26.1 9.0 96.1 17.9 12/31 1.51 .010 .898 3.15 41.0 13.5 96.1 11.2(
WIN~83
31
-c
Table 4 (Contd) Daily L.each Data
N"o. 5 Leach Tank Dis.charge Alkaline .Leach .~ RIP .Pilot Plant
Monument Valley Ore
Leach
.Residue, % Solution, g/1 Ext'n, %
Date Dens it;)::
!!.3Qa.
V205 U30a N"il2C03 N'all.CO@ u3oavzo
5 1956 1/3 1.51 .015 .887 2.55 39.4 10.2 94.3 22.2 1/4 1.46 .011 .938 3.04 42.1 11.8 95.3 17.7 1/5 1.51 .010 .963 3.22 40.5 14.4 96.5 14.8 1/6 1.51 .010 .94 4.01 45•8 13.0 96.0 9.1 1/7 1.50 .011 .97 4.27 43.7 11.6 94.9 1/8 1.50 .011 .94 3.9!j 40.0 9.87 96.1 6.9c
1/9 1.50 .012 .88 3.34 36.8 11.0 95.4 28.5 1/10 1.49 .011 .87 3.16 31.7 11.6 95.7 1/11 1.50 .012 .90 3.3,8 32 .o 15.2 94.8 6.3 1/12 1.48 .013 . 81 2.95 . 27.5 10.4 95.1 21.4 1/13 1,50 .013 . 78 3.04 27.0 10.8 94.5 6.0 1/14 1.50 .013 .81 3.27 28.3 10.2 94.1 1/15 1.49 .013 .81 3.17 27.8 11.8 95.1 1/16 1.50 .012 . 79 2.93 27.2 10.2 95.5 1/17 1.51 .015 .71 3.43 27.5 11.2 92.2 11.3 1/18 1.50 .023 . 74 3.41 28.3 11.8 91.2 19.0 1/19 1.50 .017 .69 3.35 27.0 10.6 90.0 1/20 1.50 .015 .66 3.30 24.6 11.8 92.3 1/21 1.49 .016 .71 3.24 26.5 12.7 91.5 1/22 1.51 .015 .62 2.85 24.9 12.7 92.4 19.3 1/23 1.51 .013 .58 2.81 26.5 12.3 92.8 14.7 1/24 1.50.pn
.56 2.52 26.1 11.5 94.6 27.3 1/25 1.50 2.5.4 26.7 11.1 Avg 1.49 .011 .716 2.91 33.5 10.94 95.4 14.5(
WIN-83 32
-c
Table 5
Daily No. 4 Drag .Sands Data Alkaline. Leach - RIP .P;!.lot Plant
Monument Valley Ore
Solution
Tons Rejected/day Assay
Date Density Solids :solution g
u3oa/1
'I9'5s
11/30 12/1 1.73 1.94 0.94 12./2 L5s 1.23 0.85 .08 12/3 1.80 0.81 0.33 .04 12/4 2.Q7 l. 78 0.38 .03 12/5 1. 79 1.06 0.43 .04 12/6 1.88 2.58 0.87 .05 12/7 L~5 1.80 0.65 .06c
12/8 1. 78 2.20 0.93 .05 12/9Las
2.40 0.85 .05 12/10 l. 76 2.71 l. 22 .05 12/11 1.77 2.90 l. 27 .05 12/12 1. 76 2.05 0.93 12/13 1.71 1.93 0.99 .04 12/14 l.76
2.61 1.19 .07 12/15 1.84 2.64 0.97 .04 12/16 ~.75 2.43 1.12 .07 12/17 1.19 2.42 0.76 .08 12/18 1 12/19 1.80 2.29o.
72 12/20 ~.75 2.53 1.00 .07 12/21 ~.73 3.11 1.37 .08 12/22 :J-.79 2.96 1.38 .09 12/23 1-·BQ 3.17 1 .. 27 .05 12/24po
1.29 0.51 12/28i.so
2.96 1.20 .05 12/29 1.85 1.89 0.68 .05 12/30 H~ ,. 1.16 0.44 .05 12/31 1.87 1.24 0.43 .06(
WIN-83 33
-(
Table 5 (Contd)
Daily No. 4 Drag S.ands Data Alkaline Leach .~ Ril' Pilot Plant
Monument Valley Ore
Solution
Tons .Rejected/day Assay
~ D.ensity Solids Soluti.on g.U@Os/1
1956 I
173
~.69 2.32 0.90 .02 l/4'
2.06 0.80 .02 l/5 1.81 1.56 0.60 .03 l/6 1.81 2.03 0.78 .04 l/7 i.8o 1.89 0.76 .04 l/8 2.38 0.96 .03 l/9 2.24 0.90 .03 l/10 2.21 0.89 .04c
1/ll 1.85 2.84 1.14 .04 l/12 1.87 2.37 0.83 .01 l/13 1.85 2.14 0.76 .04 l/14 2.54 0.90 .02 l/15 1.87 3.80 1.34 .02 l/16Las.
2.49 0.83 .02 l/17 i.98 3.06 0.82 .02 l/18 1.94 2.54 0.75 .02 l/19 l. 96 1.94 0.53 .02 l/20 1.95 2.95 0.85 .02 l/21 1.84 2.87 1.06 .02 1/22 1.84 2.57 0.94 .02 l/23 1.83 2.53 0.95 .01 l/24 1.95 . 2.58 0. 72 .01 l/25 ]..84 2.69 1.00 .01 l/26 1.?6 1.74 0.79 .01 l/27 l. 75 l . 70 1.00 .02 l/28 1.81) 1.47 0.59 .01 l/29 1.80 1.16 0.47 .01 Avg 1.82 2.24 0.86 .037(
WIN-83 34
-c
Table 6
Daily Resin-In-Pulp Uranium Adsorption Data Alkaline Leach - RIP Pilot Plant
_Monument Valley Ore
Ion Exchan~e Tails
Ion Exchan~e Feed Recovery
Da_te
..E!.
Dens it)!: BE!!! ~ iJ3os/l ~u
3o211 %1955 11/30 10.3 1.04 3.31 . 78 12/1 10.4 1.04 1.05 0 76 .018 97.6 12/2 11.0 1.04 1.63 .58 .001 99.8 12/3 11.2 1.03 0.22 .45 .001 99.8 12/4 11.0 1.03 1.88
.so
.001 99.8 12/5 11.0 1.05 1.37.so
.007 98.6 12/6 11.0 1.06 2.35 .60 .029 95.2 12/7 11.0 1.06 1.83 .59 .042 92.9 12/8 11.0 1.06 1.89 .60 .013 97 .8 12/9 10.9 1.06 2.05 .52 .002 99.6c
12/10 10.9 1.06 1.93 .53 .004 99.3 12/11 10.9 1.06 1.98 .66 .015 97.7 12/12 10.8 1.06 2.17 .57 .004 99.3 12/13 10.9 1.06 1.60 .61 .005 99.2 12/14 10.9 1.06 2.33 .63 .007 99.5 12/15 10.9 1.06 2.18 .58 .002 99.7 12/16 10.9 1.06 3.03 .62 .006 99.0 12/17 10.9 1.06 1.88 ·-· 64 .015 97.7 12/18 10.9 1.06 1. 78 .67 .009 98.0 12/19 10.9 1.06 2.31 .68 .012 98.2 12/20 10.9 1.06 2.59 .75 .018 97.6 12/21 10.9 1.05 2.52 .82 .073 91.1 12/22 10.9 1.05 3.17 .63 .009 98.6 12/23 10.9 1.05 2.25 .56 .005 99.1 12/24 11.0 1.05 2.72 .59 .002 99.6 12/28 11.0 1.05 3.83 .53 .008 98.5 12/29 11.1 1.05 2.30 .51 .006 98.8 12/30 11.0 1.05 1.53 .57 .006 98.9 12/31 11.0 1.04 1. 78 .51 .002 97.6 1956 1/3 11.0 1.05 3.32 .48 .005 99.0 1/4 11.0 1.05 2.62 .48 .005 99.0 1/5 11.0 1.04 2.97 .51 .039 92.4 1/6 11.0 1.04 2.93 .44 .005 98.9 1/7 11.0 1.05 2.50 .48 .002 99.6 1/8 10.9 1.05 2.84 .52 .002 99.6 ( 1/9 10.9 1.05 3.14 .49 .002 99.6'·
WIN-83 35
-(
Table 6 (Contd)
.Daily Resin-In-Pulp Uranium Ads.orption Data Alkaline .Leach- RIP-Pilot Plant
Monument Valley Ore
Ion Exchange Tails
Ion·Exchange Feed Recovery
~ _E!L_ Densitl ~ J1i
u
3o
2 /l 8u
3o
811 '7. 1956 1/10 11.0 1.05 2.56 .48 .002 99.6 1/11 10.9 1.05 2.73 .55 .002 99.6 1/12 11.0 l.d:S 3.34 .56 .002 99.6 1/13 10.9 1.05 2.43 .5} .003 99.4 1/14 10.9 1.05 2.66 .56 .002 99.6 1/15 11.0 1.05 2.73 .58 .004 99.3 1/16 10.9 LOS 3.42 .5.6 .003 99.5 1/17 10.9 1.05 2.83 .57 .004 99.3 1/18 11.0 2.51 .57 .002 99.7c
1/19 10.9 3.24 .54 .003 99.4 1/20 11.0 2.49 .62 .004 99.4 1/21 10.9 2.99 .57 .003 99.5 1/22 10.9 2.86 .53 .001 99.8 1/23 10.9 2.80 .48 .002 99.6 1/24 10.9 2.82 .46 .002 99.6 1/25 10.9 3_.06 .. 44 .002 99.5 1/26 10.9 2.42 .44 .002 99.5 1/27 10.9 3.68 .§2 .006 98.8 1/28 10.8 3.15 .52 .008 98.5 1/29 11.0 3.82 .56 .023 95.9 Avg 10.9 1.05 2.51 .56 .007 98.6.!'\
!
Table 7
Daily Miscellaneous .Resin-In-Pulp Adsorption Data Alkaline Leach - RIP Pilot Plant
Monument Valley {)re
Ion Exchan!iie Feed Ion Exchange Tails V205
Tons/day Solution, gJl Salutian2 g/1 Recovery
Date Sol ,ids Sol1·n
VzO't Na2Co3 NaHC03 ~ Na2co3 NaHC03 %
1955 11/30 0 .. 90 19.75 12/1 0.28 6.25 .162 22.3 9. 70 .12.2 19.7 6. 72 24.7 12/2 0.41 9. 7 5 .191 18.3 1. 76 .191 18.3 1.18 0.0 12/3 0.03 1.34 :148 15.4 1. 76 .161 16.8 1.00 9.4 12/4 0. 77 11.20 .131 87.7 2.60 .109 71.3 4.83 58.4 12/5 0.51 8.16 .123 17.2 0. 78 .125 17 .3 1.09 1.6 12/6 1.06 13.90 .200 17.7 0.90 .180 16.5 0.45 10.0 12/7 0. 79 10.85 .153 .134 12.4 12/8 0.89 11.19 .229 13.9 0.69 .231 13.1 1.09 8.8 12/9 0.92 12.09 .183 .148 19.1 12/10 0.89 11.41 .200 9.8 1.9 .200 9.8 1.2 0.0 12/11 0.93 11.69 .281 10.7 1.8 .249 10.7 1.8 11.4 12/12 0.91 12.87 .35 9.0 1.7 .270 9.0 0.8 22.9 12/13
o.
75 9.42 .31 8.9 1.6 .260 8.9 0.8 16.1 12/14 1.05 13.74 .301 8.5 1.7 .333 8.5 0.8 10.6 12/15 0.98 12.86 .235 7.8 0.5 .221 7.0 0.76 5.7 12/16 1.43 17.86 .298 8.8 0.44 .298 7.7 0.67 0.0 12/17 1.00 10.40 .333 9.9 0.50 .350 9.7o.
73 5.1 I :0: 12/18o.
79 10.53 .375 8.7o.
70 .312 9.8 1.50 16.8 '-'.Z H 12/19 1.04 13.65 .456 10.0 1.11 .358 9.4 0.42 21.5 Cl' ex> I I W 12/20 1.20 15.25 .421 10.3 1.26 .403 9.6 0.67 4.3~'
0,
(~'Table 7 (Contd)
Daily Miscellaneous. Resin-In-Pulp Adsorption Data Alkaline Leach - RIP Pilot Plant
Monument Valley Ore
Ion Exchan~e Feed Ion:Exchange Tails v2o5
Tons/day .Solution·, g/1 Recovery
Date Solids Sol1n
v,os NazC03 NaHC03 VzOs Na2co3 l'laHC03 %
1955 1'2721 0.99 14.94 .473 12.2 .463 10.6 0.84 2.1 12/22 1.24 18.77 .344 9.6 0.13 .340 8.9 0.42 1.2 12/23 0.78 13.37 .298 9.0 .291 8.4 0.42 2.4 12/24 1.07 16.15 .280 8.9 .263 7.8 0.25 6.1 12/28 1.35 22.78 .308 9.5 .291 8.8 0.34 5.5 12/29 0.81 13.67 .291 7.4 .252 7.0 0.24 13.4 12/30 0.54 9.10 .323 8.1 0.4 .316 7.6 0.08 2.2 12/31 0.58 10.60 .351 7.8 0.7 .226 7.3 0.04 35.6 1956
ll3
1.26 19.68 .280 8.9 .284 7.8 0.30 1.5 1/4 0.86 15.61 .237 8.5 0.8 .222 8.3 0.17 6.3 1/5 0.89 17.71 .243 7.9 0.8 .226 7.8 0.2 4.7 1/6 0.89 17.49 .255 6.6 0.6 .249 6.5 nil 2.4 1/7 0.79 14.96 .280 7.0 0.8 .270 7.0 0.76 3.6 1/8 1.11 16.85 .290 6.8 0.9 .260 6.0 0.42 1.1 1/9 1.19 18.62 .290 6.7 1.2 .28 6.9 0.42 3.5 1/10 0.89 15.23 .260 6.4 0.9 .28 6.2 0.21 7.7 I :0: 1/11 1.06 16.17 .281 6.6 0.6 .259 6.4 0.25 7.8 Hwz
1/12 1.18 19.86 .348 6.1 0.97 .305 5.7 0.38 1.2 -.J I CXJ 1/13 0.85 14.42 .287 6.4 0.18 .292 5.7 0.59 1.7 I W/", ,f\,
Table 7 (Contd)
.Daily Miscellaneous Resin-In-Pulp Ads.orption Data
Alkaline Leach - RIP Pilot :Plant
Monument Valley Ore
Ion Exchange Feed Ion-Exchange Tails V2o5
Tons/day Solution, g/1 S.olution2 g/1 Recovery
Date
· -
Solids S.ol'nY2Qs.
NazC03 _.NaJ!c;o3 VzOsNacco3
NaHC03 %1956 1/14 0.98 15.83 .368 7.7 0.17 .354 6.7 0.50 2.5 1/15 1.03 16.69 .286 8.5 0.22
.no
7.6 0.55 5.6 1/16 1.25 20.28 7.4 0.21 .259 6.7 0.67 1/17 1.07 16.79 .329 7.9 0.40 .333 7.2 0.55 12.1 1/18 0.96 14.86 . 32;9 7.9 0.29 .284 6.9 0.63 25.1 1/19 1.27 19.21 .308 7.6 0.17 .313 6.4 0.42 1.6 1/20 0.88 14.79 .392 8.3 0.07 .3:29 7.3 0.25 16.1 1/21 1.02 17.29 .514 7.3 0.25 1/22 1.08 16.96 .326 6.4 1.3 .315 5.8 0.84 3.5 1/23 0.99 16.61 .301 7.5 0.11 .291 6.6 0.42 3.3 1/24 1.07 16.72 .238 6.4 0.48 .294 5.8 1.68 2.1 1/25 1.16 18.14 .263 7.2 0.26 .239 6.5 0.50 9.7 1/26 0.85 14.37 .298 7.3 0.34 .)80 6.8 0.42 6.0 1/27 1.44 21.82 .368 7.9 0.62 .250 7.1 0.88 32.1 1/28 1.20 18.66 .308 9.4 0. 74 .285 8.8 0.55 7.5 1/29 1.39 22.65 .352 13.8 1.54 .330 12.5 1.13 6.3 Avg 0.96 14.85 .267 10.9 1.03 .272 10.0 0. 78 7.6 I ::;: Hwz
()0 I ()0 I""
WII:'I-83 39
-(
Table 8
Daily Elution and Eluate Make-up Data Alkaline Leach - RIP Pilot Plant
Monument Valley Ore
Final Eluate Make-up
Eluate .Eluate Batch NaCl
.Date gal/day g U30g/l g U;Os/1 No;
--.
lb1955 12/2 120.0 13.28 .284 40 48:1 12/3 40.0 8.60 . .261 41 487 12/4 80.0 13.88 .214 12/5 80.0 11.94 .290 12/6 160.0 10.97 .362 12/7 160.0 7.75 .107 42 12/8 160.0 8.66 .088 12/9 160.0 10.84 .088
c
12/10 160.0 11.57 .130 283 12/11 160.0 10.55 .129 12/12 200.0 10.61 .109 44 487 12/13 160.0 10.68 .083 12/14 200.0 10.24 .107 12/15 200.0 10.65 .150 12/16 240.0 10.97 .145 45 292 12/17 200.0 10.65 .120 12/18 120.0 11.35 .102 12/19 200.0 10.51 .092 46 298 12/20 200.0 10.30 .078 12/21 200.0 10.55 .099 47 227 12/22 200.0 10.77 .126 12/23 160.0 11.33 .124 12/24 200.0 11.22 .122 12/27 240.0 11.08 .103 8 289 12/28 160.0 11.32 .110 12/29 160.0 11.51 .129 9 282 12/30 120.0 11.43 .143 12/31 80.0 12.60 .150 1956 1/3 . 120.0 12.48 .166 1/4 200.0 10.98 .140 1/5 160.0 10.75 .118 10 296 1/6 160.0 11.38 .098 1/7 200.0 11.30 .086 1/8 200.0 11.07 .115 11 241(
1/9 160.0 11.66 .096 1/10 160.0 11.35 .090 12 268WIN."83 40 -/ ( ,_ --Table 8 (Contd)
.Daily Elution and Eluate Make-up Data
Alkaline Leach - RIP Pilot Plant
Monument Valley Ore
Final .Eluate Make-ul!
Eluate Eluate Batch NaCl
Date gal/day g U308 /1
1956
&
U70g/l No..JJL
i7iT
200.0 11.09 ,098 1/12 i2o.o 11.20 .084 1/13 200.0 10.37 .088 1/14 160.0 10.65 .088 12 268 1/15 200.0 10.50 .076 1/16 280.0 10.25 .083 13 293 1/17 200.0 11.21 .093 1/18 200.0 11.05 .100 1/19 200.0 11.13 .106 14 275c
1/20 200.0 10.21 .085 1/21 160.0 10.99 .080 15 1/22 160.0 11.11 .102 1/23 200.0 11.16 .111 1/24 160.0 9.94 .084 17 289 1/25 120 .o 9.36 .061 1/26 200.0 11.00 .085 1/27 200.0 10.31 .085 18 269 1/28 240:0 9.80 .081 1/29 240.0 9.05 .095 19 302 1/30 280.0 6. 72 .061 Avg 10.78 .120 Total 9800.0 5633(
WIN:-83 41
-c
Table 9
Daily Press.Filtrate and Wash Data .Alkaline Leach - RIP Pilot Plant
Monument Valley Ore
Precip Pre.ss Filtrate ComEosite Water Wash Date No. g
u
3o
43Ll
g .C.l/1 ··~ MgS04·>·lb gu
3
o
811T9s5
J .I- -' »~ 12/7 1 .006 600 .270 12/10 2 .007 600 12.5 .191 12/12 3 .005 600 30.0 .110 12/16 4 .004 600 30.0 .041 12/19 5 .002 600 30.0 .027 12/21 6 .017 600 30.0 .037 12/27 7 .001 600 30.0 .022 12/29 8 .002 600 30.0 .016 1956 1/5 9 .003 600 30.0 .021c
1/8 10 .003 600 30.0 .019 1/11 11 .002 600 30.0 .033 1/14 12 .002 600 30.0 .027 1/17 14 .OIJ7 600 30.0 .021 1/19 15 .001 600 30.0 .016 1/21 16 .008 600 30.0 .019 1/24 17 .002 600 30.0 .015 1/27 18 .002 600 30.0 .020 1/29 19 .001 600 30.0 .018 1/31 20 600 30 .o A';rg .004 600 29.1 .050(
n
/"'",Table 10
Daily Reagent Requirements for Precipitation .Alkaline Leach - RIP Pilot Plant
Monument Valley Ore
Reagent H
Precip Eluate Add '.n, lb After After
Date No. gal g U30s/l g V205/l H2S04 !:!gQ H2S04 Add'n Mg0 Add'n
195.5 12/7 1 550 11.67 .061 75.40 14.0 2.4 7.6 12./10 2 550 9.76 .010 54.98 14.0 2.5 7.8 12/12 3 550 10.74 .160 75.88 11.5 2.5 7.3 12/16 4 550 9.85 .210 60.59 15.0 2.5 7.7 12/19 5 550 11.05 .207 69.36 18.~ 2.5 7.4 12/21 6 550 10.01 .252 66.59 14.5 2.2 7.8 12/27 7 550 11.05 .263 60.96 14.5 2.5 7.8 12/29 8 550 11.30 .193 70.99 14.0 2.5 7.3 1956 1/5 9 550 11.96 .162 76.38 14.0 2.5 7.3 1/8 10 550 11.34 .64.63 13.8 2.5 7.6 1/11 11 550 11.51 .170 70.42 13.5 2.5 7.2 1/14 12 550
._ll,AO
.126 65.89 12.5 2.5 7.2 1/16 13 550 7.44 .168 53.53 12.5 2.5 7.2 1/17 14 550 8.26 51.41 12.0 2.5 8.4 1/19 15;;so
6.98 .175 47.24 12.0 2.5 7.2 1/21 16 550 10.44 .180 58.02 14.0 2.5 8.8 1/24 17 550 9. 70 65.36 17.0 2.5 9.0·~
1/27 18 550 9.58 .196 60.99 13.8 2.5 7 .. 3 ""'"'~ 1/29 19 550 5.79 59.45 14.0 2.3 7.5 N I <XI 1/31 20 550 51.16 12.0 2.5 8.8 I W Avg 550 9.88 .169 62.99 13.8 2.5 7.7c
Date No. 1955 12/7 1 12/10 2 12/12 3 12/16 4c
12/19 5 12/21 6 12/27 7 12/29 8 1956175
9 1/8 10 1/11 11 1/14 12 1/16 13 1/17 14 1/19 15 1/21 16 1/24 17 1/27 18 1/29 19 1/31 20 Avg Total(
Table 11Daily Yellow Cake Assays Alkaline - RIP ·Pilot Plant
Monument Valley Ore
PreciJ2itation
%
u3oa U3Qa, 1b % .V:i!;QS:69.14 52.13 0.57 74.61 43.76 0, 70 76.30 48.67 1.32 78.31 44.94 1.63 77.61 50.52 1.63 74.18 45.69 1.76 75.22 50.55 1.68 70.12 51.72 1.21 71.18. 54.72 1.08 79.98 51.89 1.18 72.88 52.60 1.19 77.02 38.40 1.31 71.63 33.97 1.26 75.61 33.74 1.63 66