Change Management & Process
Improvement for PEMS
Scania Södertälje 2012 Mårten Carlsson & Erik Lindholm
II
Copyright © Mårten Carlsson and Erik Lindholm
Department of Industrial Management and Logistics Lund
University, Faculty of Engineering, Box 118 SE-221 00 Lund
III
Acknowledgment
This thesis is the final part of our five years Master‟s degree in Mechanical Engineering at Lund University. The project was conducted during the fall of 2012. Scania, Södertälje, initiated the thesis in order to investigate the future usage and implementation of Portable Emission Measurement System (PEMS).
Living in Södertälje and writing the thesis has been a positive and challenging experience. The opportunity has given us a valuable insight of the Scania organization, being one of the best-known performers of lean manufacturing.
Therefore we would like to take this opportunity to thank the people that have supported us throughout our journey completing our degree.
First of all we would like to thank our two supervisors at Scania, Lena Daudistel and Henric Naessen for their commitment and valuable support, time and effort. Also, big thanks to Björn Leksell, head of the department, who came up with the idea and established the purpose of the project.
At last, we would like to thank our academic supervisor Bertil I Nilsson at Lund Institute of Technology for an extraordinary guidance and support, making this journey possible.
Lund, 2012-12-03
V
Abstract
Title: Change Management & Process
Improvement for PEMS
Authors: Erik Lindholm and Mårten Carlsson Supervisors:
Lena Daudistel, Project Manager, Scania Henric Naessen, Project Manager, Scania Bertil I Nilsson, Adjunct Assistant professor, Department of Industrial Management and Logistics, Lunds Institute of Technology Background: The automotive industry in Europe has
been forced to develop new solutions for the vehicles in order to fulfill the emission standards set by the European Commission according to European Emission Standards (Euro -). The latest, Euro 6, involves new demands on continuous audits of emissions during a vehicles lifecycle. The standards are legislated and without approval a manufacturer may lose its license.
Purpose: The purpose of this thesis is to produce and recommend a solution for an industrialized method to implement PEMS measurements within the production. This should involve a technical concept solution, method for the handling of data and work descriptions as well as the distribution of responsibility. Complemented with process descriptions and if possible a financial estimation of the project.
VI
Problem definition: The analysis should eventuate in a recommendation of potential implementation. A procedure for measuring the emissions within area of the production line and include:
A technical method for testing and handling relevant information.
Process ownership responsibilities.
Method and process description for testing and deviation handling.
Estimation of investment cost related to the testing.
Method: To minimize the risk of influence the work will be divided into different phases. The first phase includes process mapping and descriptions to increase the understanding and visualize the differences between the processes. In extension the processes will be compared in matter of maturity in order to evaluate the potential to find a feasible flow. The evaluation will be followed by a conceptual assessment for different PEMS-solutions, which are developed in parallel. The final phase will be to estimate the investment cost of the compiled solution. Conclusion: According to Scania´s demands as well as
technical requirements for a realistic approach for PEMS measurements has grounded in a conceptual method. The future concept is based on an external trailer solution where the interfaces for connection have been minimized to reduce time and complexity of usage. A feasible work process has been developed suitable
VII
for implementation as a coordinated flow parallel performed with the internal audit process.
Keywords: PEMS, Euro 6, emission, Scania, process mapping, PEMM
VIII
Abbreviations
AUDIT – Division responsible for internal audits of finished vehicles CO – Carbon Monoxide
CO2 – Carbon Dioxide
COP - Conformity of Production
FA* – Functional Area of the vehicle assembly line FFU – Fit For Use
ISC - In-Service Conformity
LEAN – Management philosophy with aim to reduce all kind o waste NMET – Division responsible for performance and emission control NMHC - Non-methane Hydrocarbons
OBD - Onboard Diagnosis
PEMM - Process and Enterprise Maturity Model PEMS – Portable Emission Measurement System PM - Particular matter
IX
1 Table of Contents
1 Introduction ... 1
1.1 Scania ... 1
1.2 Road Traffic Emission ... 2
1.2.1 European emission standards ... 2
1.2.2 Euro 6 ... 3
1.3 Obligations for manufacturer ... 6
1.3.1 Classification of Requirements – COR ... 7
1.3.2 PEMS ... 8
1.4 Problem description ... 10
1.5 Purpose ... 10
1.6 Delimitations... 11
1.7 Objective ... 11
1.8 Outline of the report ... 13
2 Research Methodology ... 15 2.1 Scientific approach ... 15 2.1.1 Paradigm ... 15 2.1.2 Analytical approach... 16 2.1.3 Systems approach ... 17 2.1.4 Actors approach ... 17 2.1.5 Quantitative vs. Qualitative ... 19 2.2 Data collection... 20
X 2.2.1 Surveys ... 21 2.2.2 Interviews ... 21 2.2.3 Observations ... 23 2.2.4 Focus groups ... 24 2.2.5 Literature review ... 24 2.2.6 Content analysis ... 24
2.3 Trustworthiness and authenticity ... 26
2.3.1 Induction, deduction and abduction ... 26
2.3.2 Reliability ... 27 2.3.3 Validity ... 27 2.3.4 Authenticity ... 27 2.3.5 Credibility ... 28 2.3.6 Transferability ... 28 2.3.7 Dependability ... 28 2.3.8 Conformability ... 29 2.4 Strategy of research ... 29 2.4.1 Method of analysis ... 30 3 Frame of reference ... 33
3.1 Eight steps to transforming your organization ... 33
4 Methods ... 37
4.1 Process mapping ... 37
XI
4.2 PEMM – Process and Enterprise Maturity Model ... 41
4.3 Quality Function Deployment, QFD ... 43
4.3.1 Data collection ... 43
4.3.2 Work structure ... 44
4.3.3 The House of Quality ... 45
4.4 Gantt-chart ... 48
5 Analysis ... 51
5.1 Process mapping ... 51
5.1.1 FA6 ... 51
5.1.2 NMET – Performance Tools ... 59
5.1.3 Audit ... 62
5.2 Process and Enterprise Maturity Model ... 67
5.2.1 FA6 ... 68
5.2.2 NMET – Performance Tools ... 71
5.2.3 Audit ... 75
5.3 PEMS Concept descriptions ... 78
5.3.1 Concept 1. PEMS mounted on passenger seat ... 79
5.3.2 Concept 2. PEMS mounted in a box on 5th wheel ... 80
5.3.3 Concept 3. PEMS-equipment mounted in a trailer ... 80
5.3.4 PEMS in a climate controlled box inside the trailer ... 81
XII
6 Conclusion and Result ... 89
6.1 A technical solution for testing and handling of data ... 89
6.2 Work descriptions and responsibilities between the stakeholders. ... 92
6.3 Method and process description for testing a mounted vehicle complemented with a deviation description. ... 93
6.3.1 PEMS v.2 ... 94
6.4 Description of cost (investment, handling/mounting time etc.) 95 6.4.1 GANTT-redesign ... 96
6.4.2 Trailer Investment ... 98
6.5 Establish work descriptions for implemented processes. .... 98
7 Discussion and follow up ... 99
7.1 Change Management for the PEMS project ... 99
7.1.1 Establishing a Sense of Urgency ... 99
7.1.2 Forming a Powerful Guiding Coalition... 100
7.1.3 Creating a Vision ... 101
7.1.4 Communicating the Vision ... 101
7.1.5 Empowering Others to Act on the Vision ... 102
7.1.6 Planning for and Creating Short-Term Wins ... 103
7.1.7 Planning Others to Act on the Vision ... 104
7.1.8 Institutionalizing New Approaches ... 104
8 References ... 107
XIII
2 Table of illustrations
Figure 1 Progression of PM and NOx since Euro 3 ... 5
Figure 2 Horiba - PEMS OBS 2000 ... 10
Figure 3 Interview structure... 23
Figure 4 Strategy of Research ... 31
Figure 5 Kotter´s Eight Steps to Transforming Your Organization .. 34
Figure 6 The ingoing parts of a process ... 39
Figure 7 Quality Function Deployment – The House of Quality ... 46
Figure 8 Illustration of Gantt Chart ... 49
Figure 9 FA5 to Delivery ... 53
Figure 10 FA 6.1 ... 54 Figure 11 FA 6.2 ... 55 Figure 12 FA 6.3 ... 57 Figure 13 FA 6.4 ... 57 Figure 14 FA 6.5 ... 58 Figure 15 FA 6.6 ... 58 Figure 16 FA 6.7 ... 59
Figure 17 Main Audit Process ... 63
Figure 18 Test Route - Järnslingan ... 65
Figure 19 Mounting of PEMS inside cabin ... 79
Figure 20 PEMS mounted on fifth-wheel with WiFi OBD ... 81
XIV
Figure 22 PEMS mounted inside a climate-controlled box ... 82
Figure 23 QFD- House of Quality ... 87
Figure 24 GANTT schedule of actual PEMS process ... 90
Figure 25 PEMS v.2 ... 94
Figure 26 Estimated and rearranged time of the PEMS-process. ... 96
1
1 Introduction
The purpose of the first chapter is to provide the reader with fundamental information and an introduction to Scania, the European emission standard and our problem definition. The problem description is presented in association with the statements of the purpose. In the end of the chapter there is an outline of the report with a short interpretation of the chapters.
1.1 Scania
The place of origin of the company could be derived from the name, which is the Latin name of the region in the south of Sweden, Skåne. When the company first started in Malmö in 1891 Scania primary produced bicycles. Overtime, the company developed its product portfolio to include both cars and trucks.1
In order to meet the competition on the European market, the company merged with the Södertälje based company Vabis in 1911, which at the moment was producing cars. Together they became Scania-Vabis and started to produce buses and trucks. This has continued and by the time the company has concentrated their operations to Södertälje where the Head Office is located together with assembly and most of the manufacturing.2
Beside Sweden, there are production facilities in France (Anger), Belgium (Zwolle) and in Brazil (Sao Paulo). This is complemented with a set of facilities such as assembly, sales and service units around the world. In total, the company is represented in more than 100 markets where Scania supplies the markets with buses and heavy trucks. The company turnover in 2011 was approximately 87 Billion SEK and Scania Group employs more than 37‟500 employees.3
Since 2008, the large automotive manufacturer Volkswagen is the 1 www.scania.se 2 Ibid 3 Ibid
2
majority owner. As a result of the acquisition, Scania is now in the same family as the former competitor MAN.
In addition, both in Sweden and international, Scania is known for its version of LEAN manufacturing and usually regarded as one of the leading performers and the above example for their philosophy and working methods.
1.2 Road Traffic Emission
Road traffic is one of the main sources of air pollution. Tailpipe emission from road vehicles such as carbon monoxide, hydrocarbons and nitrogen oxides has often been in focus for the environmental debate. In order to counter environmental pollution from motor vehicle emissions, exhaust legislation has been stepwise tightened. Technology development in correlation with legal regulatory has increased the amount of solutions for an extensive package of measures available to reduce air pollution. This method includes both control of new vehicles and testing of vehicles in-use.4
1.2.1 European emission standards
Since 1993 the European Commission has defined a number of directives in order to control the exhaust emissions. These directives are legislated for all new vehicles sold in the European Union‟s member states and there are regulations on emissions of nitrogen oxides (NOx), non-methane hydrocarbons (NMHC), carbon monoxide (CO), total hydrocarbon (THC) and particular matter (PM). Depending on the type of vehicle, there are several directives and classifications to apply according to weight and usage.
4
http://publikationswebbutik.vv.se/upload/2969/2007_43_swedish_in_service_testing_prog ramme_on_emissions_from_passenger_cars_and_light_duty_trucks.pdf
3
The first emission standard was the Euro 1; introduced in 1992, until now there have been four updated versions for standards with the present Euro 5.5
1.2.2 Euro 6
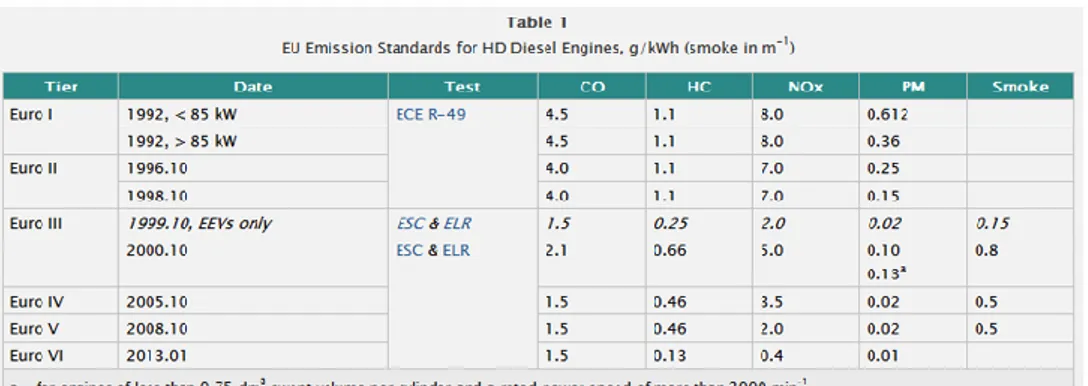
By the end of December 2013, a new updated version named Euro 6 will be mandatory for the automotive industry.6 These new legislated standards are demanding and the industry is worried, not only about the new directives, but how the new measurements and follow-ups should be managed. These demands are not only concerning the emission levels, but also third part access to vehicle information. The new standard states that the emission durability period should effect for seven years or 700‟000 km7. This is an increase by 130% in matter of distance according to the Euro 5 seen in table 18 which is a part of the regulation of In Service Conformity.
5 http://europa.eu/legislation_summaries/environment/air_pollution/l28186_en.htm 6 http://europa.eu/legislation_summaries/environment/air_pollution/l28186_en.htm 7 http://www.cumminseuro6.com/what-is-euro-6 8 http://www.dieselnet.com/standards/eu/hd.php
4
The illustration in figure 19 gives an overview of the extensive differences concerning the amount of PM and NOx included in exhaust emissions since the first release. This can give a hint on the pressure given on the automotive industry to develop new solutions.
1.2.2.1 In service conformity - ISC
To ensure that the vehicles fulfill the regulations not only initially, but also throughout a normal lifecycle of a vehicle, the European Commission demands controls to assure durability of the emission levels. These controls should be performed within a mileage or a period of time dependent on the type-approval of the engine or vehicle. The time span and mileage the vehicle must pass are getting more rigid every time a new Euro-standard is released and at the moment the regulations are as following seen in Table 210.
9
http://www4.scania.com/en/globalengineplatform/START/?ineuro=3&invehicle=bus#start
10
http://www.dieselnet.com/standards/eu/hd.php
Table 2 Increase of emission durability periods from Euro 5 to Euro 6. Figure 1 Progression of PM and NOx since Euro 3
5
1.2.2.2 On-Board Diagnostics - OBD
On-Board Diagnostics is the term for a central system supporting the user to identify malfunctions on the vehicle´s sub systems. Information about the engine status, its malfunctions and the identification of the problematic area are stored on a memory and will be available for off-board analysis through an accessible interface.11
1.2.2.3 Requirements and tests
To ensure the correct exhaust emission levels, the manufacturers should equip vehicles and engines with components that reduce the emissions in order to fulfill the legislations. This should be performed without usage of any types of external defeat strategies to reduce effectiveness of the emissions control equipment.
The European Commission provides legislative levels and procedures within the following areas:12
Tailpipe emissions, including test cycles.
Crank house emissions.
OBD-systems and in-service performance of pollution control devices.
Emission durability control devices for conformity of in- service engines and vehicles.
CO2 emissions and fuel consumption
Granting extension of type approvals
Testing equipment
Reference fuels e.g. petrol, diesel etc.
Measurements of engine power
Correct function and regeneration of pollution control devices.
Specific provisions to ensure the correct operation of NOx control
measures.
11
REGULATION (EC) No 595/2009 OF THE EUROPEAN PARLIAMENT AND OF THE COUNCIL, EEA, European Comission
http://eur-lex.europa.eu/LexUriServ/LexUriServ.do?uri=OJ:L:2009:188:0001:0013:EN:PDF
12
6
1.2.2.4 Access to information
Manufacturers are obligated to provide unrestricted and standardized access to vehicle information to independent operators. The information provided shall include tools containing relevant software, service and maintenance information.13
1.2.2.5 Financial Incentives
To meet the obligations the member states within the European Union may provide financial incentives. These should then apply on all new vehicles at the actual state‟s market. If the obligations are not fulfilled the state may also put financial incentives for retrofitting vehicles in use and scraping vehicles that do not comply with the regulation. The occurrence of any financial incentives as well as changes has to be reported to the European Commission.14
1.3 Obligations for manufacturer
The ability for the manufacturer to ensure that all criteria is fulfilled, according to the Euro 6, requires critical improvements in the development of the power train. To meet these specifications and avoid legal restrictions provoking the production, action has been taken throughout the whole development process.
A crucial part of the Euro 6 regulation is to assure the Conformity of Production (COP) and the In-Service Conformity. Non-compliance of these can imply complete delivery-stop and processes for re-certification. Additionally, the approving authorities may prescribe campaigns to adjust all already delivered vehicles. The ISC contains regulations concerning the sustainability of emissions on the current vehicle fleet. According to this, it is crucial to secure the product quality throughout the whole supply chain for ingoing components.
13
REGULATION (EC) No 595/2009 OF THE EUROPEAN PARLIAMENT AND OF THE COUNCIL, EEA, European Comission
http://eur-lex.europa.eu/LexUriServ/LexUriServ.do?uri=OJ:L:2009:188:0001:0013:EN:PDF
14
7
Scania performs a quality method called Design Failure Mode and Effect Analysis (D-FMEA), to ensure that all failure modes and effects influencing emissions are known. With this information everything in the design, affecting emissions, must be verified for its intended lifespan.15
1.3.1 Classification of Requirements – COR
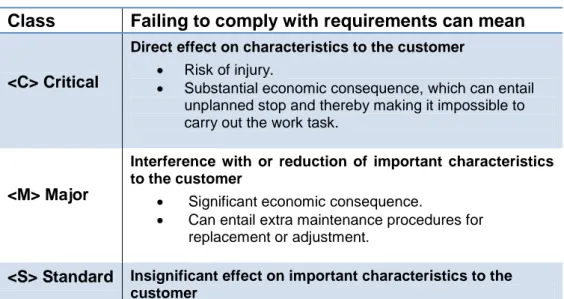
To assure the quality in every single step of the development each part is classified according to company standards based on the “ISO/TS 16949 7.2.1.1 – Customer-designated special characteristics” where the impact is described in the following classes in table 3:16
Table 3 Classifications of requirements - COR
Class Failing to comply with requirements can mean
<C> Critical
Direct effect on characteristics to the customer
Risk of injury.
Substantial economic consequence, which can entail
unplanned stop and thereby making it impossible to carry out the work task.
<M> Major
Interference with or reduction of important characteristics to the customer
Significant economic consequence.
Can entail extra maintenance procedures for
replacement or adjustment.
<S> Standard Insignificant effect on important characteristics to the customer
The reason for using classifications is to highlight the critical aspects as a support for a more robust construction. The purpose is to reduce the consequences from failure and thereby reducing the risk assessment of production. A company presentation for guidelines used in this work process is seen in Appendix 1.
15 RTPM Irene Ericsson; “Euro 6, COR & FMEA – Vad innebär det för oss?” PowerPoint
Scania Inline 2011-06-13
16
RTPM,Kent R Johansson & RTPM Irene Ericsson; “STD3944 Classifications of requirements - COR”; Scania Inline 2007-10-24
8
Scania´s classifications for ingoing parts in the engine development are shown in Appendix 2. Where the emission is classified as <C> critical due to the earlier mentioned case of forced production stop.17
1.3.2 PEMS
The regulations of In Service Conformity are mandatory for all vehicles produced and classified as Euro 6. These obligations for Scania are to secure sustainable regulations for exhaust emissions, and the company is obligated to perform on-road measurements. According to the European Commission, these measurements are to be performed with support from a Portable Emission Measurement System (PEMS).
Testing is done by sampling the tail pipe emission together with data from the vehicles OBD as well as GPS positioning data for the route driven. Samples have to contain enough data to be suitable to measuring the levels of NOx, CO, CO2, HC as well as the amount of
PM. The equipment for this analysis is today using a gas analytical approach where the emission sample is combusted by supportive gases inside the analyze equipment with a method called flame ionization detection (FID).18
17
RTPM,Kent R Johansson & RTPM Irene Ericsson; “STD3944 Classifications of requirements - COR”; Scania Inline 2007-10-24
18 C. Weaver, P.E. Ravem System Technical Summary Version 3.1 Febuary 2006.
9
The method and equipment includes the following equipment:
PEMS emission analyzer seen in figure 2.
GPS module.
External power source.
Emission pipe, including pre-heating wire.
Tail pipe adaptor including sensors.
Three supporting gas tubes.
Wiring for OBD data sampling.
This equipment is primary mounted at the foundation of the passenger seat. Wiring and emission pipe are drawn through the unused transfer for the steering axel at the passenger side of the cabin. The external power generator is externally placed behind the cabin and straps onto the frame of the chassis mount the tail pipe adaptor.
Sample data is recorded throughout the test time and analyzed by support of software calculations to ensure correct values for the measured vehicle.
10
1.4 Problem description
The new emission regulations concern all actors in the automotive industry, which are working hard to fulfill the Euro 6 requirements. The new standards will increase the demand and testing on vehicles in order to verify the emission limits as well as to maintain license for production and distribution of vehicles within the European Union. Today, Scania is using a temporary and limited testing method for on-road measurements (PEMS), performed externally from the production line. The company requires development of a new reliable testing method and routines that can be implemented as a process of the production line.
By reviewing the present assembly processes, flows, legal requirements and demands from the power train department, At the moment Scania see‟s a gap between the existing processes and is interested to have them evaluated and reviewed. The knowledge could later be used to develop future reliable, sustainable solutions.
1.5 Purpose
The purpose of this master thesis is to review the possibilities for a future industrialized solution suitable for production flow including recommendations for:
A technical solution for testing and handling of data.
Work descriptions for performing the measurements as well as responsibilities between the stakeholders.
Method and process description for testing a mounted vehicle
Cost descriptions (investment, handling/mounting time etc.).
Establish work descriptions for any implemented processes or operations.
The thesis should follow a logic pattern and investigate the current situations and demands in order to find a possible solution for implementing the requested measurements. The master thesis
11
should result in a suitable recommendation of how this work should be performed within the Scania assembly line.
1.6 Delimitations
Focus of the review will be to map the processes at the assembly line as well as the routines for PEMS according to the internal interests of finding possible synergies for a future coordination. European emission classification standards include all types of road-based vehicles including buses and trucks. Due to the fact that SCANIA Södertälje only build busses as semi-produced chassis for further assembly at future tiers are exclude them from our analysis. PEMS-measurement as verification for on road emissions measurements on vehicles delimits the review to the production area for final assembly. Therefor the processes of interest will be focused on sections close to the end of line (EoL) and until the point of customer delivery.
NMET, the division for sustainable emissions and performance, is responsible for testing of audited vehicles from the production and liable for methods used to meet specified criteria‟s for PEMS.
The main processes of the two departments are individually defined and the goal is to find a suitable coordinated solution. The focus will be on the methods used for PEMS measurement and fulfilling specified test criteria, excluding ingoing technical specifications concerning the equipment.
1.7 Objective
The objective of this master thesis can be divided into two different subjects, which booth can be down structured into separate sub goals:
12
1. Mapping of the current situation
1.1 Clarification of the PEMS measurement process and the existing processes handling the complete vehicles in order to increase the understanding.
1.2 Review of the processes, activities and procedures.
2. Redesign for feasible processes.
2.1 Resulting in an improved technical method for testing and handling inbound and outbound information for PEMS usage.
2.2 Clarify new resources and work responsibilities between relevant processes. Estimation of costs related to the redesign that might include investments, handling costs, mounting time etc.
2.3 A presentation and a scientific article to the improved redesign.
If the result shows that there is not any suitable solution of integrating the PEMS measurements into the existing processes, there should be a recommendation of how to conduct the test in an alternative way supported by theoretical guidelines for change management.
To validate the outcome of the research, the result will be presented and briefed in terms of the actual and future status of the PEMS situation. This information will be given throughout two separate seminars, in focus groups, for the stakeholders involved in the PEMS project at Scania Södertälje.
13
1.8 Outline of the report
In order to make the reading as logical as possible the report follows in chronological order. Every chapter has a short introduction with a laconic summary of the content and aim.
Here follows an outline of the chapters:
Chapter 1: Introduction, the first chapter introducing the company, the problem description followed by the purpose of the thesis and at last explaining the structure of the report.
Chapter 2: Research Methodology, explaining and describing the methods used throughout the report, used for collecting data and the underlying theory for the further analysis.
Chapter 3: Frame of Reference, introduces theoretical frameworks concerning the fundamentals of a systematical approach in change implementations and management of organizations. Presenting the benefits and possible gaps in the transformation phase that have to be considered to succeed with the future outcome of an implementation.
Chapter 4: Methods, Introduction and description of the different methods and analyzing tools that have been used. They are introduced with a short history, followed by an explanation of how the methods are administered and how to render the potential outcome.
Chapter 5: Analysis, presents the ingoing analysis of the current processes and concept evaluations. The analysis is based on the information from previous data collection methods and conducted with the help of the frameworks presented in the methodology chapter.
14
Chapter 6: Conclusion and Result, presents conclusions based on the gathered information from the previous analysis. The conclusion regards the possibilities of a future process redesign suitable for PEMS measurements in the production flow. The results are completely based on the present situation and matched by best feasible solutions.
Chapter 7: Discussion and follow up, debates how well the purpose of the thesis is fulfilled. Presentation of general conclusions for future alternative measuring concepts and process coordination methods that would contribute to Scania future progress with Euro 6. The future work is complemented by a theoretical framework for change implementations.
References
15
2 Research Methodology
This chapter is conducted for explaining and describing the terminology of research methods used throughout the report. Explaining methods used for collecting data and the underlying theory for research structure for the further analysis
2.1 Scientific approach
Research methodology is seen as the map for using appropriate tools to realize the paradigm and guide your research through a systematic path. As logistical research areas more often are ill structured real world problems, multi disciplinary and cross-functional approaches are necessary to describe the situation. Used as a helpful strategy to guide the process towards a satisfying result. Factors that influence the researchers choice of method would be:19
The format of the questions asked (i.e. “what”, “how”. “who”, “why” etc.) which requires different adequate tools for
answering.
Description of the nature of the researched phenomena
The extent of control required over behavioral events in the research context
The researchers philosophical stance and understanding of the social reality of the phenomena
To answer these objectives, it is necessary to choose an appropriate path for methods used in the research.’
2.1.1 Paradigm
To determine a primary picture of a given problem description it is crucial to express and explain the world-view to make a clear paradigm. This is done to see booth the potential and limitations of the different forms of research methods that will be used.
19
R. Frankel, D. Näslund, Y. Bolumole, „The white space of logistics research: A look at the role of methods usage‟, Journal of Business Logistics, Vol. 26, No. 2, 2005, pp. 185-208.
16
“ A research paradigm consists of beliefs about knowledge, whereas research methods are specific ways of gathering data. Paradigm is
our world-view, the lenses through which we view the world- our Weltanschuungen (Chekland 1993)”
The paradigm is easiest structured into three separate elements. Ontology, describes the nature of reality and the existence of the researched object. Secondly epistemology deals with how we perceive the world and how the researchers interpret their view to their environment. At last the methodology influenced by the ontology and epistemology describes the way of how we gain knowledge about the researched object.20
2.1.2 Analytical approach
In the perspective of an analytical approach there is an objective reality in which patterns and casual relations can be investigated through the research process. The researcher is supposed to stay outside the research object and refrain from interacting with it in order to avoid exerting an influence and hence distort the reality he or she is trying to disclose. The basic theory of this atomistic approach is that the world can be analytically decomposed into small elements and that each element can stand alone. In order to approach reality methodologically, researchers are supposed to decompose reality into the smallest possible elements, transform these elements into concepts and finally try to find cause-effect relations by hypothesis testing.21
20
R. Frankel, D. Näslund, Y. Bolumole, „The white space of logistics research: A look at the role of methods usage‟, Journal of Business Logistics, Vol. 26, No. 2, 2005, pp. 185-208.
21
Britta Gammelgaard, (2004),"Schools in logistics research?: A methodological framework for analysis of the
discipline", International Journal of Physical Distribution & Logistics Management, Vol. 34 Iss: 6 pp. 479 - 491
17
2.1.3 Systems approach
Describing the world from a system‟s approach, dividing reality into parts is meaningless. According to the system‟s theory the world must be understood in terms of mutually dependent “components”, as a system with parts, links, goals and feedback mechanisms. The more holistic view in a system‟s approach for the researcher is to describe and bring understanding of the relations among and between the included parts and activities performed at the given part of the world. As the primary purpose of a systems research is to improve or develop a solution that works in practice. The pragmatism of the systematical approach implies that the researcher has closeness to the object. The final result more often is an improvement of the actual research objects used in practice. The researcher should if possible influence the object during the time of research.22
2.1.4 Actors approach
With the perspective that the reality is not objective, but the result of social constructions, the actors approach differs completely from the analytical- or systems approach. Reality is rather seen as a construction and knowledge is perceived as socially constructed by the interpretation of the researcher. In order to understand the object the researcher should, if possible, be a part of the objects‟ reality to understand and construct the future from inside the process. The approach is highly dependent on the context and argues that it is impossible to make any predictions based on external cause-effect relations. This is based on the intentionality of human beings. According to this, the understanding of the reality of the research objects environment primarily requires a qualitative study of the intentions.23
22
Britta Gammelgaard, (2004),"Schools in logistics research?: A methodological framework for analysis of the discipline", International Journal of Physical Distribution & Logistics Management, Vol. 34 Iss: 6 pp. 479 - 491
23
18
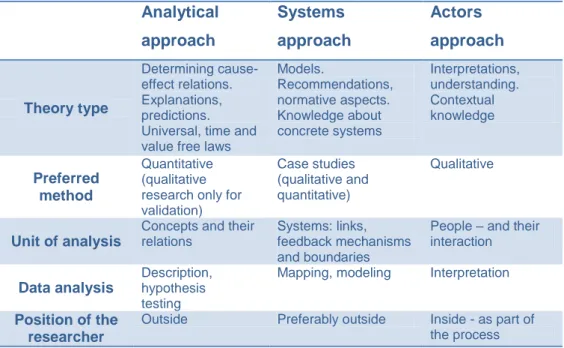
Table 4 The Arbnor and Bjerke framework
Analytical approach Systems approach Actors approach Theory type Determining cause-effect relations. Explanations, predictions. Universal, time and value free laws
Models. Recommendations, normative aspects. Knowledge about concrete systems Interpretations, understanding. Contextual knowledge Preferred method Quantitative (qualitative research only for validation) Case studies (qualitative and quantitative) Qualitative Unit of analysis
Concepts and their relations
Systems: links, feedback mechanisms and boundaries
People – and their interaction
Data analysis
Description, hypothesis testing
Mapping, modeling Interpretation
Position of the researcher
Outside Preferably outside Inside - as part of
the process
The review of the organizational structure and its processes brought us closer to the research object. Major parts are conducted from inside the organization, during the time at Scania (fall 2012), as a part of an ongoing project we used an mixture of the ingoing elements described in the multi methodical approach to describe our project according to the Arbnor and Bjerke framework.24
24
Britta Gammelgaard, (2004),"Schools in logistics research?: A methodological framework for analysis of the discipline", International Journal of Physical Distribution & Logistics Management, Vol. 34 Iss: 6 pp. 479 - 491
19
2.1.5 Quantitative vs. Qualitative
The methodologies generally range between the more objective, scientific (quantitative) to the more subjective or more constructive (qualitative). The more objective, scientific research methodologies dealing with quantitative statistical data are designed to quantify how a phenomenon responds to changes and stimuli in its environment. The qualitative research methodologies are based in the social sciences to be able to study social and cultural changes. The qualitative research is seen as multi methodic and has an interpretive naturalistic approach to its subject in its natural settings. The research involves collection of a selection of empirical materials such as observations, interviews, interactions, case studies, personal experiences and visual texts describing and visualizing the reality for the spectator.25
Qualitative research is according to lack of multi method research often criticized of being to exploratory and objective and therefore more seen as journalism. As mentioned earlier it is crucial to know that the world can only
“be understood from the point of view of the individuals who are directly involved in the activities which are to be studied”
(Denzin and Lincoln 1994).26
On the other hand, quantitative research often gets criticized for the fact that analyzes tend to seek for casual relationships in correlation with the pre stated hypothesis. Concerns are made that data can be clouded due to the fact of unsuitable sample sizes and that the complexity of suitable methods are difficult to find.
25 D. Näslund, (2002), “Logistics needs qualitative research – especially action research”,
International Journal of Physical Distribution & Logistics Management, Vol 32, Iss: 5 pp. 321-338
26
(2)R. Frankel, D. Näslund, Y. Bolumole, „The white space of logistics research: A look at the role of methods usage‟, Journal of Business Logistics, Vol. 26, No. 2, 2005, pp. 185-208.
20
A. Bryman & E. Bell have constructed a graphical table that generalizes the different aspects to enlighten the differences between the two characteristics in researchers approaches. This should be seen as a tool to differentiate the differences due to the fact that a multi methodical approach uses parts from both of them to describe the world as naturalistic as possible.27
Table 5 Fundamental differences between quantitative and qualitative research strategies
Quantitative Qualitative
Principal orientation to the role of theory in relation to research
Deductive; testing of theory
Inductive; generation of theory
Epistemological orientation Natural science model, in particular
positivism
Interpretivism
Ontological orientation Objectivism Constructionism
2.2 Data collection
Collection of appropriate data is crucial to completely cover all aspects of a researchers object and be able to obtain reliable data for further analysis. As modern logistical research strives to develop according to Frankel et al. by trying to balance the “white space” it is necessary to be open minded and question paradigms and usage of research methods by challenging the knowledge and choice of data sources. The benefit of multiple sourcing and different methods for
27
Alan Bryman , Emma Bell, Business Research Methods, 2nd Edition Oxford University Press 2007
21
collection is to see what kind of synergies each method could give and how they possibly can complement each other. No single source or method for collection has a complete advantage over another and not all methods are suitable for all cases of research.
Frankel et al. identify eight primary methods for data collection, surveys, interviews, observations, focus groups, case studies, experiments, literature review and content analysis that further will be described to obtain a deeper knowledge of the benefits of using them.28
2.2.1 Surveys
Surveys are a structured method for data gathering in form of a predefined questionnaire. The questions are preferable defined in a way so that the researcher can access and analyze the data. The administration for data collection can differ in form from non- electronic to electronic including web-based solutions or e-mail surveys.29
We have chosen to see the survey tool as a complement to our work in focus groups where we constructed a suitable model of the Process and Enterprise Maturity Model. As a part of the workshop, we guided the participants through a structured questionnaire to let the process owner judge his or her process in terms of a reliability scale for the statements.
2.2.2 Interviews
Interviews are a suitable source for data collection covering a variety of formats but with a design suitable for a personal meeting between an interviewer and respondent. The structure of an interview varies from un-structured, semi-structured to completely structured in format. The benefit of using different format of the interview is that
28
R. Frankel, D. Näslund, Y. Bolumole, „The white space of logistics research: A look at the role of methods usage‟, Journal of Business Logistics, Vol. 26, No. 2, 2005, pp. 185-208.
29
22
the interviewer has the opportunity to choose how specific and controlled the data will be depending on the “depth” in the used questionnaire. The completely structured interview can be described as a verbal survey with fixed response options, to the opposite where the purpose of the interviewer is to uncover underlying motivations, attitudes and beliefs etc. The differences from an interviewer‟s perspective is that in less “depth” interviews the data are more comparable, due to the low grade of involvement, and underlying intentions of the interviewer is less important for the result.30
Throughout the project, more or less structured interviews have become one of the most valuable tools to proceed forward. The complexity of the project involving several divisions with unclear motives of the projects purpose has contributed to use interviews as the most powerful tool. In the initial phase as a source for information concerning basic understanding and knowledge described as primarily data collection. As interviews are an excellent
30
R. Frankel, D. Näslund, Y. Bolumole, „The white space of logistics research: A look at the role of methods usage‟, Journal of Business Logistics, Vol. 26, No. 2, 2005, pp. 185-208.
Figure 3 Interview structure
Phase 1 Unstructured Phase 2 Structured Phase 3 Semi Structured
23
tool for building personal connections the incentive throughout the project was to use the network for quick responses. This was used for supporting more structured questions often through e-mail related as a second phase of interviews.
In the third phase, the interviews provided support and validation in the proposals for a future redesign and brought the researchers to a more influential position.
2.2.3 Observations
The purpose of an observation is to objectively collect information and get insight by ocular or participation in the phenomena of interest. The case could be of different kinds of nature such as behavioral patterns of people, objects and events in a systematic manner. The role as an observer can vary from a perspective where the observer completely observes without interfering to complete participation. The major difference is that the participant is supposed to be a part of the ongoing process and is supposed to communicate and behave as an ordinary member of the organization.31
There are some criticisms dealing with the concerns that an observer‟s involvement are affecting with the nature of the phenomena and are known as the observer effect.32
Primary parts of the thesis concern the mapping of dependencies and obstacles. In this case, between well industrialized established and new, less established processes and the probability of a future coordination. Starting with observations booth as complete observers and as participants to get familiar to the nature of the daily routines on the line.
31R. Frankel, D. Näslund, Y. Bolumole, „The white space of logistics research: A look at
the role of methods usage‟, Journal of Business Logistics, Vol. 26, No. 2, 2005, pp. 185-208.
32
D. Coon, J. O. Mitterer ,Introduction to Psychology: Gateways to Mind and Behavior, 12th Edition, 2010
24
2.2.4 Focus groups
Focus groups are conducted by a trained moderator among a small group of respondents with a purpose to gain insight by listening and talk about issues concerned by the researchers. It is usually done in a group of people from appropriate markets or divisions in the organization.33
The project is performed from the chassis division point of view with interests in work methods and specifications from R&D and focus groups has therefor been an excellent forum for cross-functional discussions. Especially as a fact to support all members involved being able to gain knowledge and discuss the common problem areas.
2.2.5 Literature review
Literature reviews involve an in-depth analysis and critical summary of other authors‟ previously collected data, i.e. secondary data.”34
The main purpose for the literature review was to build a solid understanding of the variables and aspects concerning how the different ingoing divisions in the project viewed and evaluated their processes and requirements. The result from such review in combination with interviews and observations is to be able to find a research gap where future studies are needed to be addressed. A part of this work has been to review the process documentation to collect valuable knowledge for future improvements and to be able to guide the process owners during the maturity evaluation.
2.2.6 Content analysis
The definition of content analysis is somewhat correlated to observations. Despite that it is seen as a separate part justifies its placement as a separate category for data collection. Content analysis concerns the reviews of documents, websites, archival
33R. Frankel, D. Näslund, Y. Bolumole, „The white space of logistics research: A look at
the role of methods usage‟, Journal of Business Logistics, Vol. 26, No. 2, 2005, pp. 185-208
34
25
records, organizations intranet content and documented routines etc. Content analysis is beneficial for processing an objective picture of the object or organization from a broad perspective.35
The primary use of content analysis was to get familiar with the infrastructure of the organization and to find the right sources for information. Access to Scania In Line has provided the project with knowledge of the separate divisions suitable for the research. Scheduled appointments with people involved in the project contributed with the basic information about the assignment and a better foundation of the ingoing areas for the problem description. The second phase has been to find sources for data to build a more structured analysis of the information needed for future methods and analysis.
35
R. Frankel, D. Näslund, Y. Bolumole, „The white space of logistics research: A look at the role of methods usage‟, Journal of Business Logistics, Vol. 26, No. 2, 2005, pp. 185-208.
26
2.3 Trustworthiness and authenticity
Scientific research in the logistical field is based either on quantitative or qualitative data, or as a combination of the two. It has a major importance to guarantee trustworthiness and credibility of the final result. This thesis mainly focuses on a qualitative approach. The evaluation of trustworthiness and authenticity is highly concerned and explained more thoroughly.36
2.3.1 Induction, deduction and abduction
There are mainly two methodical approaches used when analyzing data, the inductive approach and the deductive approach. An inductive approach implies that the research data is analyzed in order to create a theory and the deductive approach works the other way around by verification of theory through empirical research. The researcher should, on the basis of what is known about a particular issue, deduce a hypothesis that must be subjected to empirical scrutiny.
Criticism about the methods is given and in particular that an inductive research face the fact that the theory created will not contain anything that is not presented in the empirical data. An inductive approach is however useful when exploring new fields of knowledge.37
As research attempts to develop a combined method of the two commonly known as abduction. The two methods provide a logical reasoning where existing theories are used for the analysis at the same time as the researcher can use the empirical data to find new relationships.
36
Alan Bryman , Emma Bell, Business Research Methods, 2nd Edition Oxford University Press 2007
37
27
2.3.2 Reliability
The fundamental concern of reliability deals with the issues of the consistency of measures. The statement of the reliability in research follows three prominent factors.38
Stability - asking if the confidentiality of the measures is stable over time and the determination if the respondents fluctuate.
Internal reliability - concerning if the scale or index for indicating the measures are consistent.
Inter-observer consistency - treats the content of subjective judgment involved in analyzing and categorizing of the measured variables and their behavior.
2.3.3 Validity
“Validity refers to the issue of whether or not an indicator (or set of indicators) that is devised to gauge a concept really measures that concept.” 39
2.3.4 Authenticity
Authenticity concerns a wider political impact of the research and refers to whether the research fairly represents different perspective observed. The concept of authenticity can be described in four different aspects.
Ontological authenticity concerned about if it help members to get a better understanding of their social environment.
Educative authenticity concerns or helps the members appreciate the perspectives of other members of their social situation.
Catalytic authenticity refereeing to if the research has provided members with an incentive to engage in action.
38
Alan Bryman , Emma Bell, Business Research Methods, 2nd Edition Oxford University Press 2007, p410-411.
39
28
Tactical authenticity dealing with the fact that members has been empowered to take the necessary steps to change their circumstances.40
2.3.5 Credibility
Credibility also described as the internal validity of a research describing concerns whether there is a good match between the researchers observations and the theoretical ideas they develop.41
2.3.6 Transferability
Transferability refers to the degree of which the findings of a result hold in another context or even in the same context at future research. Qualitative findings usually tend to be oriented to the contextual aspects of the case or social event studied and it is therefore important to provide a thick and detailed picture of the fundamental concepts to be able to provide the reader with sufficient information for making judgments about transferability to other environments.42
2.3.7 Dependability
Dependability concerns the statement of whether the results of a study are repeatable for future evaluations and case studies. It is the basic foundation for trustworthiness for the research and set the criteria for well-documented methods and documentations of the work processes.43
40
Alan Bryman , Emma Bell, Business Research Methods, 2nd Edition Oxford University Press 2007, p. 414
41
Alan Bryman , Emma Bell, Business Research Methods, 2nd Edition Oxford University Press 2007, p.411-412.
42
Alan Bryman , Emma Bell, Business Research Methods, 2nd Edition Oxford University Press 2007, p.413-414.
43
Alan Bryman , Emma Bell, Business Research Methods, 2nd Edition Oxford University Press 2007, p.414.
29
2.3.8 Conformability
Conformability concerns the fact that the research is completely objective and as much as possible ensuring that the researcher has acted in good faith. Stating that it should consequently be evident that the researcher has not permitted personal values or influences from the researched object to modify the behavior of the research and the findings derived from it.44
2.4 Strategy of research
Figure 4 illustrates the approach conducted in the research and is a part of the first outline from the given problem description. Visualization of the ingoing parts in the initial problem description showed out to be a very useful tool when aligning and verifying the expectations and strategy with the supervisors at Scania.
The basis of the strategy is to work with two different tracks at the same time and keep them as separated as possible. This was done to eliminate intentions and to stay objective and not influence the processes “As-Is”-state. The two different tracks are shown as Phase I and Phase II in the figure.
Phase I: Reviews the current situations and processes of relevance for the areas of the final chassis assembly including flows from the end of assembly until customer delivery.
Phase II: Analyses the process for emission measurement and how it is, should and preferably could be performed according to requirements and regulations. This phase will include comparison with similar measurement systems as well as technical concept evaluation, interviews and observations.
Phase III: Develops and evaluates the new redesign of the PEMS process that will be suggested to fit within a suitable flow at the production facility
44
Alan Bryman , Emma Bell, Business Research Methods, 2nd Edition Oxford University Press 2007, p.414.
30
Phase IV: If possible and if time is given, the strategy is to further develop the process mapping with documentations for the specific work descriptions and routines.
The four phases are conducted with the earlier mentioned ways of collecting data and later on analyzed and evaluated with suitable tools and methods. The double-headed arrows correlate with the process of continuous improvements and are meant to show that research is not conducted as a straight path, but as continuous audits of the work process. A theoretical framework highlighting the current situation and how to establish a change process will support recommendation of future progress in change management.
2.4.1 Method of analysis
The strategy of research shows the four different phases of the approach during the thesis. Enabling the research, these phases have specific features and methods connected to them.
The first two phases are similar, with the difference of the focus area. The phases are mainly conducted through process mapping and process description. Collecting data combined with observations and informal interviews will give an understanding for the processes, which will result in process maps and a detailed process description.
Interviews Observations Focus groups Content Analysis Analysis of processes Concept Evaluations Process redesign Phase I Phase II
Phase III Phase IV
P ro je ct P la n In d u st ri al iz e d P EM S Timeline
31
When processes are mapped, the next phase could start. The third phase‟s purpose is to compare the maturity of the processes and visualize if they are compatible for a future implementation. The method for evaluating the maturity of processes is called Process and Enterprise Maturity Model, PEMM. The main focus with the model is process redesign and comparison between processes; this will be supplemented with conceptual evaluation for different PEMS solutions being developed in parallel.
The final phase will be to estimate a business case including investments, and resources connected to the redesign.
33
3 Frame of reference
This chapter introduces theories concerning the fundamentals of a systematical approach in change implementations and management of organizations. Presenting guidelines for the work performed in future organizational changes.
3.1 Eight steps to transforming your organization
Professor John Kotter has through years of experience in the field of change management and leadership studies achieved to translate his knowledge into a systematic framework. He proposes that managing a change is rather a significant method of leadership throughout what he calls the “Eight steps of transforming your organization”. He emphasizes that all organizational changes are described as a stepwise change where each completed step is a part of a time-consuming change process.45
The eight-step framework‟s purpose is to support the change initiative and clarify the activities of change. This is useful to help the organization to impart and visualize the concepts so that everyone gets familiar and involved within the change process. The systematical approach starts by establishing a sense of urgency for the transformation to support motivation and create a future “to-be” vision. Making a clear plan by visualizing possibilities and threats by using tools appropriate for benchmarking such as SWOT analysis etc. People with enough competence and power then communicate the new vision throughout the organization to realize it. To keep the change initiative actual and prioritized by the organization it is crucial to create credibility by showing short-term wins. This is done to convince the people involved that the goals set are achievable and works as a momentum for the future change implementations. The catalyst effect by the increased credibility of the visualized short term wins, should be further used for system as well as structural changes and policies that conflict with the new vision. As a final step of the framework, connections between the new behaviors and
45
34
corporate success should be articulated in order to make people believe in and embody these new approaches.46
Figure 5 Kotter´s Eight Steps to Transforming Your Organization
46
35
Stressing through or skipping one or more of the eight steps of the process is not recommended, and worth mentioning is that significant mistakes in any of the phases may cause devastating impact on the future result. Kotter (1995) states that:
“In reality, even successful change efforts are messy and full of surprises. But just as a relatively simple vision is needed to guide people through a major change, so a vision of the change process can reduce the error rate. And fewer errors can spell the difference
37
4 Methods
In this chapter the different methods and tools that have been used throughout the review and analysis are described as a foundation for our further evaluation and development. They are all introduced with a short history, followed by an introduction and an explanation of how the methods are administered and how to render the potential outcome.
4.1 Process mapping
To clearly understand the methodology about process mapping it is crucial to be aware of the basic foundation of a process and according to Ljungberg et.al, a process can be defined as.
“A process is a repetitive used network of in order linked activities supported by information and resources to transform “object in” to “object out” from identification to satisfaction of the customer needs”
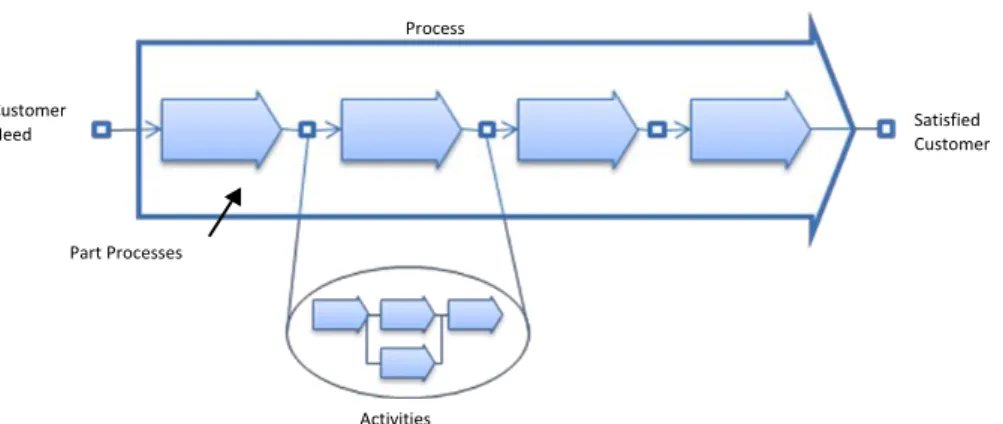
4.1.1 The components of a process
A process is in most cases connected to systems together with other processes as a part of a bigger system. These can be on different levels, upper or lower according to the studied process or even at the same level. The common factor is that all processes can be divided into part processes or directly into activities shown in figure 6. The main objective is to transform the object in to a processed and refined version called object out or as a transformation of a need to a satisfaction. To clearly understand the ingoing components of a process, a shorter description of them are presented below.47
47
Larsson, E. & Ljungberg, A.:Processbaserad verksamhetsutveckling.Studentlitteratur, Lund, 2001. P206-209
38
Object in - is a central part of a process. The object in is the trigger
for the process as well as for the ingoing activities. Without an object in the process or activity it is not possible to start. Ljungberg (2001) also enlightens that the correctness of the object in is crucial for the future result of the process output.
Object out - is commonly known, as the earlier mentioned output of
the process and is the result of a processed and refined object in.
Activities - are defined as the operations done to refine the input in
this case the object in.
Resources - is the material or work that is consumed to transform
an object in through the process to refine it to an object out. Ljungberg (2001) describes the resources as48
“what effort that is necessary for an activity to be performed”
48
Larsson, E. & Ljungberg, A.:Processbaserad verksamhetsutveckling.Studentlitteratur, Lund, 2001. P206-209
Customer
Need SatisfiedCustomer
Process
Part Processes
Activities
39
The ability to map processes in an effective and relevant way is supported by a structured and well-known workflow. This framework is not only effective, but also helpful to eliminate common mistakes and errors, such as:
Activities are stacked on top of each other without any good definitions and reflections.
Early focus on details.
The initial phase until the mapping gets stated is too long.
The improvement phase of the map is getting started before the As-is is defined.
In order to eliminate and minimize this type of mistakes, the following approach is used when mapping the different processes:49
1. Define the purpose of the process with start- and endpoint.
Before the initial phase of mapping the process it is recommended to know the conditions and the scope for the process. Therefore it is important to define the total purpose of the process and follow up with the start and the end.
2. Brainstorm all the activities and document them.
It can be difficult to define all the activities within a process by brainstorming. Performing the activity identification as a team usually simplifies the task. Doing this together is also a good way to gain different views from the participants to clarify the activities. Using for example post-it notes it is easy to get an overview and rearrange and to modify the activities if necessary.
3. Rearrange the activities
It is an important step to test and modify the activities to find the most feasible solution. The aim is to clarify all activities and its ingoing purposes of the present situation.
4. Merge and add activities
49
Larsson, E. & Ljungberg, A.:Processbaserad verksamhetsutveckling.Studentlitteratur, Lund, 2001. P206-209