Master Thesis Project 15p, Spring 2019
FROM CHAOS TO ORDER: A study on how data-driven
development can help improve decision-making
By
ANNWESH MUKHERJEE
TERRY TERRY ILEBODE
Supervisors:
Helena Holmström Olsson
Examiner:
Johan Holmgren
2
Contact information
Author:
Annwesh Mukherjee
E-mail: annwesh.mukherjee@gmail.com Terry Terry Ilebode
E-mail: terryilebode6@gmail.com
Supervisors:
Helena Holmström Olsson
E-mail: helena.holmstrom.olsson@mau.se
Malmö University, Department of Computer Science and Media Technology.
Examiner:
Johan Holmgren
E-mail: johan.holmgren@mau.se
3
Abstract
The increasing amount of data available from software systems has given a unique opportunity for software development organizations to make use of it in decision-making. There are several types of data such as bug reports, website interaction information, product usage extent or test results coming into software-intensive companies and there is a perceived lack of structure associated with the data. The data is mostly scattered and not in an organized form to be utilized further. The data, if analyzed in an effective way, can be useful for many purposes, especially in decision-making. The decisions can be on the level of business or on the level of product execution. In this paper, through a literature review, an interview study and a qualitative analysis we categorize different types data that organizations nowadays collect. Based on the categorization we order the different types of decisions that are generally taken in a software development process cycle. Combining the two we create a model to explain a recommended process of handling the surge of data and making effective use of it. The model is a tool to help both practitioners and academicians who want to have a clearer understanding of which type of data can best be used for which type of decisions. An outline of how further research can be conducted in the area is also highlighted.
Keywords: Data-driven development, Agile methodologies, Waterfall model, Continuous
Integration, Continuous Deployment, A/B Testing, Test Driven Development, Product data, Customer feedback
4
Acknowledgement
For this study we are greatly thankful to our supervisor, our examiner and the reviewers of our report. We thank the participants who took part in the interview study and gave us their valuable inputs. Above all, we thank our respective families, the student group of the One Year Masters’ Program in Computer Science at Malmö University. Last but not the least, we thank the entire faculty for helping us learn several new topics related to Software Engineering and Computer Science during the past one year.
5 Table of contents 1 Introduction ... 9 1.1 Background ... 12 1.2 Motivation ... 13 1.3 Research Questions ... 15 2 Literature Review ... 16
2.1 Data and data-driven development ... 16
2.2 Generation, collection/storage and analytics... 17
2.3 Organizational perspective on data-driven development ... 20
2.4 Software development practices enabling data-driven development ... 21
2.4.1 Agile Development Methods... 21
2.4.2 Continuous integration (CI) ... 22
2.4.3 Continuous Deployment (CD) ... 22
2.4.4 Test-driven Development (TDD)... 23
2.4.5 A/B Testing ... 24
2.5 Factors to Consider in Data-Driven Development ... 26
2.6 Opportunities of data-driven development ... 27
2.6.1 Agility in decision-making due to the presence of evidence... 27
2.6.2 Evidence resulting in quicker decisions ... 28
2.7 Challenges of data-driven development ... 30
6
3.1 Research Philosophy ... 32
3.2 Research Approach ... 33
3.3 Research Methods ... 34
3.3.1 Literature review study ... 35
3.3.2 Interview study ... 36
3.3.3 Qualitative Analysis ... 38
3.4 Threats to Validity ... 40
4 Results ... 41
4.1 General Understanding of Data-driven development ... 41
4.2 Decision-making process ... 46
4.3 Types of data ... 48
4.4 Tools & Processes ... 50
4.5 Confidentiality ... 51
5 Discussion ... 53
5.1 Different types of data with respect to domains ... 53
5.2 Categorization of Data ... 57
5.2.1 Category: Qualitative... 57
5.2.2 Category: Quantitative ... 58
5.3 Analysis of Data ... 60
5.3.1 Tools to collect data ... 61
5.3.2 Tools to synthesize data ... 62
5.4 Mapping types of data to types of decisions ... 63
7
5.6 Categorize Analyze Deduce (CAD) model ... 69
6 Conclusion ... 72
References ... 74
Appendix ... 82
List of Figures FIGURE 1:RESEARCH PROCESS ... 32
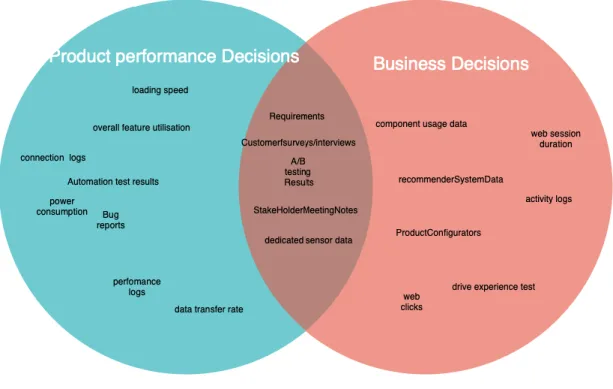
FIGURE 2:A MAPPING OF DATA TO DECISION-MAKING FACTORS ... 67
FIGURE 3:LEVELS OF DECISIONS IN ORGANIZATIONS ... 68
FIGURE 4:CAD MODEL ... 71
List of Tables TABLE 1:DIFFERENT STAGES OF DATA ANALYTICS (RAYES &SALAM,2016) ... 19
TABLE 2:SUMMARY OF PRACTICES ENABLING DATA-DRIVEN DEVELOPMENT ... 25
TABLE 3:PROFILE OF ALL PARTICIPANTS IN THE INTERVIEWS ... 38
TABLE 4:SUMMARY OF UNDERSTANDING OF DATA-DRIVEN DEVELOPMENT ... 45
TABLE 5:SUMMARY OF TOOLS USAGE ... 50
TABLE 6:PATTERN MATCHING TO FIND DOMAIN-LEVEL SEPARATION OF DATA... 57
8
List of acronyms
TDD Test Driven Development
DDDM Data-driven Decision-making CD Continuous Deployment BI Business Intelligence CI Continuous Integration SDLC SSD IOT
Software Development Life Cycle Solid State Drive
9
1 Introduction
The software development life cycle (SDLC) was introduced in the early 90’s as a way of standardizing software development. SDLC was created to manage and control software development (Sommerville, 2011). During the days of SDLC most organizations adopted a structured waterfall model of development mainly because of its strengths in manageability, ease of control and comprehensive documentation. In the waterfall model there used to be a division of tasks within dedicated teams. The teams used to handle the several stages of software development. The stages involved Requirements Handling, Analysis, Implementation, Testing and Release to name a few. There used to be handovers between teams as the flow of work went through these stages. With time, the weakness of this model became more visible, one of this was its rigidity to change (Carilli, 2013). The need for a more suitable adaptive approach to development arose to curb the deficiencies of the waterfall model especially with regards to speed of adopting changes to software.
The Agile methodology is one of the software development models that has been introduced in recent times to provide solutions to the pitfalls of the waterfall model. Development teams started to lean more towards agile methodologies. In agile, all stages were removed and instead the work responsibilities were entrusted to teams of cross-functional capabilities. The Agile methodology is very conducive to modern software development because of its ease of incorporating changes to design, its customer
10
centricity and its support to practices that allow iterative updates to software. Agile practices are deemed to be more appropriate to the fast-paced nature of modern-day software development. There has been a decrease of 17% in software time-to-market in companies that have adopted agile methods (Bossert, Ip & Starikova, 2015). Also, a study by the Standish group shows that projects that implement agile practices are three times more successful than non-agile projects (Carilli, 2013).
Due to the incremental nature of software development and frequent need for updates on software product, decision-making must be faster and more frequently made nowadays to be responsive to market demands. Decision-making on a software occurs throughout the software life cycle. Decisions vary in scale; there are more abstract decisions like those made from a requirement collection stage to more detailed decisions like font-size of a website made during the implementation stage. Most of these decisions are based on knowledge, experience or some collection of human factors. The time-frame for making these decisions has shortened; however, the accuracy of these decisions cannot be compromised mainly because of the existing competitiveness in the market. Inclusion of data to the other existing decision-making factors can be considered as an augmentation to the overall decision-making process.
Organizations can extract benefit from data in their decision-making process while developing software products (Perrey, Spillecke & Umblijs, 2013). There is also a perceived need of utilizing, for example, data scientists (Kim, Zimmermann, DeLine & Begel, 2016). According to Chen, Chiang and Storey (2012), data has provided an opportunity for better understanding of Business Intelligence (Chen, Chiang & Storey, 2012). It highlights the importance of analytics with regards to understanding of markets. When it comes to large organizations, over 97 percent of companies that made over 100
11
million dollars in revenue in 2011 incorporated analytics in their business model. However, because of the large quantity of data generated in recent times organizations require unique techniques to synthesize this data to find value from it (Chen, Chiang & Storey, 2012).
Technological advances have made it possible to gain more Business Intelligence with regards to software product development. We see a steadily growing need to involve customers as this has proven to be paramount to business success (Lundkvist & Yakhlef, 2004). Organizations need to factor data that relates to customers’ needs into their decision-making process for new and existing features to maximize value addition. The competitiveness of the software market means that organizations need to make more effective and efficient decisions bearing in mind the limitations in resources while at the same time striving for maximizing their profit margins. Another reason is to increase the speed of decision-making to match the sheer speed at which the global economy operates. This makes it important for managers to access “actionable data” which is in essence information that can be used to display performance metrics, understand customer behavior, and forecast market trends in a “real‐time” manner (Hedgebeth, 2007).
We conducted a literature study on data-driven development to understand the current practices in organization and get a better insight on the impart of data in organizations. To support the literature study, an interview study was also conducted with 10 professionals from various domains of software development. We gathered feedback on the types of data collected in organizations and the types of decisions made in those organizations. This was done to achieve a relationship between the types of data, what we can derive from analyzing these types of data and how to use these data to achieve
12
more effective and efficient decisions at several stages of software development. The study is targeted at software professionals that are involved in decision-making process. The model presented will guide them through how to involve data in their work process to make better choices. Furthermore, the study will also help academicians who intend to dive deeper into the relationship between data and its role in organizational success.
1.1 Background
Data-driven software development has gained popularity in recent years, mainly because of the ease of gathering customer feedback data and product data due to technological advances. Organizations see the value of involving data in their development processes to make products more customer-centric and efficient. Data is collected and analyzed throughout the software life cycle to implement changes that can continually improve the software. Data-driven software development is a technique of software development that believes in the fact that data collected about customers and the software product takes a central role in the applications that software developers create to maximize value (Laquer, 2017). Software over the last decade has increased its reach and impact on daily lives. Software is changing from being a computer-based entity to becoming an essential component present in most devices we use in our daily activities. Its growing trend does not just stop with software’s integration into devices. It expands its application-base within devices which are communicating with each other. As humans communicate via several languages, devices communicate via data transfer. Because of the increase in connectivity, we have a monumental increase in the data being generated and transferred (Marr, 2018). This increase in connectivity and data generation have opened a whole new frontier for software-intensive companies. Technology can now cater to,
13
understand and take advantage of this large amounts of data. This phenomenon also thus explains the recent surge in data sciences and disciplines around device-connectivity.
A blend of all types of data helps us understand customer and product behavior in a better way. A combination of data and other human factors in our decision-making can greatly improve the value of our product. In our study we establish a correlation between the types of data collected and how data can influence the decision-making on a product throughout its lifecycle.
1.2 Motivation
Gathering data from product or functionality in use has become easier. Connected systems, instrumented code resulting in capturing of user interactions, several tools collecting user behavior statistically have all contributed to the overwhelming flow of data into software development teams. To add to this, there are new technical tools such as social media, web interface etc. available to help in data collection. The data today is of large volumes, it is something that can be easily stored, and it is a factor from which valuable inferences can be made. From the days of finding information like how many bugs have been reported on a software product, or how many changes have been added to it or how many times the product has crashed, we have far more concrete, tangible, valuable, analyzable and presentable data. Even though the traditional forms of data collection like customer feedback calls, customer meeting notes, field test reports or error reports are still prevalent, newer software development practices have taken a leap forward and have ventured into more advanced areas of data collection from the actual product after it has been developed, delivered and deployed.
14
The challenge lies in the fact that software organizations working with data suffers from a perceived lack of structure. Even if a structure is conceptualized there are hurdles along the way to make it fully operational. The collected data gets scattered, it is handled in silos without a broad and overarching strategy, and it is often lost without deriving proper meaning and deduction from it. Besides, the unstructured data that is collected in the form of text, meeting notes etc. cannot be effectively analyzed using analytics tool. There has been some progress in this field too, however we are still a long way away. The more concrete data obtained from a software product during its real-time usage is easier to analyze as it is structured. In this case too, it is important to have a strategy and a method to look at and infer decisions affecting software development. To conclude, be it structured or unstructured, without a proper ordering of these various types of data it is rather difficult to make meaningful conclusion out of it.
Following the patterns of traditional methods of data collection as mentioned earlier, decision-making processes in software companies have been more opinion-oriented and sometimes even judgmental. In other words, more human factors, gut feeling, personal experiences and visionary form of decisions have been doing the rounds in these companies for long. The question is whether there has been a need for more information when taking decisions or making choices. While many professionals having the mandate to take decisions will say ‘no’, there ought to be some who will answer ‘yes’. People empowered to take decisions in software organizations have had their limitations in understanding the different factors that could be taken into consideration. Questions like – how many users actually used a certain feature or how much time did a certain user really spend on a certain web-interface as compared to one another or how many bytes of data actually went through a communication tunnel between two components sitting in two different systems connected in a certain environment have been of paramount
15
importance to understand end-user utility of a feature, ease of use of a feature or performance of a connected system. However, these sorts of information pointers have been unheard of just until recently. Today, these pointers have become reality. The question therefore arises as to whether software organizations should make effective use of those.
Our study focuses on highlighting the need for making use of different types of data that have come into existence thanks to the latest developments in software technology and practices. Besides, the study is also meant to contribute to the knowledge building around decision-making. In other words, the opportunities presented to software organizations due to a surge in the types of data should be duly utilized for effective decision-making. A shift from opinion-related to more evidence based and fact-driven understanding of software development lifecycle (Olsson & Bosch, 2014) is necessary. There is ought to be a problem if the advancements in the field of data is not reflected in the field of decision-making. To take the inclusion of data in software development to the next level, there must be more structural, methodical and professional approach around decision-making. This is where our study makes its contribution.
1.3 Research Questions
1) How can different types of data collected from customers and from products in the field be effectively categorized to derive value from it in a software-intense organization? 2) How can the different types of data help improve decision-making activities in software-intensive organizations?
16
2 Literature Review
In this section we present the current state of art with regards to advancements in the field of data collection in software systems. We study what new process modifications have happened when it comes to collecting, storing and working with different types of data. We present an organizational view of this data in decision-making by reviewing existing literature. The chapter also presents our findings from available literature around categorization of data and advantages of data in relation to decision-making. Some of the implications are also highlighted together with challenges and opportunities associated with data-driven development.
2.1 Data and data-driven development
Data has many definitions; we opted to go with Merriam Webster (2019) which defines data as “information in digital form that can be transmitted or processed” (Webster, 2019). Based on this, the concept of “Data-driven” is termed as an adjective to describe activities determined by or dependent on the collection or analysis of data (Webster, 2019). This definition is also applicable to the software domain. Data-driven software development accepts the central role that data, in its primary form, takes in the applications that software developers create (Laquer, 2017).
In the below subsections, we would be discussing about the current state-of-the-art in relation to data – its generation, collection and storage and data analytics. After that we will dive into how data and analytics are key elements contributing to the decision-making
17
process in organizations. In the subsequent sections we will look in detail into stages in which data flows.
2.2 Generation, collection/storage and analytics
As mentioned earlier, there is a rapid increase in devices connected to the internet and a heavy reliance on embedded systems (Shack, 2018). Forbes estimates 50 billion devices connected to the internet by 2020 and over 30% of data generated to be coming from sensors and actuators (Vamosi, 2015). In the era of Big Data, almost everything around is collecting and sharing one form of data or the other. The large-scale adoption of mobile phone has affected the price of sensors and actuators making them cheaper (Stisen, Blunck, Bhattacharya, Prentow, Kjærgaard, Dey, Sonne & Jensen, 2015). Besides, it has also increased research in the field of Connected Systems. These devices can gather various types of information from environmental data to internal data such as usage data. They can even transfer it back to the product development organizations for better analysis. Connected Systems have made it easy to be accessible to customers and customer’s behavior is more observable. This provides software development organizations with much more options in terms of data collection (Bertino, 2016).
The collection of data has been a trend for long in the web domain. This is because of the ease of connectivity on the internet. For software that is connected to the internet it is easier to collect usage data on features and collect input data which is saved on a database. However, nowadays we have devices that can collect data through sensors. More data is being generated, creating a pool of data that can be referenced later, especially in the post deployment phase of products (Dukes, 2018). There has been a steady decline in the price of devices and components. As for example, sensors prices are
18
projected to have a fall in price by 67% between 2004 to 2020 (Honrubia, 2017). There have been enhancements too in microcontroller technology whereby they have more computational power and consume less energy. They have become ideal for controlling embedded systems (Odunlade, 2019). These micro-controllers help in processing the data collected and appropriating it – most of the time it is sent to a database for future computation.
The reliance on data is also fueled by the rapid decrease in cost of storage of data. The market for data storage is expanding rapidly. Competition in the data storage market has continually driven the price of data storage down, especially with the emergence of technology such as cloud computing and SSD, coupled with new storage techniques and tools for better management of stored data. Technologies like cloud computing have educated us on the benefits of warehousing data on the cloud database rather than in personal infrastructure. One of the benefits is in financial domain, which shows that it is relatively cheaper to use cloud storage, more so including the utilities that come with cloud computing (ESDS, 2015).
Most data are not structured and will require some sort of preprocessing to get them in a shape for analytics to be performed on them. Table 1 below shows the stages that analytics has gone through in recent times according to Rayes and Salam (Rayes & Salam, 2016). The table shows how analytics has evolved over time from data management to web analytics and now to an era of mobile analytics such as sensors (Chen, Chiang & Storey 2012). This provides us with information like market behavior which we derive through evaluating customer opinions, text analysis and sentiment analysis (Pang & Lee 2008). The data analytics tool can look at the cumulative data produced by software such as Google Tag Manager (Saeed, 2019) and analyze it over a given period. If, for example,
19
the result from analytics then shows that many users dropped out in the first subsection compared to those that went on to move to the next and that both these sets of users spent almost equal amount of time during their visit to the website, an inference can be drawn that the user experience of moving from the first subsection to the next has been difficult for the first set of users compared to the second. A decision can thus be taken to reimplement the navigation mechanism. We have now access even to data that aids in analysis of performance on software. This data is internally generated by the software itself and accessible to the organization and then evaluated for decision-making.
Analytics 1.0 Analytics 2.0 Analytics 3.0 Type of data Structured,
patterned, organized Unstructured, unorganized Unstructured, unorganized, random
Data analysis premise Data Center Data Center At edge & Data Center
Analysis time Days-hours Hours-minutes Seconds-microseconds
Data volume Small Big Big
20
2.3 Organizational perspective on data-driven development
Any form of software product development is a collection of methods and processes (Sommerville, 2011). At different stages of the development process, different stakeholders can put forward their requirements and it is mainly up to the product management to channelize these requirements and make a prioritization decision. However, organizational dynamics play a rather important role in the overall decision structure. As Fabian, Olsson and Bosch (2015) mention in their paper (Fabijan, Olsson & Bosch, 2015), product management is finding it difficult to get customer feedback on time and on a continuous basis. Even though there is a constant urge to deliver and deploy testable software chunks by using different agile methodologies, there is a gap in understanding how effectively software developers can learn from real-time usage of data (Fabijan, Olsson & Bosch, 2015).
A typical software project spanning over a period sees the involvement of various stakeholders. These stakeholders include developers, project managers, product managers among others. All of them usually have their own way of reasoning when it comes to prioritizing feature development. The recent advancements in the field of Open Source (Mockus, Fielding & Herbsleb, 2002) and Cloud Computing (Zhang, Cheng & Boutaba, 2010) are bringing in newer inputs and perspectives into the process of feature prioritization. Prototyping (Abrahamsson & Wenström, 2018) or Controlled Experiments (Fabijan, Dmitriev, Olsson & Bosch, 2017) are also being employed as means to get valuable feedback from customers which is then fed as prioritization inputs. Even though each of these factors are contributing to getting more data upfront, it is increasingly complicated for stakeholders to analyze this data and to create a decision-making process
21
which can guide them to decide on what to implement and what to leave in a software product.
To summarize, we can say that the whole concept of decision-making in a software organization is seeing new dimensions being added to it during the past few years. In other words, we see newer opportunities aiding in the decision-making process which impact software components or component suites that are developed. From the days of highly opinion-based decisions where only a selected few would decide which functionality to add, which one to modify and which one to get rid of depending solely on the customer feedback data or likewise, we are now seeing the possibility to add usage data (Bosch & Olsson, 2016), analytics (Laquer, 2017) and other evidences in the form of analyzed data, which are more fact-based and real-time, as helping aids to those decisions (Alfantoukh & Durresi, 2014).
2.4 Software development practices enabling data-driven development
The waterfall model, which requires the finished product to go through sequential approach development, is being increasingly replaced in organizations by Agile methodology. Agile methodology is a more incremental approach that is more flexible and responsive to change. Data-driven development is strongly encouraged by this lack of rigidity of the agile ways making it easier to implement results of decision-making faster, to observe patterns and to adapt to a change in requirement.
2.4.1 Agile Development Methods
Agile software development and agile ways of working have made steady progress in the recent years, especially in the past one decade. Several new techniques like Continuous Integration (CI) (Olsson & Bosch, 2014), Continuous Deployment (CD) (Olsson & Bosch,
22
2014), Test Driven Development (TDD) etc. (Janzen & Saiedian, 2005) are constantly been discussed in this context. Even though these practices are not necessarily dependent on each other, combined together, these can result in large amounts of credible data which can be made use of to arrive at decisions.
2.4.2 Continuous integration (CI)
CI gives a certain flexibility to organizations to release software in chunks and keep on adding values to the end-product (Fowler, 2006). Through the help of automated testing and integration tools an infrastructure is created in which a developer or a team can develop, review, merge and deliver directly and in regular intervals to the main track of software (Fowler, 2006). As a result, the software product under development is integrated iteratively and with minimum merging effort, thereby increasing the developer productivity if properly used (Ståhl & Bosch, 2014). The number of commits resulting from CI is much more than what used to be if traditional integration model was followed. Each commit has a message which produces historical data as the product takes shape and incrementally grows. This data can be looked at whenever needed in different phases of development lifecycle. This data can as well be used to do decision-making specially to conclude if a product is still active or not. A software component or a module which produces maximum commits has the maximum amount of usage.
2.4.3 Continuous Deployment (CD)
CD is another approach through which small pieces of functionality can be continuously made available to end-users (Rahman, Helms, Williams & Parnin, 2015). While one of the major benefits of this approach is to get out some useful pieces of functionality early and at regular intervals, another vital benefit of this approach is that it helps getting early feedback from end-users and customers (Leppänen, Mäkinen, Pagels, Eloranta, Itkonen, Mäntylä & Männistö, 2015). It is often the case that companies fail to get a proof of
23
whether customers have used what they had wanted and whether they are satisfied with the result. By using CD, there is a possibility to get answers to both these questions in a simpler way. A customer that uses the piece of functionality deployed guarantees that he or she has used it. On the other hand, by having incremental deployment of functional pieces, product managers or product owners can easily reach out to customers to get feedback data on their experiences so far. Both these data can then be utilized in decision-making for further development.
One of the major follow-up actions from CI and CD is that software development organizations can do incremental development regularly and whenever needed. In other words, the decisions that are taken after data analytics phase can often result in a newer version of the implementation. The updated version can have corrected code, design update or even architectural change (Virmani, 2015). Users can get an update and the same user feedback mechanism can continue to happen thereby helping the recent popular concept of Build-Measure-Learn (Fabijan, 2016).
2.4.4 Test-driven Development (TDD)
TDD is also another important tool in this context. It helps to get a large amount of data related to test results on a certain piece of functionality. In other words, the whole idea behind TDD is to write test cases corresponding to a piece of functionality and then run the test and make it fail as there is no code implemented yet (Janzen & Saiedian, 2005). The code is implemented next and a new round of test run produces pass result (Janzen & Saiedian, 2005). The functional piece is then considered ready. The number of test cases, the variety of scenarios and the number of corner-cases give a wide range of coverage for the implementation. Besides, there is a possibility to get more domain knowledge by going through the process of test case development and the corresponding
24
implementation of functional piece. The overall test result data can provide enough information to take a call on the maturity, usability and stability of the implemented code. This data can also be used later to decide on the lifespan of the functionality.
2.4.5 A/B Testing
A/B testing or Online Controlled Experimentation (Fabijan, Dmitriev, Olsson & Bosch, 2017) is a tool to get effective feedback from customers that are using a new piece of functionality. In case of an Online Controlled Experiment which can also be considered as randomized trial, software users are categorized into two random groups and each group is provided with a specific version of a functionality (Fabijan, Dmitriev, Olsson & Bosch, 2017). The two versions can be two different interfaces, or two different components added to the same user interface. The entire process is run multiple times and persistently. The various user interactions such as clicks, time spent on a certain interface etc. are checked and the data is collected and stored (e.g. engagement, task success, etc.) (Rodden, Hutchinson & Fu, 2010). It is further computed to understand the duration of usage, rate of success, number of failures etc. (Rodden, Hutchinson & Fu, 2010). The differences between the two or more given variants (A & B) are finally evaluated to find out which of the two has provided more improvements to the key performance metrics that the product manager is looking for. A decision is then taken based on the information obtained (Siroker & Koomen, 2013).
The below Table 2 summarizes the findings from literature review with respect to the different concepts described in the above section and a note on their relevance in terms of grade.
25
Concept Description Relevance
Agile
Development Methods
Overall practice of delivering software in small chunks, continually add value to the end-product and follow inspect and adapt.
High (Lack of rigidity in decision-making) Continuous Integration
Using automated testing and integration tools creating an infrastructure in which a developer or a team can develop, review, merge and deliver software directly and in regular intervals to the main track of software.
Medium (Creates infrastructure to get early feedback data) Continuous Deployment
Through small pieces increments software functionality is continuously made available to end-users.
Medium
(Opportunity to deploy and get early feedback) Test-driven
development
By writing test cases corresponding to a piece of functionality and then running them before implementing the actual code.
Medium
(Generates lot of data to help in implementation) A/B testing Categorizing software users into two random
groups and each group being provided with a specific version of a functionality.
High (multiple versions
producing large amount of usage data from two usable versions)
26
2.5 Factors to Consider in Data-Driven Development
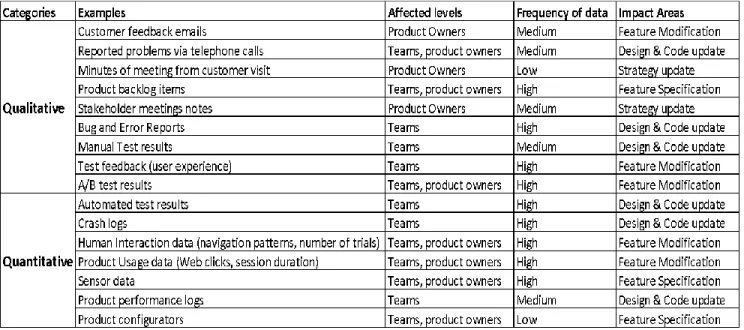
In this section we present the important factors that software organizations need to consider while implementing data-driven development. The factors are based on study of relevant literature and our own reflections on the findings. The factors are multi-dimensional covering aspects like team, technology and process. Going back to the concept of Big Data, there needs to be a strategic approach to separate noise from data with a clear connection to the 3 Vs (Volume, Variety and Velocity) of data coming into the development organization (Marr, 2016). Continued studies are needed to decipher when and how this can be realized. Even though we find that organizations nowadays can largely benefit from analyzed data to make informed choices in different stages of software-development life cycle, the first step to realize it is to have good control on the flow of right amount of data. Furthermore, a proper categorization is also needed to create a mapping structure so that one type of data can facilitate one kind of decision and not the other.
We found that data is broadly categorized into qualitative and quantitative data. Qualitative data is data collected from and about a software that is very textual and is targeted towards explaining or describing. This type of data usually helps us with the ‘why’ and ‘what’ as it provides valuable inputs to understand customer behavior. Proper analysis of this type of data is usually associated with what customers want. As mentioned, this usually is in form of customer feedback, and sometimes requires
27
customer engagement. Quantitative Data, on the other hand, are collected by software and are more statistical and numeric (Olsson & Bosch, 2015). They require some structuring before being interpreted. They help us with the “How’s” of customer and product behaviors. This is mostly product data that is automatically generated by software. An example could be usage data on websites to monitor a feature’s use (Gwandhoo & Weldorg, 2010).
Importantly, a lot of literature has been published about the benefits of data analytics in understanding customers. There are specific types of data of different categories that provide inputs to marketing analytics and have proven to change the way organizations go about creation of new products and modification of existing products. Market Intelligence has become one of the essential benefits of data analysis to organization in recent times. Xu, Frankwick & Edward (2016) mention how using strategic methods of analyzing big data can help improve significantly new production as compared to traditional market analytic techniques (Xu, Frankwick & Edward, 2016).
2.6 Opportunities of data-driven development
The literature review provides some valuable inputs regarding the opportunities of data-driven development. Some of these are listed in the below subsections.
2.6.1 Agility in decision-making due to the presence of evidence
There is a gradual development of software-intensive companies from being traditional to becoming more innovation-oriented. The development can be seen as a sort of maturity in the agile way of thinking. In other words, from the days of creating the first agile/scrum (Schwaber & Sutherland, 2012) team to changing the way reporting of progress is done in an agile team (Schwaber & Sutherland, 2012), companies are now
28
moving into an era of more evidence-based, analytics-based and fact-based decision structures. Even though several dimensions of data collection like customer data, performance data or sensor data from products (Bosch & Olsson, 2017) are available, there is not much focus on how the data can, for instance, be utilized to make assessments related to cost optimizations. Software components and software packages often suffer from a shortcoming that right amount of focus is seldom put on the right features (Highsmith & Cockburn, 2001). According to Fabijan, Dmitriev, Olsson and Bosch (2017), the technique of A/B testing and collecting data through experimentation should have a connection back to business aspect and this is an area that needs to be looked at further (Fabijan, Dmitriev, Olsson & Bosch, 2017).
With regards to the business, it is important that development decisions are taken early and with confidence (Faulk, Harmon & Raffo, 2000). These can be explained as – teams, project and product managers must collaborate, meet and discuss the results of both qualitative as well as quantitative data. They must jointly arrive at a conclusion on what to change, edit, update or remove in a software functionality. The decision must be communicated swiftly to the business functions in the company and the same cycle must be continued at regular intervals. Agility in decision-making can have great impact on the business potential and eventual success. Data-driven development can produce the basis for such agile decisions.
2.6.2 Evidence resulting in quicker decisions
Data-driven development has its effect seen in team and its decision-making capabilities too. Organizations following agile principles need to have some way of functioning when it comes to discussions, exchanging of ideas and making choices related to architecture, design or implementation (Stoica, Mircea & Ghilic-Micu, 2013). If the teams are fed with
29
data, it can only help them make better choices. The uncertainty around, for example, which sensor to improve to get more user inputs or which thread to keep running to get crash logs etc. can be greatly reduced if teams get information from actual usage of the product. To simplify, if a team has access to user data and finds out after analyzing the data that a certain part of functionality is producing maximum number of crashes, it can consider keeping a thread running which has the specific task of capturing log data, stack trace and register values immediately as the system crashes. The data in this case can be looked at, traced back into the code and proper actions can be taken to avoid and if possible, completely solve the erroneous implementation (Biehl, Czerwinski, Smith & Robertson, 2007).
With the help and support of management, teams can get funding for setting up the equipment often near their daily Scrum or Kanban white boards. Since teams run in agile mode, they are in the practice of running daily planning meetings when they assemble for standup of 15 minutes (Schwaber & Sutherland, 2012). There are tools such as Azure Portal (Azure, n.d), or Kibana (Elastic, n.d) in case the teams have access to cloud infrastructure. These tools can help the team making quick decisions for implementation updates and the teams can eventually do the necessary updates. Here we see a direct impact and advantage of data-driven development in action.
Software development teams are moving more from being houses which only deliver functionalities to vital units which add value to the overall vision of the company (Fricker, 2012). To describe further, the teams have on one hand primary responsibility of delivering functional pieces and keep on doing that over a period. But on the other hand, they are moving on to take a much broader role of delivering value incrementally to the overall vision of the company. Market is tough and challenging as mentioned previously.
30
Continuous learning and value addition are differentiating factors which companies are trying to achieve (Gephart, Marsick, Van Buren, Spiro & Senge, 1996). Time to market can greatly be reduced by following CI, CD and the overall mechanism of data-driven development procedures. The incremental piece delivered can reach market faster and earlier to provide functions like sales and marketing to get feedback easier. The feedback is then given back to the development team and the latter can continue developing further or discontinue based on analysis of the feedback.
2.7 Challenges of data-driven development
In this section, we discuss the major challenges faced by organizations with regards to the implementation of data-driven development in their development practices. First, sharing of data within organizations can pose an issue. Information is gathered throughout a product’s life cycle in different stages and segments (Fabijan, Olsson & Bosch, 2016). One of the major challenges occurs due to this fact. Information obtained tends to be shared with that phase of software development only and is sometimes not passed around accurately through the whole development process. This leads to a knowledge-gap in the long run which could affect the total value of the product offered to specific customers (Fabijan, Olsson & Bosch, 2016).
Another problem is synthesizing this data to make value-adding decision which is the major challenge faced by companies. There is so much data available to companies now that to find cost-effective and time-effective ways of making sense of it becomes an issue (Bosch & Olsson, 2018). Furthermore, companies end up spending resources on data that at the end of the day is not very useful to them. Even when this data is properly mined to provide value, other challenges arise. In the long term, valuation of features’ benefits is
31
still a bottleneck. Many companies still find it difficult to arrive at suitable metrics of evaluating how beneficial a product will be in the long run prior to deployment. Also, the impact of a new product on the old is not easily measured as companies aim to find balance in integration (Katal, Wazid & Goudar, 2013).
Data security poses a challenge for companies. This is due to the access issues companies have to data which in most cases is personal (Yu, 2016). It becomes a burden of responsibility to these companies keeping it safe from unauthorized and malicious accesses. If mismanaged data security becomes a huge legal issue which ends up costing companies a lot of money and has reputational damage as well. Studies on new techniques of safeguarding data are being explored such as modifying the data in such a way so as to perform data mining algorithms effectively without compromising the security of sensitive information contained in the data privacy-preserving data mining (PPDM) (Xu, Jiang, Wang, Yuan & Ren, 2014).
32
3 Research Methodology
In this section we present our research methodology. The below figure, Figure 1, shows our entire research process. The details of each stage are discussed in this chapter.
Figure 1: Research process
3.1 Research Philosophy
Our general research philosophy is categorized as Pragmatism (Advocacy) (Oates, 2012). The research observes organizations and/or communities to understand the behaviors, interactions, and tacit understandings that shed light on the problem being advocated against (Deborah, 2012). Pragmatists link the choice of approach directly to the purpose of and the nature of the research questions posed. The pragmatic paradigm implies that
33
the overall approach to research is that of mixing data collection methods and data analysis procedures within the research process (Creswell, 2003). This is because of the nature of the research we conducted. We intended to engage in a critical study of the current practices with the aim of establishing a power relationship between the types of data and the types of decisions made.
Our research has branches in both the exploratory and explanatory arms. Exploratory research has the goal of formulating problems more precisely, it clarifies concepts, gathers explanations, gains insights, eliminates impractical ideas and forms hypotheses (Yin, 1994). Literature research, survey, focus group and case studies are usually used to carry out exploratory research. An exploratory research may develop hypotheses, but it does not seek to test them (Yin, 1994). Explanatory research, which is grounded in theory, is another research purpose type, and the theory is created to answer the “why” and “how” questions. We are more interested in understanding, explaining, predicting and controlling relationships between variables than we are in detecting causes (Yin, 1994). The pragmatic paradigm and strategies involve collecting data in a simultaneous or sequential manner using methods that are drawn from either quantitative or qualitative traditions in a fashion that best addresses the research question(s) (Creswell, 2003). The research- and data collection methods employed in our research were of qualitative nature. Qualitative principles helped us draw a clearer picture as well as increase the validity of our research.
3.2 Research Approach
Our research approach is of the qualitative nature. Qualitative research presents a group of methods that are used to induce meaning from a phenomenon in relation to behavior.
34
The phenomenon in question here is data-driven development. Qualitative research deals with the study of behavior (Yin, 1994) with the aim of giving more understanding of why things are as they are. This was exactly what we aimed to do in our research. Our goal is to identify type of data collected by software organizations, broadly categorize this data and better understand how data can improve decision-making with regards to software.
The method of logic behind our qualitative research stems from abductive reasoning (Oates, 2012) as we studied both the theory behind data-driven development and at the same time complimented the study with observations from trends. The aim was to form and prove a tentative proposition. It is also important to note that methods under qualitative research are more content-based which make it easier to derive understanding of underlying reasons, opinions and motivations. We opted to employ two of the qualitative methods: Interview Research (Oates, 2012) and Grounded Theory Analysis (Oates, 2012) which will be discussed in detail in the Research methods section of this paper.
3.3 Research Methods
The methodology used in the project is guided by qualitative analysis (Oates, 2012) and the techniques associated with it. We employed interview methods to collect data and the data was then put into a grounded theory (Oates, 2012) analysis to generate a model for study. The sample was chosen through preferential (Oates, 2012) sampling techniques.
We structured our project on the lines of iterative project model. In other words, we divided the entire work in small chunks of deliverables which continually added value to
35
the overall project goal. This structure helped us finding bottlenecks, overcoming impediments along the way and executing counter-measures to risks that we faced during the entire duration of the project. Once we had finalized the feasibility study, we created a list of research questions. We discussed first in the team and then with our supervisor to arrive at a meaningful set of questions. After the research questions were set, we went on to structure our probable research methods. Even though we had the choice of using surveys to collect some form of quantitative data, this was not brought in the final scope of our methodology. After several rounds of discussion, it was decided that we should only use interviews as means to get qualitative data.
3.3.1 Literature review study
As outlined before, the thesis had two main tracks of data collection. The first one is through a comprehensive literature review (Oates, 2012) and the other one is through an elaborate interview study (Easterby-Smith, Thorpe & Jackson, 2015). The literature review was conducted over a span of several weeks. Some of the search criteria used to find out relevant articles were “data driven development”, “data and decision-making” on a high level to “benefits of continuous integration”, “data generated from test-driven development” on a much lower level. We worked on a total of 30 sources including Google Scholar, Malmö University's library portal and books and online journals.
While in the beginning we focused mainly of the two research questions to look for articles and journals, we kept looking at the interview results and changed search criteria as we found newer dimensions to the topic. For example, data visualization (Oates, 2012) was not something we looked at in the beginning, but analysis and visualization of data came up as an important topic in the interviews and hence we researched more on it. The same can be said about CI, CD and tools aiding in data-driven development.
36
3.3.2 Interview study
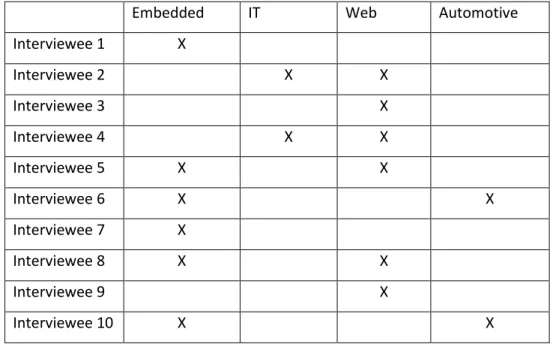
Alongside literature review, we also decided to execute an interview-based research (Oates, 2012). This is mainly because an interview allows close contact with professionals, get insider’s view of how they perceived this growing trend and how it is being adopted in the practical world. The format of our interviews was Semi-structured. We interviewed several professionals in the Software field of various disciplines, to get varying perspectives of data and how those affect their jobs. Regarding interviews, professionals selected in the sample included those from the area of Skåne, which is located at the southern part of Sweden. We also contacted one professional from Nigeria. We interviewed 10 professionals in total.
First, we created a list of professionals from within our network. The list consisted of people working in different roles and with various levels of expertise, experience and knowledge in the field of software engineering (Oates, 2012). The professionals selected were from the group of people whom we have worked with at various stages of our own professional life. These professionals were coming from different sectors of software industry like IT, embedded systems, web development to name a few.
Second, we contacted these professionals personally to seek for their time which could match with our time as well. We gave each one of them a little orientation before the actual interview so that they could get some introduction of the topic and the field of our study. On a few occasions we received some questions back, asking for clarification on some points. Overall, it was accepted, and we were appreciated to take up a relevant topic. Given the limitations of a study based on interview (Oates, 2012) we put in a lot of effort to start the preparation for the actual meetings.
37
Third, we prepared a set of questions for our semi-structured (Oates, 2012) interviews. We started with a general set of questions that was not grouped according to interviewee profiles or roles. The main aim was to have open conversations and allow the interview to take its own flow (Oates, 2012) while we were there to make sure that we did not deviate from the main topic. Even though we had a good start to the first round of interviews with the initial set of questions, we later realized that the set of questions can be modified further. One of the reasons was that we were interviewing professionals working in different roles and the questions had to be tailored accordingly. Hence, we came up with a modified set of questions that was also grouped according to the target group of the interviewees.
Finally, we conducted the interviews with the selected group of individuals. All interviews were recorded after taking due permission from the interviewees. We created transcripts for each interview and saved those in a shared drive for future use. While doing the interviews a few important points were always followed. We were never late for any of the interviews. We kept a time limit of 30-40 minutes and we could stick to that. We promised the interviewees that we would share a copy of the final thesis paper once after we have finalized it.
The sample size of 10 interviewees consisted of professionals working with varied technologies and with very different backgrounds and experience levels. While on one hand we interviewed a handful of CEOs (Chief Executive Officer), on the other hand, we got to meet several senior software developers and even software project managers. The professionals chosen in the interview study all had good insights and they were willing to share their own reflections and understandings with us. Table 3 shows a summary of the
38
interviews conducted in the study. Some interesting information is revealed in the table which shows the variety, breadth and diversity of interviewees selected for the study.
Interviewee Role Interview Duration Domain
Interviewee 1 Solution Architect 34 mins Home Alarm Systems
Interviewee 2 CEO, Architect 34 mins IT Consultancy
Interviewee 3 Database Administrator
24mins Software Solutions
Interviewee 4 Project Manager 32 mins IT Systems
Interviewee 5 Project Manager 27 mins Embedded Systems, Compliance Interviewee 6 Technical Team Lead 30 mins Embedded Automotive Systems
Interviewee 7 Test Lead 32mins Home Automation
Interviewee 8 Project Manager 28 mins Software Consultancy
Interviewee 9 Senior Developer 31 mins Web Development
Interviewee 10 Scrum Master 33 mins Embedded Systems
Table 3: Profile of all participants in the interviews
3.3.3 Qualitative Analysis
After data was collected from both the literature review and interviews, we did a qualitative analysis taking inputs from grounded theory analysis (Oates, 2012). It helped us arrive at a model or theory from the field-data we expected to gather during the research project. The field data consisted primarily the interview from professionals working with product management. We aimed to construct a simple yet innovative way to arrive at decision-making. Grounded theory has the benefit of helping in this
39
construction as it uses coding and similar techniques to do analysis of raw data received from interviews.
For the data analysis part, we first did a transcription (Oates, 2012) of all the interviews. While doing the transcription, it was obviously difficult to write about the different emotions and gestures (Easterby-Smith, Thorpe & Jackson, 2015) the interviewee was going through. It was also difficult to note down the perception (Oates, 2012) of the interviewees on certain questions. However, we did our best to not omit anything from what was discussed and recorded.
Once the transcriptions were all done, we printed out the entire text and started to look closely at the available data on the hardcopy (Oates, 2012). We followed through the line of thoughts coming from the interviewees and tried to highlight some important findings on each interview. These important points were then color coded using different colored pencils (Oates, 2012). The main questions were laid out and answers and discussion points were thoroughly examined. The color coding (Oates, 2012) was a tool used to bring out the important points which was later looked at to find patterns.
As mentioned before, Grounded Theory analysis (Oates, 2012) is based on finding patterns and arriving at a possible model to be used for future. In our case, we looked deeper at the color-coded textual data and started to search for patterns. There were indeed some similarities in the data obtained and of course there were some irregularities too. The similar points led us making a foundation for our proposed model. The dissimilar points were also analyzed, and a grouping was done for further use. The details of the model and the patterns are discussed in the Results and Discussions section.
40
3.4 Threats to Validity
Our research has certain threats to validity some of which are discussed in this section. Moreover, the steps to overcome the internal and external validity are discussed in a later section. One of the major threats to the validity is that our data collection technique is only dependent on interview data. Interviews have a shortcoming in the sense that they can lack originality, reliability and consistency (Oates, 2012) on the part of the interviewee. There are also other aspects such as mood and openness from interviewees’ end that can affect the overall outcome. In our case, we selected professionals within our respective networks and therefore it is likely that those professionals who will be interviewed will be known to us. However, there is still no guarantee that inhibited and artificial (Oates, 2012) approach from professionals can be completely avoided.
41
4 Results
In this chapter we present our findings from the interview study. The different findings are grouped according to the group of questions we created in our interview question-set. The purpose of grouping the results was to provide a flow for the reader on the various important areas we touched upon. Furthermore, the aim was also to remain within the limits of the central theme of the topic. The interview questions were slightly varying based on the flow of conversation and based on the kind of professionals we were interviewing, thus upholding the overall recommendation of semi-structured interview.
4.1 General Understanding of Data-driven development
Our interviews show that there are variations in the level of understanding when it comes to defining or describing the concept of data-driven development. When we created our set of interview questions, our aim was to have an open discussion on this question. In other words, we wanted to not project any preconceived notion on the definition of data-driven development. Rather, we wanted to understand what it means for different interviewees given the context in which they work, their roles and their experience.
Interviewee 1, who is a lead architect in a company working with home alarm systems, gave us a well-informed and experienced take on the subject. An experienced professional who has been involved in different kinds of software developments from embedded systems to application layers, his simple and clear answer was it is something that had started a long time back. Having said that, the outcome of data analysis is not something that usually gets the right amount of priority that it deserves. Besides, what data to collect and store is often not so clear. All other things are prioritized more than
42
results from data analytics in general. So, data-driven development for him is information obtained from embedded systems and analytics performed on it with minimum usage in the end.
The CEO of an IT-consulting company who has long years of experience in the field of IT development was our Interviewee 2. His take on data-driven development was more elaborate and expansive. His understanding and experience helped us get a broader perspective of the concept as he illustrated his understanding using examples from the market. Among the areas where data-driven development is making its impact is Business Process Mapping and he highlighted the increasing role of product configurators in the field of software engineering in this context. Instead of designers designing a piece of software functionality or an IT system, it is these product configurators that are capturing valuable customer feedback data and helping them make the necessary design choices. In a way, he takes us through a journey of sort and pinpoints areas where data-driven development has become a reality. His understanding of the concept comes from the knowledge of the domains where the concept is practiced. Furthermore, he believes that data is becoming key to success for companies across the board. In fact, towards the end of the interview he said that based on data many things can be done and should be done.
Interviewee 3, who is a database administrator based in Nigeria was someone already working with data-driven development. Apart from the fact that data-driven development is popular in various domains of software development like in e-commerce and or any platform-oriented development, he also mentioned the fact that it is connected to the needs of end-users or customers.
43
“I feel data-driven development relies a lot on, I will put it in a market perspective, because at the end of the day, whatever we develop, the end user is going to do it, which is the customer….” (Interviewee3).
So, a comprehensive market perspective, customer-centric analysis etc. are some of the factors that should be taken into consideration while considering data-driven development.
Our interviewee 4 was a Project Manager working with IT-systems and he is someone who has long years of experience working in Sweden and has studied management as a discipline. To him data-driven development is something which is by nature linked to decision-making. It is not a new concept after all. The research in this field must be narrowed down and at the same time generalized. On a similar note as Interviewee 3, his view was that the theories and principles associated with this phenomenon are more directed to business needs. He however thinks that for data-driven development to have its intended impact, it should be supported with the right kind of tool. Tools are software components that do things in a more efficient way, can collect data based on the context and help create a decision in the end.
“So and especially where you have lot of data, which you want to process, and arrive at
some sort of good conclusions or solutions, then it's not that easy….. human mind has, you know, some limitations, unfortunately, and tools can do it much better in efficient way.”
(Interviewee4)
Interviewee 5, who is also a Project Manager working in embedded development in an emerging software company, has plain and simple understanding of the concept. Having
44
her focus area on firmware development and in the understanding of regulations and certifications of products, she has seen data-driven development from low-level design aspects. Her view is that data-driven development is all about doing the right thing from the beginning. The right infrastructure must be there to access and then collect the data. Getting the data, collecting and analyzing it is one thing. To ensure that proper learning is done from that data and that the product itself can keep learning are somewhat different things. The concept should try to include both.
When it comes to detailed understanding, it was Interviewee 8 who had more inputs. The different inputs can broadly be classified into three groups. First, data-driven development has been a tool for software organizations to understand the status and progress in terms of Key Performance Indicators (KPIs). Second, he went on to say that web-development has feedback loop with customers employing A/B testing etc. Finally, there is data collection of individual users to facilitate online advertisements and selling of products based on individual’s usage and preference patterns. Connected systems like IOT can also generate data and help in this kind of software development but he is yet to see much of it.
“The third one that I would like to see is the one that actually involves the whole product
lifecycle when it comes to like IoT and things that are not web based. But I haven't seen too much of that yet” (Interviewee8)
Interviewee 7, who is also a test project manager had a different take on the subject. Instead of sequential development, this is more feedback-oriented software development process. It helps software to evolve through effective use of data which includes even test data among others. Using data for testing is what data-driven
45
development means in general for Interviewee 6. The verification of connected products and eventual development is covered in this context. Interviewee 9 gave a very straight forward reply to what he means as data-driven development. Using data to decide on what to do next – this was his take.
To summarize, on the topic of data-driven development, we found several answers ranging from popular definition to a broader domain understanding to a clear knowledge with specific examples. The summary has been illustrated in the below Table 4.
Answer 1 Information from embedded systems and analytics done on it
Answer 2 Feedback oriented software development process using the data collected
Answer 3 Usage of data to decide on what to do next in the development iteration Answer 4 Verification of connected products and its eventual development based
on the collected data
Answer 5 Tool to understand the status and progress in terms of Key Performance Indicators (KPIs)
Answer 6 Collection of data and helping in machine learning Answer 7 Decision-making based on data collected