Umeå University Medical Dissertations, New Series No 1712
The importance of body-mass exponent
optimization for evaluation of
performance capability in
cross-country skiing
Tomas Carlsson
Department of Community Medicine and Rehabilitation Sports Medicine Unit
Umeå University Umeå 2015
Responsible publisher under swedish law: the Dean of the Medical Faculty This work is protected by the Swedish Copyright Legislation (Act 1960:729) ISBN: 973-91-7601-270-3
ISSN: 0346-6612
Elektronic version available at http://umu.diva-portal.org/ Printed by: Print & Media, Umeå University
TABLE OF CONTENTS
Table of contents
Abstract I Abbreviations III List of publications V Introduction 1 Cross-country skiing 1History of cross-country skiing 1 Physics of cross-country skiing 1 Physiology of cross-country skiing 2
Scaling 5
Physiological capability 5
Performance capability 6
Scaling in cross-country skiing 6
Aims 9
Methods 11
Overall design 11
Subjects 11
Test equipment 11
Measurements of oxygen uptake 11
Measurements of blood-lactate concentration 12
Roller-skiing tests 12
Ski-ergometer test 12
Measurements of physiological characteristics 12
Submaximal oxygen uptake 12
Maximal oxygen uptake 13
Upper-body oxygen uptake 13
Upper-body power output 13
Timing system 13
Collection of performance data 13
Competitive performance 14
Time-trial performance 15
Ski-ranking points 15
Statistical analyses 15
Evaluation of competitive performance 15 Evaluation of time-trial performance 16 Evaluation of performance in different sections 17 Evaluation of performance in different laps 17
Correlation analyses 18
Analysis of lap-speed differences 18
Level of significance 18
TABLE OF CONTENTS Ethical considerations 18 Results 19 Physiological measurements 19 Performance data 19 Correlations 21 Power-function modelling 21
Modelling of competitive performance 21 Optimal body-mass exponents for V̇O2max 24
Modelling of time-trial performance 25 Modelling of performance in different sections 26 Modelling to explain performance in different laps 26
Discussion 27
Principal findings 27
Theoretical perspectives 27
Optimal V̇O2max-to-mass ratios for competitive performances 29 Influencing factors of the body-mass exponent for V̇O2max 32
Scaling of upper-body power output 34
Effects of physiological differences on performance 36
Practical implications 37
Performance capability in 15-km classical-technique skiing competitions 37 Performance capability in classical-technique sprint prologues 39 Performance capability in 2-km double-poling roller-skiing time trials 39
Strengths and limitations 39
Strengths 39 Limitations 40 Future perspectives 41 Conclusions 41 Funding 43 Acknowledgements 45 References 47
ABSTRACT
Abstract
Introduction Performance in cross-country skiing is influenced by the skier’s
ability to continuously produce propelling forces and force magnitude in relation to the net external forces. A surrogate indicator of the “power supply” in cross-country skiing would be a physiological variable that reflects an important performance-related capability, whereas the body mass itself is an indicator of the “power demand” experienced by the skier. To adequately evaluate an elite skier’s performance capability, it is essential to establish the optimal ratio between the physiological variable and body mass. The overall aim of this doctoral thesis was to investigate the importance of body-mass exponent optimization for the evaluation of performance capability in cross-country skiing.
Methods In total, 83 elite cross-country skiers (56 men and 27 women) volunteered
to participate in the four studies. The physiological variables of maximal oxygen uptake (V̇O2max) and oxygen uptake corresponding to a blood-lactate concentration
of 4 mmol∙l-1 (V̇O
2obla) were determined while treadmill roller skiing using the
diagonal-stride technique; mean oxygen uptake (V̇O2dp) and upper-body power
output (Ẇ) were determined during double-poling tests using a ski-ergometer. Competitive performance data for elite male skiers were collected from two 15-km classical-technique skiing competitions and a 1.25-km sprint prologue; additionally, a 2-km double-poling roller-skiing time trial using the double-poling technique was used as an indicator of upper-body performance capability among elite male and female junior skiers. Power-function modelling was used to explain the race and time-trial speeds based on the physiological variables and body mass.
Results The optimal V̇O2max-to-mass ratios to explain 15-km race speed were
V̇O2max divided by body mass raised to the 0.48 and 0.53 power, and these models
explained 68% and 69% of the variance in mean skiing speed, respectively; moreover, the 95% confidence intervals (CI) for the body-mass exponents did not include either 0 or 1. For the modelling of race speed in the sprint prologue, body mass failed to contribute to the models based on V̇O2max, V̇O2obla, and V̇O2dp.
The upper-body power output-to-body mass ratio that optimally explained time-trial speed was Ẇ ∙ m-0.57 and the model explained 63% of the variance in speed.
Conclusions The results in this thesis suggest that V̇O2max divided by the square
root of body mass should be used as an indicator of performance in 15-km classical-technique races among elite male skiers rather than the absolute or simple ratio-standard scaled expression. To optimally explain an elite male skier’s performance capability in sprint prologues, power-function models based on oxygen-uptake variables expressed absolutely are recommended. Moreover, to evaluate elite junior skiers’ performance capabilities in 2-km double-poling roller-skiing time trials, it is recommended that Ẇ divided by the square root of body mass should be used rather than absolute or simple ratio-standard scaled expression of power output.
II
ABBREVIATIONS
Abbreviations
ANOVA Analysis of variance ATP Adenosine triphosphate CI Confidence interval FIS International Ski Federation
FISdist International Ski Federation’s ski-ranking points for distance races
FISsprint International Ski Federation’s ski-ranking points for sprint races
r Pearson’s correlation coefficient R2 Coefficient of determination SD Standard deviation
V̇O2dp Mean upper-body oxygen uptake
V̇O2max Maximal oxygen uptake
V̇O2obla Oxygen uptake at the relative work intensity corresponding to a
blood-lactate concentration of 4 mmol∙l-1. V̇O2peak Peak oxygen uptake
V̇O2var Variables of oxygen uptake
LIST OF PUBLICATIONS
List of publications
This doctoral thesis is based on the following original studies and they will hereafter be referred to by their roman numerals.
I Carlsson T, Carlsson M, Felleki M, Hammarström D, Heil D, Malm C, Tonkonogi M. Scaling maximal oxygen uptake to predict performance in elite-standard men cross-country skiers. J Sports Sci. 2013;31(16):1753-60.
II Carlsson T, Carlsson M, Hammarström D, Rønnestad B, Malm C, Tonkonogi M. Optimal V̇O2max-to-mass ratio for predicting 15-km performance among
elite male cross-country skiers. Submitted
III Carlsson M, Carlsson T, Knutsson M, Malm C, Tonkonogi M. Oxygen uptake at different intensities and sub-techniques predicts sprint performance in elite male cross-country skiers. Eur J Appl Physiol. 2014;114(12):2587-95.
IV Carlsson T, Carlsson M, Hammarström D, Malm C, Tonkonogi M. Scaling of upper-body power output to predict time-trial roller skiing performance. J Sports Sci. 2013;31(6):582-8.
The studies within this thesis are reprinted with permisson from the original publisher.
INTRODUCTION
Introduction
Cross-country skiing
History of cross-country skiing
The first skis have been dated to approximately 5,200 years ago, and for the majority of this period, skis were used as a means of transportation to facilitate gathering, hunting, and visiting [1], most likely because it is more energy efficient to move on surfaces covered by snow and ice using skis compared to walking or using snowshoes [2]. Approximately 150 years ago, the transformation of cross-country skiing from being just a mean of transportation to become a sport and a recreational activity begun [1]. In the year 1924, cross-country skiing was a part of the Olympic Winter Games in Chamonix and the year after, the first World Championships was held. The competitive distances during these events were 18 km and 50 km performed in classic technique (i.e. skiers are only allowed using double-poling, double poling with kick, diagonal-stride, or herringbone technique) and only men competed. Skiing for women was included in the Olympic program in 1952, and two years later, they competed in the World Championships [1]. In 1987, competitions in freestyle technique (i.e. skating with skis) were included in the Championships program and have been part of the Olympic and World-Championships program ever since [3]. Until 2000, only distance races (5 – 30 km for women and 15 – 50 km for men) were performed in these two recurrent international events, but in the World Championships in 2001, sprint competitions (0.8 – 1.6 km for women and 1.0 – 1.8 km for men) were introduced [1].
Physics of cross-country skiing
Independent of competitive distance, performance is determined by the time the skier needs to complete the actual race distance. During the strive to reach the finish line in the shortest time possible, the skier has to overcome a number of counteracting forces that are all related to forward movement; hence, the counteracting forces together with the movement of body mass or body segments entails a power demand the skier has to exceed by the produced power output. Total power demand is related to six fundamental counteracting forces/power demands.
When the skis glide upon the snow frictional forces between the skis and the snow-covered surface arises. The forces related to friction are parallel to the movement direction of the skis but directed in the opposite direction. The frictional force of a ski is dependent on the force applied to the ski that is perpendicular to the surface multiplied by the coefficient of friction. The power demand that originates from friction increases, theoretically, linearly with skiing speed; therefore, if speed doubles, the power demand increases twofold. Another force that the skier has to overcome that is also associated with skiing speed is air resistance. Air resistance is dependent on the frontal area of the body that is perpendicular to the movement
INTRODUCTION
2
direction and the accompanying power demand increases with skiing speed raised to the 3rd power (i.e. if speed doubles, the air resistance increases eightfold). In uphill sections, the skier has to lift the body mass against the force of gravity, which results in a net increase in potential energy. The power demand related to the work against gravity is the product of the force of gravity due to body mass and vertical velocity. Similarly, an elevation of the centre of mass causes an increased potential energy
during the stride cycle, and power demand is a function of mean elevation of body
mass and stride frequency. Moreover, there is a reduction in speed during the stride cycle, from one muscle-force transfer to the next, which is related to a reduction in kinetic energy. The power demand associated with the translational kinetic energy
during the stride cycle is body mass multiplied by the squared speed difference and
stride frequency. During the stride cycle, a number of body segments rotate in relation to their joints. The rotational kinetic energy during the stride cycle is linked to these rotational movements, and power demand is related to each segment’s moment of inertia and the square of its angular velocity [4].
Based on the dimensional analysis, these counteracting forces are related to body mass although in different proportions [4]; hence, an evaluation of the performance of cross-country skiers must acknowledge the influence of body mass [4,5]. Body mass of the skier could therefore be considered an indicator of the net external forces or “power demand” [6]. The power output produced by the muscles has to overcome the power demand to create a forward motion, and the greater the ratio between power-output production and power demand, the faster the skiing speed that is achieved. For endurance performances, such as cross-country skiing competitions, it is important from a performance perspective to have high power output–to–power demand ratio when the entire race is analysed; therefore, a skier’s performance capability could be considered the ability to sustain a high mean skiing speed for the total race distance. From a physical perspective, a higher mean skiing speed is related to a higher energy expenditure compared to that of a lower mean skiing speed due to the counteracting forces, which are greater, being a function of the skier’s speed.
Physiology of cross-country skiing
To continuously produce power for forward motion by the skeletal muscles, the contractile proteins in the force-generating muscles have to be supplied with adenosine triphosphate (ATP); otherwise no force would be produced [7]. Because of limited ATP storage in the muscles [7], the re-synthesis of ATP in the skier’s force-generating muscles is necessary for generating propelling forces throughout a cross-country skiing competition. This ATP re-synthesis is promoted in two different ways that are fundamentally different from a physiological point of view; the aerobic energy-supply system requires oxygen for the re-synthesis of ATP, whereas the anaerobic energy-supply system regenerates ATP without the presence of oxygen [8]. The anaerobic energy-supply system has a higher maximal
ATP-re-INTRODUCTION
synthesis rate compared to that of the aerobic energy-supply system; however, the aerobic energy-supply system is superior if the total ATP-re-synthesis capacity of both systems are compared [7]. In this context, it is important to note that a high utilization rate of the anaerobic energy-supply system will, eventually, lead to fatigue due to the accumulation of fatigue-related metabolites and a disturbance of the homeostasis in the working muscles; factors such as acidosis as well as changes in concentrations of phosphocreatine, inorganic phosphate and potassium most likely influence the appearance of fatigue [8-10]. Therefore, the skier has to use the anaerobic energy-supply system wisely by continuously controlling the work intensity based on the remaining distance and profile of the course.
Consequently, each energy-supply system’s contribution to ATP supply for the generation of propelling forces in cross-country skiing depends, in particular, on the work intensity and duration of the race. For the shortest individual race distances in distance cross-country skiing in the World Championships or Olympic Games, which currently are 10 km for women and 15 km for men, the completion times range from 25 to 45 min (depending on the course profile, snow and track conditions), corresponding to an energy contribution of approximately 95% from the aerobic energy-supply system [8,11]. An equal contribution of aerobic and anaerobic energetic resources to power output for maximal exercises was reported to occur between 100 and 120 s [8,12]. Therefore, for sprint races with a competitive duration of approximately two to four minutes, a slight predominance of the aerobic energy-supply system would be expected [8], which has been supported by mathematical modelling [13]. Accordingly, the ratio between the aerobic and anaerobic energy contribution was approximately 3:1 during a 600-m uphill roller-skiing time trial, with a mean completion time of approximately 3 min [14,15]. Hence, independent of race distance in elite cross-country skiing, there is an interaction between the aerobic and anaerobic energy-supply systems. Because of the intimate relationship between force-generating capability and the capability of the energy-supply systems in terms of ATP resynthesis it is reasonable to assume that a high ATP-turnover rate is important for skiing performance. Therefore, the performance capability of cross-country skiers could be evaluated on an
energy-supply level.
In a test situation, anaerobic capacity (i.e. the capacity of the anaerobic energy-supply system) can be investigated by analysing the maximal accumulated oxygen deficit. Based on the extrapolation from a linear relationship between exercise intensity and oxygen uptake, the maximal accumulated oxygen deficit is considered the difference between the energy expenditure at a supra-maximal intensity and actual oxygen consumed during the test [16]. However, as a consequence of the high ratio between aerobic and anaerobic energy supply in competitive cross-country skiing, the capability of the aerobic-energy system is more frequently evaluated than the anaerobic capacity. The upper limit of the aerobic energy-supply rate is termed the maximal oxygen uptake (V̇O2max), which is defined as the highest rate at which
INTRODUCTION
4
oxygen can be taken up and utilized by the body during severe exercise [17]. There is a sequence of events in the transport of oxygen from the atmosphere to the mitochondria wherein cardiac output, which can be considered an indicator of the transportation capacity of oxygenated blood, is suggested to be the primary limiting factor for V̇O2max in exercising humans [17]. The V̇O2max of cross-country skiers
is, in general, achieved using the diagonal-stride technique [11] which is a whole-body exercise with the involvement of large muscle masses; the large oxygen requirements of the working muscles at high work intensities means that the cardiorespiratory system is fully stressed. For the double-poling technique and the sub-techniques included in the freestyle technique, an oxygen uptake equivalent to V̇O2max is generally not attained due to a lower muscle-mass involvement;
therefore, the upper limit in these sub-techniques is termed peak oxygen uptake (V̇O2peak). Elite skiers achieve approximately 86 to 92% of their V̇O2max while
double poling [18-22], whereas the corresponding interval for the freestyle sub-techniques remains to be investigated even though oxygen uptake during exercise at maximal intensity appears to be lower than V̇O2max [11,23].
In addition to maximal-intensity tests, there are submaximal tests that could be considered for investigating the interaction between the aerobic and anaerobic energy-supply systems such as lactate-threshold or anaerobic-threshold tests, which are used to determine the power output or oxygen uptake for a specific blood-lactate level or predetermined blood-lactate increase [24]. This power output/oxygen uptake is supposed to indicate a work intensity that could be held for a prolonged duration. For example, the commonly used blood-lactate reference value of 4 mmol∙l-1 is suggested to represent the intensity at which the aerobic-anaerobic transition occurs [25]. The evaluation of the energy-supply systems is intended to reflect the ability of ATP re-synthesis at different work intensities, which is proposed to be an indirect measure of the skier’s capability to produce propelling forces. However, skiers are also frequently evaluated at a force-generating level at which force production or power output for specific muscles or ski-specific motions are measured. For example, double-poling using a ski ergometer has been shown to be a reliable and valid measure of a skier’s power output [26].
A skier with a large muscle mass will, in general, be able to have a higher power output expressed absolutely compared to a skier with less muscle mass; moreover, there is a strong relationship between body size and the absolute expression of V̇O2max [27]. However, these advantages for large skiers do not automatically
entail a superior performance capability because of the influence of body mass on performance. Therefore, to optimally indicate performance capability, indicators of both power production and power demand need to be considered.
INTRODUCTION
Scaling
Previously, it has been established that performance and physiological characteristics are influenced by the size of the body [28]; therefore, differences in body size have to be considered when performance and/or physiological characteristics of athletes are investigated. Body-size differences can be adjusted by using an appropriate allometric-scaling approach (allometric from the Greek words
alloios, which means to change, and metry, which means to measure), and the
suggested approach for these adjustments is non-linear allometric modelling [28,29]. The non-linear allometric modelling can be divided into two fundamental different modelling approaches to determine either physiological capability or performance
capability of individuals or groups.
Physiological capability
Therefore, to investigate the influence of an anthropometric variable (e.g. body mass) on a physiological characteristic (or sometimes on a sport performance), modelling is often based on the following model:
y = a ∙ xb, (1) where y is the physiological variable (or performance); a is a constant; x is the anthropometric variable; and b is the scaling exponent. To scale appropriately, the scaling exponent for the anthropometric variable should be identified from log-log transformations. Log-transformation of Model (1) enables the use of linear regression to determine a and b in accordance with the following model:
loge y = loge a + b ∙ loge x. (2)
This approach can be considered to determine the physiological capability of individuals or groups based on a specific physiological characteristics by normalising the influence of body mass. The described approach has previously been used in sport science for physiological variables, such as oxygen-uptake variables [29-34] and variables of power output [35-40]. Moreover, the influence of body mass on various sport performances has also been investigated using allometric scaling in accordance with Models (1) and (2) [41-44].
INTRODUCTION
6
Performance capability
A different model was suggested to optimally combine a physiological variable and an anthropometric variable to explain a performance [29], and the arrangement of the power-function model was:
z = a ∙ yc ∙ xb (3) where z is the performance variable; a is a constant; y is the physiological variable; x is the anthropometric variable; and b and c are the scaling exponents. Log-transformation of Model (3) to determine the constant and scaling exponents gives: loge z = loge a + c ∙ loge y + b ∙ loge x. (4)
This modelling approach can be considered to determine the performance capability of individuals or groups, and it has been applied to explain performance in different sports based on physiological variables and body mass. For example, oxygen-uptake variables have been used to explain distance running [29,45,46] and time-trial cycling [47,48] performance; power-output variables have been used to explain sprint running [29], time-trial cycling [47,49], and rowing [50-52] performance. This modelling approach has also been used to describe of rowing performance based on a subject’s age and stature [53]. Consistent with the results of these studies, it has been suggested that power-function modelling is appropriate for exploring the relationship between physiological variables and performance [54].
Scaling in cross-country skiing
In cross-country skiing research, the influence of body size on physiological characteristics of elite skiers, by using the allometric-scaling approach to determine
physiological capability, has not yet been thoroughly investigated. In a previous
study, an attempt has been made to find the body-mass exponent for V̇O2max that
normalizes the influence of body mass by compiling unpublished results and an exponent derived from an investigation of a 60-km skiing competition; the researchers found that the mean value was 2/3, and it was therefore suggested that the use of the unit “ml∙min-1∙kg-0.67” is, compared to the simple ratio-standard scaled
expression (ml∙min-1∙kg-1), more appropriate if the objective is to equalize for
differences in body mass [5]. However, the simple ratio-standard scaled expression of an oxygen-uptake variable (such as V̇O2max or V̇O2peak) is still commonly used
to express physiological characteristics of skiers [55-60], to investigate physiological differences between groups of skiers [61-66], and to evaluate its relationship to different types of skiing performances (i.e. competitive, ranking, time trials, and roller skiing) related to both sprint [67,68] and distance [69-74] cross-country skiing. The simple ratio-standard scaled expression of anaerobic capacity (ml∙kg-1) has also been used to investigate 0.6-km uphill roller-skiing performance
INTRODUCTION
[14,15] and the differences between groups of skiers [75]. On a force-generating level, correlation analyses to investigate the relationship between the simple ratio-standard expressed power output (W∙kg-1), especially double-poling tests, and different types of skiing performances have been conducted [26,74,76-79]. However, no previous study has used power-function modelling to investigate performance capability among elite skiers based on their double-poling power output and body mass; therefore, it is important to establish the optimal body-mass exponent for power output to enable appropriate evaluations of elite skiers’ performance capabilities.
For V̇O2max (and V̇O2peak), the previously proposed physiological-capability
expression “ml∙min-1∙kg-0.67”, which is suggested to better reflect
performance-capability differences among elite skiers compared to the simple ratio-standard scaled expression [62], has been adopted for the evaluation of skiers’ performance [4,70,71,74,80,81], differences between groups of skiers [4,62,75,82,83], and longitudinal oxygen-uptake development data [62,84,85] and to describe physiological characteristics of skiers [86,87]. However, when the 0.67 body-mass exponent for V̇O2max is used for evaluating performance in cross-country skiing, it
is assumed that qualitative differences in the aerobic energy-supply system directly reflect performance-capability differences. It has been proposed that there is a tendency that skiing speed in distance races is positively related to body mass [5]. This notion was supported by results in a recent study that showed that race speed in distance competitions was related to body mass raised to the power of 0.26 [88]. Consequently, to explain performance, both the influence of V̇O2max and body
mass needs to be considered, which can be addressed by using the above described allometric-scaling approach in Model (3) and (4).
The body-mass exponent for V̇O2max has also been proposed to vary with
course-profile differences as suggested by exponents lower and higher than 0.67 for level and uphill skiing, respectively [5]. This is consistent with the finding that the counteracting forces are scaled differently to body mass, where the power demand related to changes in potential-energy increases in proportion to body mass, whereas the other four fundamental counteracting forces increase less than body mass [4,5]. However, the influence of course inclination on the body-mass exponent for V̇O2max remains to be investigated for elite skiers in a cross-country skiing
competition. Moreover, it has previously been demonstrated that skiers’ race speed generally decreases throughout a race [67,70,89] and that this speed reduction is reflected by a reduced speed in ascents [67]. Hence, if a larger proportion of the time is spent uphill skiing, it can be reasonable to assume that the body-mass exponent is influenced by the distance covered of the race.
To the best of our knowledge, no previous study has used power-function modelling in accordance with Model (3) and (4) to explain performance in cross-country skiing. As suggested by the results from studies in other endurance sports, this allometric-scaling approach can provide more comprehensive information about
INTRODUCTION
8
how different physiological characteristics should be expressed, in relation to body mass, to optimally reflect performance capability among elite cross-country skiers.
AIMS
Aims
The aim of this doctoral thesis was to investigate the importance of body-mass exponent optimization for evaluation of performance capability in cross-country skiing.
The specific aims were:
I To establish the optimal body-mass exponent for V̇O2max to indicate 15-km
performance in elite-standard men cross-country skiers and to evaluate the influence of course inclination on the body-mass exponent.
II To validate the 0.5 body-mass exponent for V̇O2max as the optimal predictor
of performance in 15-km classical-technique skiing competitions among elite male cross-country skiers and to evaluate the influence of distance covered on the body-mass exponent for V̇O2max among elite male skiers.
III To investigate the relationship between sprint-prologue performance (using the classical technique) and the oxygen uptake at the work intensity corresponding to a blood-lactate concentration of 4 mmol∙l-1 (V̇O2obla), V̇O2max, and mean
upper-body oxygen uptake (V̇O2dp).
IV To establish the most appropriate allometric model to predict mean skiing speed during a double-poling roller-skiing time trial using scaling of upper-body power output (Ẇ).
METHODS
Methods
Overall design
In Study I – IV, the overall design was to reliably collect physiological variables and performance data for elite skiers, which subsequently were used in scaling analyses to determine the optimal body-mass exponent for the physiological variable of interest to optimally explain skiing performance.
Subjects
The four studies included in this doctoral thesis were performed separately and the subjects were elite cross-country skiers. In total, 83 subjects volunteered to participate where four of them participated in two studies and one subject participated in three studies. The sex, number, stature, body mass, and age of the subjects in each study are displayed in Table 1.
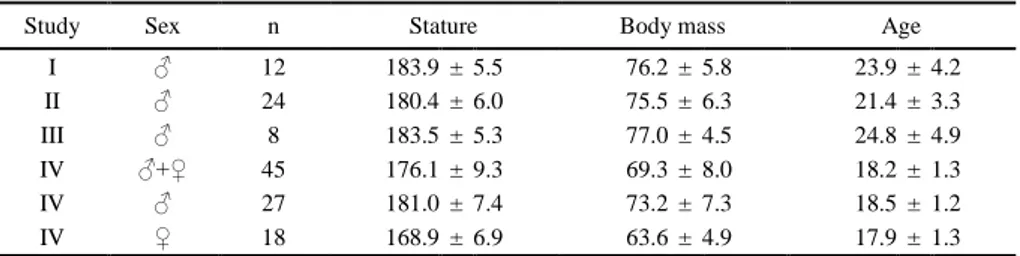
Table 1. The characteristics of the subjects included in Study I – IV
Study Sex n Stature Body mass Age I ♂ 12 183.9 ± 5.5 76.2 ± 5.8 23.9 ± 4.2 II ♂ 24 180.4 ± 6.0 75.5 ± 6.3 21.4 ± 3.3 III ♂ 8 183.5 ± 5.3 77.0 ± 4.5 24.8 ± 4.9 IV ♂+♀ 45 176.1 ± 9.3 69.3 ± 8.0 18.2 ± 1.3 IV ♂ 27 181.0 ± 7.4 73.2 ± 7.3 18.5 ± 1.2 IV ♀ 18 168.9 ± 6.9 63.6 ± 4.9 17.9 ± 1.3 The values representing the subjects’ stature, body mass, and age are presented as mean ± SD; ♂ is men; ♀ is women; n is the number of subjects in the specific study; stature is the height of the subjects (cm); body mass is the body mass of the subjects (kg); and age is the age of the subjects (years).
Test equipment
Test data were collected during treadmill roller-skiing tests (I – III) and ski-ergometer tests (III – IV) by using equipment for oxygen uptake, blood-lactate concentration, force and displacement measurements.
Measurements of oxygen uptake
During the oxygen-uptake tests, variables of expired air were continuously analysed using a metabolic cart in mixing-chamber mode (Jaeger Oxycon Pro, Erich Jaeger Gmbh, Hoechberg, Germany) for determination of oxygen uptake. Before each test, the equipment was calibrated according to the specifications of the manufacturer. The equipment has previously been shown to be an accurate system for measuring oxygen uptake (CV: 1.2% and P < 0.05 at oxygen uptakes between 0.5 and 6.0 l∙min-1
METHODS
12
Measurements of blood-lactate concentration
During and after the roller-skiing tests, capillary-blood samples were collected. They were subsequently analysed to determine the subject’s blood-lactate concentrations (Biosen 5140, EKF-diagnostic Gmbh, Barleben, Germany). The equipment was calibrated according to the specifications of the manufacturer and it has previously been reported to be a valid and reliable [91].
Roller-skiing tests
The tests of V̇O2obla and V̇O2max were commenced roller-skiing on a motor-driven
treadmill (OJK-2, Telineyhtymä, Kotka, Finland (I – III); RL 3500, Rodby Innovation AB, Vänge, Sweden (II)) using the diagonal-stride technique. The subjects used roller skis (Pro-Ski C2, Sterner Specialfabrik AB, Dala-Järna, Sweden), provided by the sport-science laboratory, and their own poles with rubber-ski-pole tips (Biomekanikk A/S, Oslo, Norway).
Ski-ergometer test
For the measurements of upper-body power output in Study IV, a modified [26] air-braked Nordic ski ergometer (Concept II, Concept Inc., Morrisville, VT, USA) was used, which previously showed both high test-retest reliability (CV: 3.0% at power outputs between approximately 95 and 295 W) and high validity (i.e. power output in a 6-min double-poling test was correlated with a 3-km double-poling performance, r =0.86 and P < 0.05) [26]. The measurement of the horizontal double-poling force was conducted by using a load cell (546QDT, DS Europe, Milan, Italy), whereas the horizontal double-poling speed was registered by using a potentiometric displacement sensor (Burster 8718, Burster Praezisionsmesstechnik GmbH, Gernsbach, Germany). Before each new test, the load cell and displacement sensor was calibrated for zero load and 1-m displacement, respectively.
Measurements of physiological characteristics
The scaling analyses in Study I – III are based on different variables of oxygen uptake; Study I and II focuses on V̇O2max whereas the analyses in Study III are
based on V̇O2obla, V̇O2max, and V̇O2dp. In Study IV, the scaling analysis is based
on Ẇ. For detailed information about test procedures and protocols, see the studies.
Submaximal oxygen uptake
The roller-skiing test to determine V̇O2obla was a five-stage graded protocol where
the work intensity was increased every four minutes by increasing treadmill speed and/or inclination. A capillary-blood sample was collected between stages and during the last minute of each stage mean oxygen uptake was established. Based on the relationships between (a) relative work intensity (W∙kg-1) and blood-lactate
concentration and (b) relative work intensity and oxygen uptake, the V̇O2obla was
METHODS
Maximal oxygen uptake
During the V̇O2max test the work intensity was increased each minute, by regulating
either the inclination or speed of the treadmill, until volitional exhaustion. Two and five minutes after the time of volitional exhaustion, capillary-blood samples were collected. In Study I, the V̇O2max was defined as the highest mean oxygen uptake
during a 60-s period with a plateau (change in V̇O2 less than 2.1 ml∙min-1∙kg-1
between successive stages) in oxygen uptake; additionally, at least one of two secondary criteria (a respiratory exchange ratio ≥ 1.15 or a blood-lactate concentration > 8 mmol∙l-1) had to be fulfilled [92]. In Study II and III, the V̇O
2max
was defined as the highest mean oxygen uptake during a period of 60 s when meeting the criterion of an oxygen-uptake plateau proposed by Poole et al. [93].
Upper-body oxygen uptake
The 60-s double-poling test on a ski ergometer was used to determine V̇O2dp, which
was defined as mean oxygen uptake during the test duration.
Upper-body power output
The 120-s upper-body power-output test was used to determine mean propulsive power output from 5 to 120 s during double poling on a ski ergometer (Ẇ).
Timing system
Performance data in Study I – III were collected with time-base stations (EMIT eLine Base station, EMIT AS, Oslo, Norway), which communicate with the skiers’ individual timing chip with a built-in radio transceiver (emiTag, EMIT AS, Oslo, Norway). This timing system was used to collect section-split times (I), lap-split times (II), and completion times (I – III) during the cross-country skiing competitions. During the 2-km time trial in Study IV, the time to complete the double-poling roller-skiing time trial was registered by using a stop watch and rounded to the nearest second.
Collection of performance data
In Study I – III, results from competitions in cross-country skiing are used as dependent variables in the scaling analyses, whereas, results in the 2-km double-poling roller-skiing time trial were used as performance data in Study IV.
The competitive distance that is most common for distance races in World Cup competitions is 15 km among elite male skiers (e.g. during the season 2014 – 2015 approximately 85% of the World-Cup races, excluding races in the tours and World Championships, had a competitive distance of 15 km [see: fis-ski.com]), and performance data was therefore collected from 15-km classical-technique skiing competitions in Study I and II. The cross-country skiing performance that differ greatest from 15-km races in an energy-supply perspective is sprint competitions; therefore, to investigate the importance of body-mass exponent optimization in a
METHODS
14
broader perspective, performance data was collected from a 1.25 km classical-technique sprint prologue for elite male skiers in Study III. The competitions in Study I – III were performed on homologated courses (i.e. specific norms for height differences and an equal proportion of uphill, downhill and undulating terrain sections). In Study IV, power-function modelling was used to investigate how upper-body power-output should be scaled in relation to body mass to optimally explain performance during which the skiers used the same movement pattern as in the test; therefore, a 2-km double-poling roller-skiing time trial was used as performance data.
Competitive performance
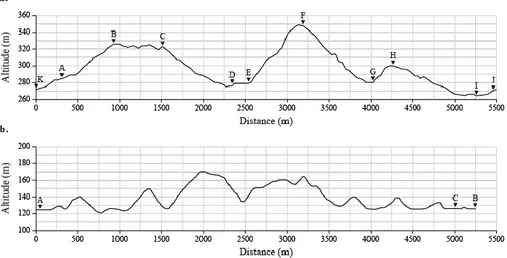
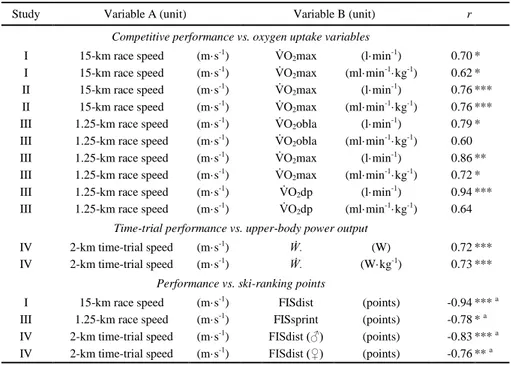
In Study I, the competitive-performance data were collected from a 15-km classical-technique skiing competition which comprised three laps on a 5.4-km course (i.e. a total race distance of 16.2 km). The course characteristics were: a total climbing of 161 m, an altitude difference of 84 m, and a maximum continuous climbing section of 68 m (Figure 1a). The timing system was used to collect completion time and section-split times were registered by using time-base stations (A – K) which were positioned throughout the course. In Study II, performance in a 15-km classical-technique skiing competition was evaluated. Time-base stations were positioned at start (A), lap split (B), and finish (C) (Figure 1b), which resulted in lap distances of 5.22 km (lap 1), 5.25 km (lap 2), and 5.00 km (lap 3). Each lap comprised a total climbing of 162 m, an altitude difference of 48 m, and a maximal continuous climbing section of 44 m.
Figure 1. Course profile of the 5-km lap in the 15-km competition in (a) Study I and (b) Study II, where
METHODS
In Study III, the competitive-performance data were collected from a 1.25 km classical-technique sprint prologue, which comprised a total climbing of 42 m, an maximal altitude difference of 22 m, and a maximum continuous climbing section of 17 m.
Time-trial performance
The 2-km double-poling roller-skiing time trial was performed along an asphalt road and no drafting or double poling with kick was allowed. The inclination of the road was equable throughout the 2-km course and comprised 40.5 m of total climbing (i.e. a mean inclination of 1.2°). The roller skis the subjects used during the time trial (Pro-Ski C2, Sterner Specialfabrik AB, Dala-Järna, Sweden) were provided by the sport-science laboratory.
Ski-ranking points
To investigate the generalisability of the performance data (i.e. competition and time-trial results), the International Ski Federation’s ski-ranking points for distance races (FISdist) and sprint races (FISsprint) were compiled from the actual FIS Cross-Country Lists at the time of the performance. The FIS-point system is constructed to indicate the performance capability of the skiers based on an average of the skier’s best five FIS-point results from the last twelve month. The FIS-point value a skier obtains in a competition is related to the ratio between the winner’s completion time and the skier’s completion time, characteristics of the competition (sprint or distance race, individual or mass-start), and the performance capability of the three best skiers who finished among top five.
Statistical analyses
To investigate the importance of body-mass exponent optimization for evaluation of performance capability in cross-country skiing, the optimal body-mass exponent was determined for different oxygen-uptake variables and upper-body power output to evaluate performance in distance races (I – II), a sprint race (III), and a 2-km time trial (IV). The performance evaluation was based on finding the optimal ratio between the physiological variable and body mass in accordance with a previously described allometric-scaling approach in Model (3) and (4) [29]. In addition to the studies included in this thesis, this allometric-scaling approach has previously been used to evaluate performance in other endurance sports, such as cycling [47-49], running [29,45,46], and rowing [50-53].
Evaluation of competitive performance
Previously, it was suggested that the average speed of a performance was more symmetric, normally distributed and linearly related to other variables (such as V̇O2max) compared to the completion time [29,48,50]; therefore, the subjects’
METHODS
16
completion times were converted to race speeds, which were used as a race-performance measure for subsequent scaling analyses.
In Study I – III, the aim was to establish the most appropriate scaling of oxygen-uptake variables (V̇O2var), i.e. V̇O2obla, V̇O2max or V̇O2dp, to optimally reflect
race speed in cross-country skiing competitions (15-km or sprint-prologue race speed). The following power-function model was used to explore the optimal relationship between race speed, V̇O2var, and body mass:
race speed = β0 · V̇O2varβ1· mβ2 · ε, (5)
where race speed is the mean skiing speed for the actual race (m·s-1); β0 is a
constant; V̇O2var is the oxygen-uptake variable of interest (l·min-1); m is the body
mass (kg); ε is the multiplicative error ratio; and β1 and β2 are the scaling exponents.
Log-transformation of Model (5) yielded:
loge race speed = loge β0 + β1 · loge V̇O2var + β2 · loge m + loge ε. (6)
Linearization of the model allowed linear regression to be used to estimate the constant β0 and the scaling exponents β1 to β2.
Evaluation of time-trial performance
In Study IV, the subjects’ completion times were converted to mean skiing speeds of the 2-km time-trial performance. In accordance with the allometric-scaling approach used for the competitive-performance data, the following power-function model was applied to evaluate how the subjects’ Ẇ and body mass influenced the time-trial speed, where sex and age were included as potential covariates in the model: time-trial speed = β0 · Ẇ
β1· mβ2 · eβ3 ∙ sex + β4∙ age · ε, (7)
where time-trial speed is the mean roller-skiing speed for the 2-km double-poling roller-skiing time trial (m·s-1); β0 is a constant; Ẇ is the upper-body power output
(W), i.e. the rate at which external mechanical work is performed double poling on the ski ergometer; m is the body mass (kg); e, base of the exponential function; sex is coded 0 for the women and 1 for the men; age is the subjects age (years); ε is the multiplicative error ratio; and β1 to β4 are the scaling exponents. To estimate β0 to β4,
the Model (7) was linearized and the log-transformation yielded:
loge time-trial speed = loge β0 + β1 · loge Ẇ + β2 · loge m + β3 · sex + β4 · age
+ loge ε. (8)
Model (8) enabled linear regression to be used to estimate the constant β0 and the
METHODS
Evaluation of performance in different sections
In Study I, a secondary aim was to evaluate the influence of course inclination on the body-mass exponent for V̇O2max; hence, the following power-function model
was applied to the section speeds (i.e. the inverse transformation of section-split times) to describe the effect of V̇O2max, body mass, and course-profile
characteristics on the section speeds: section speed = b0 · V̇O2max
b1 · m(b2 + b3 · α) · eb4 · Δ + (1|Id) · ε, (9)
where section speed is mean skiing speed for the course section (m·s-1); b0 is a
constant; V̇O2maxis maximal oxygen uptake (l·min-1); m is body mass (kg); α is the
mean inclination of the course section (°); e, base of the exponential function; Δ is the altitude difference of the previous course section (m); (1|Id) is a random effect to account for within-participants variation [94], where Id is the identity number of the participants from 1 to 12; ε is the multiplicative error ratio; b1, b2, b3, and b4 are the
scaling exponents used for the evaluation of mean skiing speed for the course sections based on the predictor variables: V̇O2max, m, α, and Δ. Log-transformation
of the Model (9) gives the following equation:
loge section speed = loge b0 + b1 · loge V̇O2max + (b2 + b3 · α) · loge m + b4 · Δ
+ (1|Id) + loge ε. (10)
Linearization of the model allowed linear regression to be used to estimate the constant b0 and the scaling exponents b1 to b4.
Evaluation of performance in different laps
In Study II, a secondary aim was to evaluate the influence of distance covered on the body-mass exponent for V̇O2max. The following power-function model was applied
to the lap speeds (i.e. inverse transformation of lap-split times) to describe the effect of V̇O2max, body mass, lap number, and age on the lap speeds:
lap speed = b0 · V̇O2max
b1
· m(b2 + b3 · lap) · eb4 · age + (1|Id) · ε, (11) where lap speed is the mean skiing speed for the actual lap (m·s-1); b0 is a constant;
V̇O2maxis the maximal oxygen uptake (l·min-1); m is body mass (kg); lap is the
number of the lap coded as lap 1 = 0, lap 2 = 1, and lap 3 = 2; e is the base of the exponential function; age is the age of the subject (years); (1|Id) is a control for random effects to account for potential within-subjects variation [94], where Id is the identity number of the subjects from 1 to 24; ε is the multiplicative error ratio; and b1, b2, b3, and b4 are the scaling exponents used to explain the lap speed based
on the independent variables of V̇O2max, m, lap, and age, respectively.
METHODS
18
loge lap speed = loge b0 + b1 · loge V̇O2max + (b2 + b3 · lap) · loge m + b4 · age
+ (1|Id) + loge ε. (12)
Model (12) enabled linear regression to be used to estimate the constant b0 and the
scaling exponents b1 to b4.
Correlation analyses
Before the power-function modelling and correlation analyses, the normality of each variable’s distribution was investigated by using the Shapiro-Wilk test. To evaluate linear relationships between variables, Pearson’s product-moment correlation coefficient (r) test was used. In Study I – III, the correlations between competitive performance (i.e. race speed) and oxygen-uptake variables (i.e. V̇O2obla, V̇O2max,
and V̇O2dp) expressed both absolutely (l·min-1) and as a simple ratio-standard
(ml·min-1·kg-1) were investigated. In Study IV, the relationships between the 2-km time-trial performance (i.e. time-trial speed) and the absolute (W) as well as the simple ratio-standard expression (W·kg-1) of Ẇ were evaluated. The relationships between performance (i.e. race speed and time-trial speed) and FIS points (i.e. FISsprint and FISdist) were evaluated in Study I, III and IV.
Analysis of lap-speed differences
To investigate lap-speed differences in Study II, a one-way repeated measures analysis of variance (ANOVA) was used with post-hoc tests using Bonferroni’s correction.
Level of significance
All of the statistical tests were performed at an alpha of 0.05.
Statistical programs
The statistical analyses were processed using the R statistical data program, version 2.13.2 (R Development Core Team, Auckland, New Zealand) and IBM Statistical Package for the Social Sciences (SPSS) statistics software, version 20 (IBM Corporation, New York, USA).
Ethical considerations
All of the subjects in Study I – IV provided written informed consent to participate. The Ethics Committee at Dalarna University, Falun, Sweden (I) and the Regional Ethical Review Board, Uppsala, Sweden (II – IV) approved the studies. The test procedures in the studies were performed in accordance with the World Medical Association Declaration of Helsinki – Ethical Principles for Medical Research Involving Human Subjects 2008.
RESULTS
Results
Physiological measurements
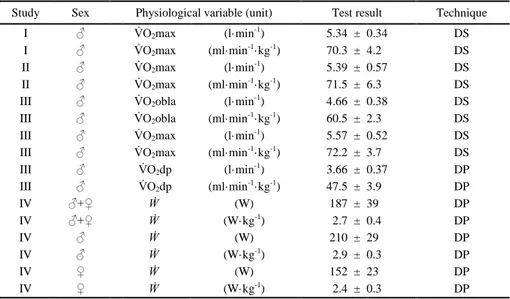
The test results related to the physiological measurements in Study I – IV are displayed in Table 2.
Table 2. The test results in Study I – IV
Study Sex Physiological variable (unit) Test result Technique I ♂ V̇O2max (l·min-1) 5.34 ± 0.34 DS I ♂ V̇O2max (ml·min-1·kg-1) 70.3 ± 4.2 DS II ♂ V̇O2max (l·min-1) 5.39 ± 0.57 DS II ♂ V̇O2max (ml·min-1·kg-1) 71.5 ± 6.3 DS III ♂ V̇O2obla (l·min-1) 4.66 ± 0.38 DS III ♂ V̇O2obla (ml·min-1·kg-1) 60.5 ± 2.3 DS III ♂ V̇O2max (l·min-1) 5.57 ± 0.52 DS III ♂ V̇O2max (ml·min-1·kg-1) 72.2 ± 3.7 DS III ♂ V̇O2dp (l·min-1) 3.66 ± 0.37 DP III ♂ V̇O2dp (ml·min-1·kg-1) 47.5 ± 3.9 DP
IV ♂+♀ Ẇ. (W) 187 ± 39 DP IV ♂+♀ Ẇ. (W·kg-1) 2.7 ± 0.4 DP IV ♂ Ẇ. (W) 210 ± 29 DP IV ♂ Ẇ. (W·kg-1) 2.9 ± 0.3 DP IV ♀ Ẇ. (W) 152 ± 23 DP IV ♀ Ẇ. (W·kg-1) 2.4 ± 0.3 DP Study is the number of the study referred to in this thesis; ♂ is men; ♀ is women; V̇O2max is maximal oxygen uptake; V̇O2obla is oxygen uptake related to a blood-lactate concentration of 4 mmol∙l-1; V̇O2dp is mean upper-body oxygen uptake; Ẇ is mean upper-body power output; the test results for each variable are presented as mean ± SD; DS means the test was performed using the diagonal-stride technique; and DP means the test was performed using the double-poling technique.
Performance data
The 15-km race speeds were 5.23 ± 0.32 m·s-1 and 5.83 ± 0.41 m·s-1 in Study I and II, respectively. In Study III, the 1.25-km race speed in the sprint prologue was 6.33 ± 0.14 m·s-1. In Study IV, time-trial speed in the 2-km double-poling roller-skiing time trial was 5.07 ± 0.32 m·s-1.
RESULTS
20
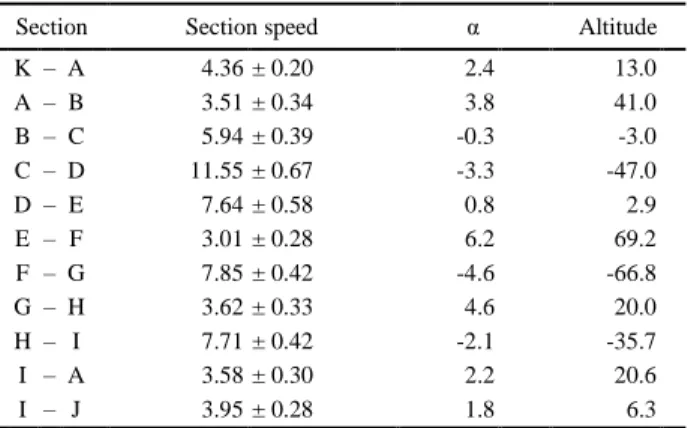
In Study I, performance data were collected from eleven different sections and the section speeds are displayed in Table 3.
Table 3. Performance data and course characteristics
Section Section speed α Altitude K – A 4.36 ± 0.20 2.4 13.0 A – B 3.51 ± 0.34 3.8 41.0 B – C 5.94 ± 0.39 -0.3 -3.0 C – D 11.55 ± 0.67 -3.3 -47.0 D – E 7.64 ± 0.58 0.8 2.9 E – F 3.01 ± 0.28 6.2 69.2 F – G 7.85 ± 0.42 -4.6 -66.8 G – H 3.62 ± 0.33 4.6 20.0 H – I 7.71 ± 0.42 -2.1 -35.7 I – A 3.58 ± 0.30 2.2 20.6 I – J 3.95 ± 0.28 1.8 6.3 Section speed (m·s-1) between time-base stations (Figure 1a) are presented as mean ± SD; α is mean inclination of the actual course section (°); and altitude is altitude difference of the actual course section (m).
In Study II, the lap speeds for the three consecutive laps of the 5-km course were 6.08 ± 0.39 m·s-1, 5.76 ± 0.42 m·s-1, and 5.66 ± 0.43 m·s-1. The one-way repeated measures ANOVA displayed a significant effect of lap number on the pacing-induced lap speeds (F2,46 = 221.32, P < 0.001, partial η2 = 0.906). Post-hoc tests,
using Bonferroni’s correction, revealed a consecutive reduction in lap speed for each new lap (lap 1 vs. lap 2, P < 0.001; lap 2 vs. lap 3, P < 0.001).
Ski-ranking points according to FIS-point system were: FISdist = 121.7 ± 58.1 points (I); FISsprint = 95.5 ± 26.5 points (III); FISdist (♂) = 171.4 ± 79.9 points and FISdist (♀) = 156.2 ± 93.7 points (IV).
RESULTS
Correlations
The performance-related correlations in Study I – IV are presented in Table 4.
Table 4. Performance-related correlations in Study I – IV
Study Variable A (unit) Variable B (unit) r Competitive performance vs. oxygen uptake variables
I 15-km race speed (m·s-1) V̇O2max (l·min-1) 0.70 * I 15-km race speed (m·s-1) V̇O
2max (ml·min-1·kg-1) 0.62 * II 15-km race speed (m·s-1) V̇O2max (l·min-1) 0.76 *** II 15-km race speed (m·s-1) V̇O
2max (ml·min-1·kg-1) 0.76 *** III 1.25-km race speed (m·s-1) V̇O
2obla (l·min-1) 0.79 * III 1.25-km race speed (m·s-1) V̇O
2obla (ml·min-1·kg-1) 0.60 III 1.25-km race speed (m·s-1) V̇O
2max (l·min-1) 0.86 ** III 1.25-km race speed (m·s-1) V̇O
2max (ml·min-1·kg-1) 0.72 * III 1.25-km race speed (m·s-1) V̇O
2dp (l·min-1) 0.94 *** III 1.25-km race speed (m·s-1) V̇O
2dp (ml·min-1·kg-1) 0.64
Time-trial performance vs. upper-body power output IV 2-km time-trial speed (m·s-1) Ẇ. (W) 0.72 *** IV 2-km time-trial speed (m·s-1) Ẇ. (W·kg-1) 0.73 ***
Performance vs. ski-ranking points I 15-km race speed (m·s-1) FISdist (points) -0.94 *** a III 1.25-km race speed (m·s-1) FISsprint (points) -0.78 * a IV 2-km time-trial speed (m·s-1) FISdist (♂) (points) -0.83 *** a IV 2-km time-trial speed (m·s-1) FISdist (♀) (points) -0.76 ** a Study is the number of the study referred to in this thesis. Relationships between performance and test variables as well as between performance and ski-ranking points are presented as Pearson’s product-moment correlation coefficients (r). Alpha levels of significance are: * for P < 0.05; ** for P < 0.01; and *** for P < 0.001. V̇O2max ismaximal oxygen uptake; V̇O2obla is oxygen uptake related to a blood-lactate concentration of 4 mmol∙l-1; V̇O
2dp is mean upper-body oxygen uptake; Ẇ is mean upper-body power output; FISdist is International Ski Federation’s ski-ranking points for distance races; FISsprint is International Ski Federation’s ski-ranking points for sprint races; ♂ is men; and ♀ is women.
Power-function modelling
Results of the power-function modelling for evaluation of the performance-related variables in Study I – IV are presented below.
Modelling of competitive performance
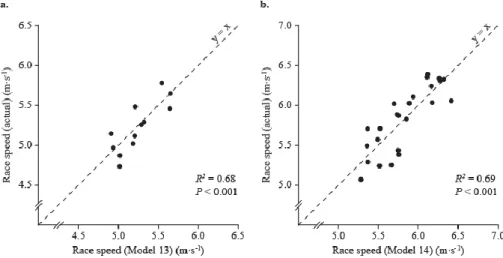
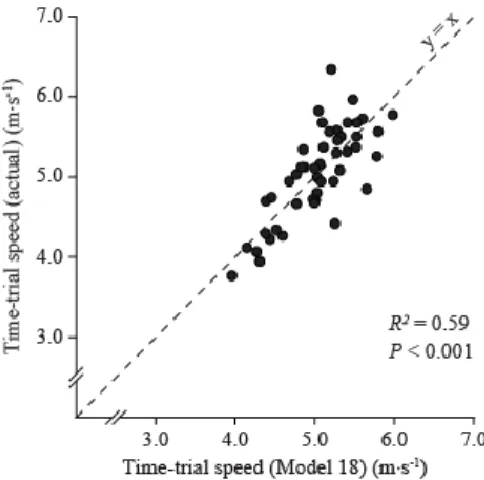
Statistical modelling to evaluate competitive performance were based on log-transformed Model (6) and the subsequent retransformation of the model yielded the following model to optimally explain race speed for the 15-km races in Study I – II:
15-km race speed (I)
race speed = 7.86 · V̇O2max· m -0.48
RESULTS
22
Model (13) explained 68% of the variance in race speed in the 15-km classic technique skiing competition (P < 0.001), and all variables contributed to the model (all P < 0.01) (Figure 2a).
15-km race speed (II)
race speed = 8.83 · (V̇O2max · m –0.53)0.66 (14)
Model (14) explained 69% of the variance in race speed in the 15-km classic technique skiing competition (P < 0.001), and all variables contributed to the model (all P < 0.05) (Figure 2b).
Figure 2. Relationships between actual and model race speeds in the 15-km classical-technique skiing
competition according to (a) Model (13) in Study I, and (b) Model (14) in Study II.
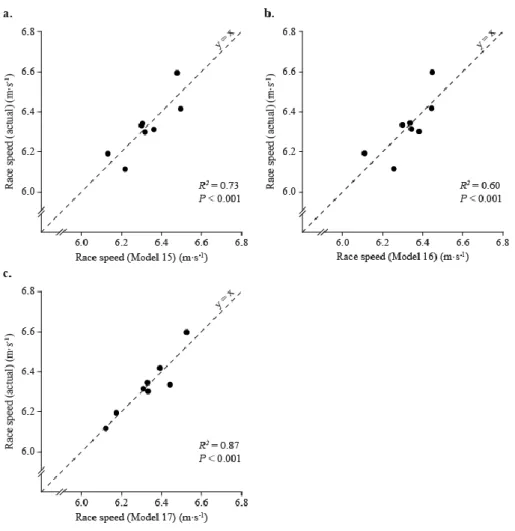
1.25-km race speed (III)
Power-function modelling based on Model (6), for the oxygen-uptake variables V̇O2obla, V̇O2max, and V̇O2dp, revealed that the body mass failed to contribute
significantly to each of the models; however, the oxygen-uptake variable of interest contributed to the specific model.
race speed = 1.09 · V̇O2obla0.21 (15)
Model (15) explained 60% of the variance in the race speed in the 1.25-km classic technique race (P = 0.024) (Figure 3a).
RESULTS
race speed = 1.05 · V̇O2max0.21 (16)
Model (16) explained 73% of the variance in the race speed in the 1.25-km classic technique race (P = 0.0073) (Figure 3b).
race speed = 1.19 · V̇O2dp0.20 (17)
Model (17) explained 87% of the variance in the race speed in the 1.25-km classic technique race (P < 0.001) (Figure 3c).
Figure 3. Relationships between actual and model race speeds in the 1.25-km classical-technique sprint
RESULTS
24
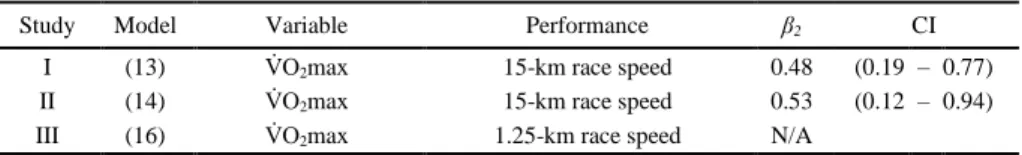
Optimal body-mass exponents for V̇O2max
To investigate the importance of body-mass exponent optimization for evaluating competitive performance capability in cross-country skiing, the CIs for the body-mass exponents were calculated. The optimal body-body-mass exponents (β2) for V̇O2max
to explain competitive performance among elite male cross-country skiers are presented in Table 5.
Table 5. The optimal body-mass exponents (β2) for V̇O2max to explain competitive performance among elite cross-country skiers
Study Model Variable Performance β2 CI
I (13) V̇O2max 15-km race speed 0.48 (0.19 – 0.77) II (14) V̇O2max 15-km race speed 0.53 (0.12 – 0.94) III (16) V̇O2max 1.25-km race speed N/A Study is the number of the study referred to in this thesis; model is the number of the model where equation for optimal model to explain performance is presented; variable is the test variable the modelling is based on; performance is the performance-related variable; β2, the body-mass exponent for V̇O2max that optimally explains performance in
accordance with the model: race speed = β0 · V̇O2maxβ1· mβ2 · ε, where race speed is the mean skiing speed for the
actual performance (m·s-1); β
0 is a constant; V̇O2max is the maximal oxygen uptake (l·min-1); m is the body mass (kg); ε
is the multiplicative error ratio; and β1 and β2 are the scaling exponents used to explain race speed; CI is 95% confidence
interval for β2; N/A, not applicable because m did not contribute to the model (i.e. β2 can not be expected to be different
from 0)
If the body-mass exponent’s CI for a specific variable/performance-combination in Table 5 does not include 0, the absolute expression of the physiological variable should not be recommended for evaluating performance capability of elite male skiers; conversely, if 1 is not included in the CI, the simple ratio-standard scaled expression of the variable should not be recommended for performance-capability evaluation.
RESULTS
Modelling of time-trial performance
Power-function modelling to evaluate performance in the 2-km time-trial roller skiing using the double-poling technique were based on the log-transformed Model (8) and the subsequent retransformation demonstrated the following model to optimally explain time-trial speed in Study IV:
time-trial speed = 1.06 · (Ẇ · m-0.57)0.56 (18) Model (18) explained 59% of the variance in the time-trial speed in the 2-km double-poling roller-skiing time-trial (P < 0.001), and all variables contributed to the model (all P < 0.05) (Figure 4).
Figure 4. Relationships between actual and model time-trial speeds in the 2-km double-poling
RESULTS
26
Modelling of performance in different sections
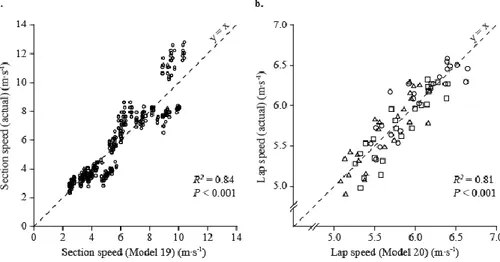
In Study I, statistical modelling to evaluate section speeds during the 15-km classic technique skiing competition was based on Model (10) and the subsequent retransformation of the model yielded:
section speed = 5.96 · V̇O2max· m-(0.38 + 0.03 · α) · e-0.003 · Δ (19)
Model (19) explained 84% of the variance in section speed (P < 0.001) and all variable contributed to the model (all P < 0.01) (Figure 5a).
Modelling to explain performance in different laps
In Study II, power-function modelling was used to evaluate the influence of distance covered on the body-mass exponent for V̇O2max. The modelling was based on
Model (12) and the subsequent retransformation of the model yielded:
lap speed = 5.89 · (V̇O2max · m-(0.49 + 0.019 · lap)) 0.43 · e0.010 · age, (20)
Model (20) explained 81% of the variance in lap speed (P < 0.001) and all variable contributed to the model (all P < 0.05) (Figure 5b).
Figure 5. Relationships between (a) actual and Model (19) section speeds in the 15-km
technique skiing competition in Study I, and (b) actual and Model (20) lap speeds in the 15-km classical-technique skiing competition in Study II, where lap 1 is represented by circles; lap 2, squares; and lap 3, trian
DISCUSSION
Discussion
Principal findings
The aim of this doctoral thesis was to investigate the importance of body-mass exponent optimization for the evaluation of performance capability in cross-country skiing; therefore, different skiing performances were used in the power-function models as dependent variables whereas the anthropometric variable (i.e. body mass) and the physiological characteristic (i.e. V̇O2max or Ẇ) were independent variables
that were supposed to explain performance. The power-function modelling demonstrated that the optimal V̇O2max-to-mass ratios to explain 15-km race speed
were V̇O2max divided by body mass raised to the 0.48 and 0.53 power in Study I
and II, respectively. Therefore, it may be recommend that V̇O2max divided by the
square root of body mass (ml·min-1·kg-0.5) should be used when elite male skier’s performance in 15-km classical-technique skiing competitions is evaluated. The confidence intervals for the derived body-mass exponents included neither 0 nor 1; this indicates that to accurately explain 15-km performance among elite male skiers both the absolute and simple ratio-standard scaled expressions should be avoided. This claim appears also to be valid for evaluating performance in a 2-km double-poling roller-skiing time trial based on the skiers’ Ẇ and body mass as a consequence of the confidence interval for the optimal body-mass exponent of 0.57 not including either 0 or 1. Hence, evaluation of performance in classical-technique sprint prologues among elite male skiers should be based on oxygen-uptake variables expressed absolutely, because the simple ratio-standard scaled expression entails a risk of misinterpreting skier’s performance capability.
In Study I, the influence of course inclination on the body-mass exponent for V̇O2max was investigated, and it was revealed that an increased inclination is related
to a contemporary increase in the body-mass exponent. Moreover, the power-function modelling in Study II indicated that the body-mass exponent for V̇O2max is
also influenced by the distance covered of the 15-km classical-technique skiing competition and the exponent increased for each new lap on the 5-km course.
Theoretical perspectives
Results from Study I and II indicate that a 0.5 body-mass exponent for V̇O2max
optimally explains performance in 15-km classical-technique skiing competitions among elite male skiers; however, is this exponent supported theoretically?
The maximal force (F) a muscle can produce is related to its cross-sectional area [95-98]; hence, muscle force is proportional to length (L) raised to the 2nd power (F ~ L2). Furthermore, work performed (W) is the function of force multiplied with length (W ~ F ∙ L); consequently, work performed is proportional to length raised to the 3rd power (W ~ L3) [28].
Work performed is related to energy expenditure whereas V̇O2max is an