Measuring function and
mobility among clients with
diabetes in Samoa
MAINSUBJECT: Diabetic foot AUTHOR: Kavita Kerai AUTHOR: Louise Roser
SUPERVISOR: Nerrolyn Ramstrand JÖNKÖPING: 2016-05-18
1. Summary
The aim of the thesis was to collect baseline data and to investigating suitable physical tests and a self-rapport questionnaire. Collected data was used to find a routine measurement when investigating foot health, function and mobility among clients suffering from diabetes in Samoa. Twenty-one
participants suffering from diabetes were included in the study. Clients answered the Foot function index (FFI) questionnaire and performed physical tests, consisting of Bergs balance scale (BBS) and Time up and go (TUG). Results from the physical tests revealed a great balance disturbance and mobility limitations among the majority of the clients. General high weight and BMI was measured among both genders. Subjects with the highest BMI performed lowest time during TUG test. The statistic analyze revealed a strong correlation between the two physical tests, indicating that one of the tests could be applied as a routine measurement in the future, when evaluating function and mobility in Samoa. The compilation of self-report questionnaires indicated a general good foot health with a low amount of pain, disabilities and activity limitations.
1 Sammanfattning
Syftet med studien var att samla in grundata och att hitta ett lämpligt fysiskt test och ett självadministrativt formulär. Den insamlade grunddatan användes för att hitta ett rutinmässigt mätinstrument för undersökning av fothälsa, funktion och mobilitet hos klienter som lider av diabetes i landet Samoa. I undersökningen deltog 21 personer som lider av diabetes. Deltagarna fick besvara ett så kallat ”Foot Function Index formulär” (FFI) och utföra de två fysiska testerna ”Bergs Balance Scale” (BBS) och ”Time Up and Go” (TUG). Resultaten från de fysiska testerna påvisade såväl en stor
balansrubbning som mobilitetsbegränsningar hos majoriteten av deltagarna. Ett generellt högt BMI-värde och stor vikt uppmättes hos båda könen. Personer med högst BMI-BMI-värde presterade kortast tid under TUG-testet. Den statistiska analysen påvisade en stark korrelation mellan de två fysiska testen, vilket indikerar att endast ett av testerna kan användas som mätinstrument i framtida undersökningar av funktion och mobilitet på Samoa. Sammanställningen av de självadministrativa formulären
påvisade en generellt god fothälsa med begränsad smärta, oförmåga och aktivitetsbegränsning hos deltagarna i studien.
1. Summary ... 2
1 Sammanfattning ... 3
2. Introduction ... 1
3. Background ... 2
3.1 Diabetes ... 2
3.2 Samoa - the risk factors associated with the country ... 2
3.3 Physical activity and mobility ... 2
3.4 Prevention programs ... 3
3.5 ICF ... 3
3.6 Previous studies ... 4
4. Study aim and expected results ... 5
5. Material and method ... 6
5.1 Participants ... 6 5.2 Test procedures ... 7 5.3 Physical tests ... 7 5.4 Data analysis ... 8 5.5 Ethical considerations ... 8
6. Results ... 8
6.1 FFI ... 9 6. 2 TUG... 10 6.3 BBS ... 116.4 Correlation between independent variables and the TUG ... 12
6.5 Comparison of TUG and BBS among amputees and non-amputees ... 13
6.6 Statistical analysis ... 13
8. Discussion ... 14
8.1 Comparing the results from BBS and TUG with previous studies ... 14
8.2 Evaluation of the self-report questionnaire ... 15
8.3 The link between BMI and mobility ... 15
8.4 Deciding the appropriate measurement instruments ... 16
8.5 Validity and reliability of the study ... 17
8.6 Limitations of the study ... 18
8.7 Recommendations to Motivation Australia ... 18
9. Conclusions ... 19
9.1 Acknowledgement... 19 9.2 Conflicts of interest ... 1910. References ... 20
Appendix 1 ... 24
Appendix 2 ... 25
Appendix 3 ... 27
Appendix 4 ... 30
1 2. Introduction
Diabetes mellitus is a common disease, affecting people both in developed- and developing countries. Globally, diabetes is one of the top 10 leading causes of disability (International Diabetes Federation, 2010) and approximately 80 % of people suffering from diabetes live in developing countries (Guell & Unwin, 2015). In 2014 diabetes among individuals over the age of 18 was estimated to be 9% in the world (World Health Organisation, 2014).
Unstable insulin and blood sugars as a result from diabetes, affects the entire body over time (Goldhaber-Fiebert, Goldhaber-Fiebert, Tristán, & Nathan, 2003; Win Tin, Gadabu, Iro, Tasserei, & Colagiuri, 2013); WHO, 2016). Medical complications associated with diabetes are neuropathy, angiopathy, foot deformities, local tissue injuries and pressure overload (Alavi et al., 2014; Haji Zaine et al., 2014). These complications can affect the distal parts of the lower extremities by causing foot wounds and foot ulcers (Boulton, 2008; de Rekeneire & Volpato, 2015). Because of the medical complications, foot ulcers and wounds for persons with diabetes often fail to heal (National Evidence-based guideline, 2011). Ulcers that are not appropriately managed can have severe consequences and amputation of lower limbs is one of these (Alavi et al., 2014). Samoa, a group of islands located in the south western pacific, has a very high level of diabetes mellitus type 2, which is caused by poor diet, hypertension and obesity. Nearly 11, 3 % of the adult population in Samoa suffers from diabetes type 2, and 21.5 % in American Samoa (DePue et al., 2010; Dibello et al., 2009). The awareness of the disease is reported to be limited among the population of Samoa. It is estimated that less than 50% of adults over 50 years of age are aware of their diabetes (Dibello et al., 2009). Diabetes is linked to an increased risk of developing disability and mobility limitations. Limitations in muscles strength and muscle activity are potential factors linking diabetes and disabilities (de Rekeneire & Volpato, 2015). The International Classification of Functioning, Disability and Health (ICF), developed by World Health Organization (WHO), has defined mobility as being able to move by changing body position or to ambulate independently from one point to another, and body function as the execution of a task or action (WHO, 2002). Several studies agree to the fact that older subjects with diabetes have poorer mobility and physical function compared to subjects who do not suffer from diabetes mellitus (Ng, Lo, & Cheing, 2014; Sinclair, Conroy, & Bayer, 2008; Ward et al., 2014). Decreased mobility puts the person at risk of losing independence, which leads to muscle loss and therefore decreases quality of life (Rejeski et al., 2012). Early detection of mobility limitations is an important goal for preventing disabilities related to physical activities (Vasunilashorn et al., 2009). Improved physical activity and intervention programs can reduce mobility limitations for clients with diabetes (Morie et al., 2010; Rejeski et al., 2012). Inadequate foot health such as foot pain can be linked to limited mobility associated with gait- and balance issues as well as increasing the risk of falls (Hylton B. Menz et al., 2013). Foot health related complications must therefore be taken into consideration by the caregiver. Studies suggest that interventions focusing on foot health can have beneficial effects on physical performance (Hylton B. Menz et al., 2013). The hospital admissions and amputations can be prevented with appropriate foot care for subjects with diabetes (Wu, Driver, Wrobel, & Armstrong, 2007).
Mobility limitations affect clients in a variety of ways, both physiologically but also in relation to their activities of daily living, and their independence (Rejeski et al., 2012). The extent of mobility limitations in persons from Samoa with diabetes is unknown, so is any link that may exist between foot health and mobility. In order to evaluate
2
potential effects of intervention programs, appropriate instruments to measure both foot health and clientsmobility have to be established and evaluated.
3. Background 3.1 Diabetes
Diabetes mellitus mainly consists of two diverse types, type 1 and 2. Diabetes type 1 is characterized by faulty production of insulin, this form of the disease requires daily supervision of the insulin level in the body and typically appears at an early age. The second type, type 2, is also known as non-insulin dependent diabetes. This form of diabetes has been linked to obesity and poor diet. Type 2 diabetes accounts for 90% of diabetes mellitus in the world (WHO, 2016). Secondary to the diabetes, wound and foot ulcers can appear as a result of friction and sheer forces (Boulton, 2008). Shear forces appear when movement between plantar surface and the sole of the footwear become visible. When a wound develops in the skin, the threat of infection increases. Development of a foot ulcer is as high as 15-25 % for persons diagnosed with diabetes mellitus (Alavi et al., 2014; Burns, Wegener, Begg, Vicaretti, & Fletcher, 2009; Haji Zaine et al., 2014; Win Tin et al., 2013). As a result, a further risk for clients with diabetes is amputation due to poorly healing ulcers on the foot. The risk of lower-limb amputation is 15-46 times higher for persons with diabetes compared to non-diabetic clients. When an amputation has been undertaken, the probability of a contra lateral amputation is as high as 9-17% within the first year. This risk increases after each additional year (Alavi et al., 2014).
3.2 Samoa - the risk factors associated with the country
There are several reasons of the high prevalence of type 2 diabetes in the country. Previous studies have reported that Samoan people, with limited education and limitations in speaking the English language have significantly lower knowledge of their diabetes and its complications (Dibello et al., 2009). The islands relative isolation allows Samoan nationals to maintain traditional lifestyles, however colonization and modernization has greatly affected the health and life-style of the population (DePue et al., 2010). Poor diet leading to obesity is considered to be a major causative factor that is linked to the lifestyle of the Samoan citizens. The incidence of obesity among Samoan people has been reported as 34.1 % among men and 58.7 % among women (Keighley, McGarvey, Turituri, & Viali, 2006). The level of obesity and increased age, is related to low levels of mobility worldwide (Rejeski et al., 2012).
3.3 Physical activity and mobility
Complications related to diabetes have a considerable impact on mobility (de Rekeneire & Volpato, 2015). Limited mobility results in an increased risk of falls when the client is performing activities of daily, for example climbing stairs at home or walking on uneven ground (Ward et al., 2014). The association between foot health and mobility limitation have been carefully discussed in several studies (Hylton B. Menz et al., 2013; Novak, Burger, Marincek, & Meh, 2004; Keysor, Dunn, Link, Badlissi, & Felson, 2005) and foot pain has been demonstrated to have a significant correlation with mobility limitations in both men and women (Hylton B. Menz et al., 2013). Foot
3
problems, especially foot pain, have been shown to have an effect on balance and functional ability and is therefore considered as a risk factor associated with falling among elderly (H. B. Menz & Lord, 2001). Keysor et al., (2005) reports that persons with more problems with their feet, for example self-reported foot pain or structural deformities, preformed worse during physical tests and had limited mobility. Furthermore the proprioception of the ankle joint has been reported to be reduced, when comparing clients with diabetes and clients without. Ng et al., (2014) discuss the presence of a decrease in ankle muscle strength secondary to the diabetes. The weakening muscles and limited proprioception sense is a result of the limited circulation in the distal part of the lower extremities (Ng et al., 2014).
3.4 Prevention programs
In order to ensure good foot health and maximize mobility, studies recommend regular check-ups, safe and effective wound management, information about the effects of smoking, nutrition education and orthotic off-loading devices designed to prevent diabetes related deformities and ulcers (Alavi et al., 2014). Prevention programs are limited in Samoa and surrounding regions (Win Tin et al., 2013). Motivation Australia is one of the organisations running a preventing program in Samoa. Motivation Australia is a non-governmental organization, registered as an incorporated association in the beginning of 2007. The mission of the organization is to enhance the lives of people with a mobility disability in the Asian Pacific region. Their work is focused on the establishment and development of local and culturally appropriate mobility device services. This includes the provision of wheelchairs, walking aids, prosthetics and orthotics (Motivation Australia, 2016). The Mobility device service (MDS) has started a healthy footwear programme together with the medical- and community staff. The purpose with the program is to provide offloading devices, wound care and blood sugar education, to improve the life of individuals with diabetes in Samoa (Motivation Australia, 2014).
3.5 ICF
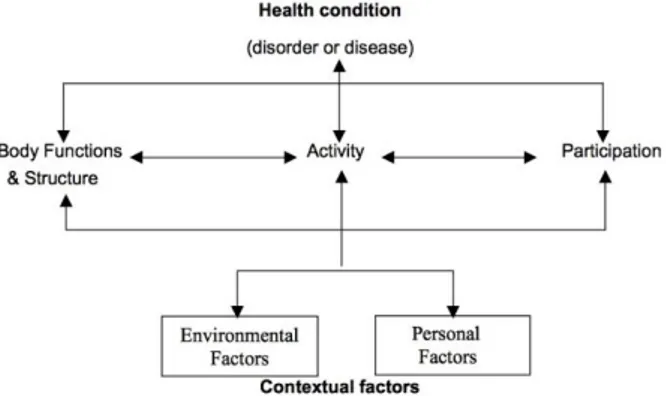
In order to determine how to best manage and assess treatment outcomes in persons with diabetic foot complications, it can be useful to consider the health condition of clients in terms of The International Classification of Functioning, Disability and Health. The aim of the publication is to provide a universal classification for use in health and health related sectors worldwide. Using the publication as a theoretical framework, it is relevant to consider factors that addresses body function, limitation in activity and participation, see figure 1 (WHO, 2002). This thesis will focus upon finding suitable self-rapport questionnaire and physical tests to measure mobility and foot health, which can be classified in the ICF as body function, body structure and activity. A parallel project is focusing on the participation domain.
4
Figure 1 demonstrates the association between the different components included in the ICF model (WHO, 2002).
3.6 Previous studies
Different instruments have been reported in the literature as a means of investigating foot complications associated with diabetes. There are also a number of instruments for measuring function and mobility (Rejeski et al., 2012) and physical tests (Codogno, Fernandes, & Monteiro, 2012). Limited studies have been conducted in developing countries where clients often have quite different needs and operate in different environments.
A number of studies have used self-rapport questionnaires to measure function and mobility among clients with diabetes (Caruso, Silliman, Demissie, Greenfield, & Wagner, 2000); Rejeski et al., 2012; Pua, Cowan, Wrigley, & Bennell, 2009). Other questionnaires have looked into foot function and pain associated with diabetes (Budiman-Mak, Conrad, Mazza, & Stuck, 2013; Burns et al., 2009). To measure mobility, the Foot Function Index (FFI) (Budiman-Mak et al., 2013), the Short-Form-36 health survey (SF-Short-Form-36) (Rejeski et al., 2012) and Foot health status questionnaire (FHSQ) (Burns et al., 2009) have been applied.
The Foot Function Index (Budiman-Mak et al., 2013) and a visual analogue scale (VAS) measuring pain in a combination with the Foot health status questionnaire (Burns et al., 2009) are tools that have been used when foot function and pain are measured in persons with diabetes. In a study, Novak et al., (2004) investigated mobility and foot pain among clients suffering from diabetes using the Foot Function Index. The study consisted of three groups, one healthy control group, on diabetes symptomatic neuropathy and a third group of clients without symptomatic neuropathy. Results showed a significantly higher pain score (FFI) among subjects with diabetes, suggesting that the measures are sensitive enough to detect change in this group of clients (Novak et al., 2004). In a systematic review conducted by Martin, Irrgang, Lalonde, & Conti, 2006, the purpose was to investigating alternative self-report questionnaires assessing different foot and ankle pathologies. The study reported findings of FFI being a useful tool among clients with a higher mean age, over 60. Additionally, the review suggested that FFI is a region specific instrument, meaning, the instrument can be used among a variously of different pathologies (Martin et al., 2006) with foot health related problems such as diabetic feet and rheumatoid arthritis (Novak et al., 2004). Studies have also reported the FFI being appropriate and have demonstrated good correspondence with the different domains included in the ICF (Budiman-Mak et al., 2013). Furthermore, studies agree with the high reliability and
5
validity in Foot Function Index (Budiman-Mak et al., 2013; Pourtier-Piotte et al., 2015). To the authors’ knowledge, questionnaires linking diabetic foot pathologies and mobility have not been tested in a developing country setting.
Besides self-report questionnaires, mobility and function can be assessed with different physical tests. Some of the physical tests that have been applied to measure function in subjects with diabetes are the Timed up and go test (TUG) (Cordeiro, Jardim, Perracini, & Ramos, 2009; Zakaria, Kuwae, Tamura, Minato, & Kanaya, 2015), Bergs balance scale (Cordeiro et al., 2009), functional reach test (Maranesi, Ghetti, Rabini, & Fioretti, 2014), and 6 minute walk test (Novak et al., 2004). The results from the studies using physical test such as TUG to measure mobility among subjects with diabetes, have reported that a limitation in mobility is associated with functional weakness (Cordeiro et al., 2009; Ng et al., 2014). The TUG test has been widely used and is appropriate regarding the validity and reliability, when quantifying functional mobility (Schoppen et al., 1999). The test has also been considered to be suitable when measuring mobility among elderly clients suffering from diabetes (Ng et al., 2014). TUG test and Bergs balance scale assess balance affecting the mobility in two different constructs. Studies have indicated a high correlation between the two physical tests (Cordeiro et al., 2009); Bennie et al., 2003). BBS has also showed a good reliability and validity (Whitney, Wrisley, & Furman, 2003). In a study conducted by Cordeiro et al., (2009) where TUG and Bergs balance scale were assessed, an independent association between referred activity of daily living (ADL) and functional balance measures was found. Similar results have appeared in other studies measuring mobility and function when using physical tests (Bogle Thorbahn & Newton, 1996; Cordeiro et al., 2009). Mobility limitations are associated with quality of life and an increased risk of falling (Ng et al., 2014). The risk of falling can be measured through the functional reach test, a measure of balance used to identify the risk of falling among elderly people (Maranesi et al., 2014). A similar task is included in the bergs Balance scale, see appendix 3, task no 8.
4. Study aim and expected results
The aim of this study is to collect baseline data and investigate suitable physical tests and a self-rapport questionnaire for measuring foot health, function and mobility of clients suffering from diabetes in Samoa.
The authors anticipate that baseline data collected in the present study can be used by Motivation Australia when evaluating the effects of different interventions for clients with diabetes in the future. We also expect that results related to specific outcome measures can be used to determine which tests will be used as a routine measure in the future.
6 5. Material and method
5.1 Participants
In this study 23 clients were recruited (11 men and 12 women) with assistance from staff at the Mobility Device Service in Samoa. The clinical tests related to this research were conducted in conjunction with each client’s appointment. To be eligible for the study participants were required to be over 18 years of age and suffering from diabetes type 1 or 2. They also had to be able to ambulate independently or with a walking aid. Clients who had undergone surgical removal of up to three phalanges were included in the study while clients who had undergone amputation of more than three phalanges or a partial foot amputation were excluded.
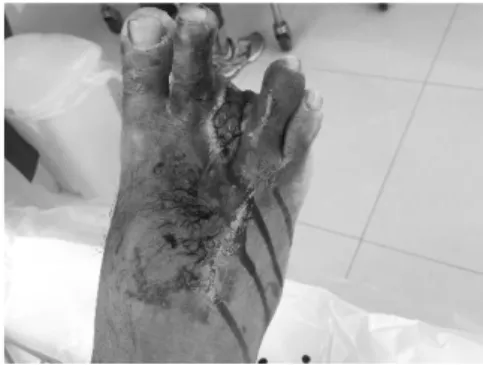
All tests were performed at the diabetic foot clinic at Tupua Tamasese Meaole Hospital. Before the assessments, all clients were informed of the aims of the study. Clients had to read through a written informed consent, see appendix 1, and give their approval by signing the document. The written consent informed clients that their identity willbe anonymous in all publications related to the study material. Furthermore the client was informed about the possibility to withdraw from the study at any time without consequences for their ongoing treatment (WHO, 2016). Before starting the assessments, clients’ length and weight were measured with clothing and shoes on. Level of amputation was noted, figure 2 shows a picture of a foot with an amputations. If the clients were using any orthotic devices, the specific design was noted, see figure 3.
Clients who had difficulties understanding the language in the questionnaire were given access to a translator who was in attendance throughout the whole process. During the assessment, photographs were taken with the client’s written approval on a standard form provided from the MDS.
Ethics approval was provided by the Government of Samoa, Ministry of health and the Health Research Committee of Samoa, see appendix 2.
7
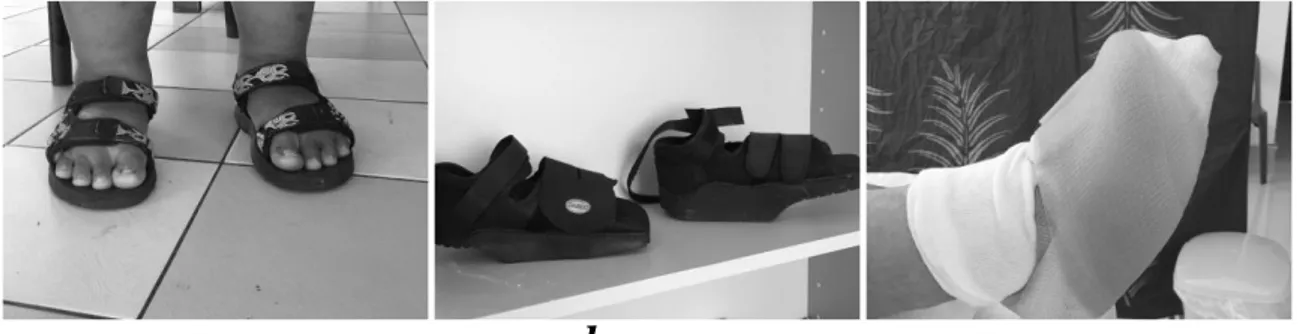
a b c
Figure 3. Three different orthotic devices, a) sandal with insole, b) heal- and forefoot off-loader, c) rigid non-removable foot orthosis.
5.2 Test procedures
The study is based on 3 different tests including a self-report-questionnaire, test of physical performance and balance test. The tests did not require any advanced equipment and were therefore suitable for use in a developing country context with limited resources.
The client started by answering the Foot function index questionnaire, see appendix 4. The English version of FFI was given to participants, which required approximately 10 minutes to complete.
The Foot function index consists of 23 questions. In each of the question, the client was asked to assess their ability in different situations, for example, to grade their foot pain in the morning, or their ability to climb stairs. The questionnaire represents three different subgroup consisting of pain, disability and activity. The client was asked to score the different items from 0-10 on a Visual Analog Scale (VAS), higher scores indicating a higher level of pain (Budiman-Mak et al., 2013; Pourtier-Piotte et al., 2015). The questionnaire was evaluated by calculating a total score and a score for each subcategory (Budiman-Mak et al., 2013).
5.3 Physical tests
The second test performed was the Time up and go test. During this test the client was asked to sit on a standard armchair with the back resting against the chair, a tree meter walkway was marked on the floor. The test was performed by asking the client walking to the mark, turn around, walk back and sit on the chair again, walking as quickly as possible. Stopwatches were used by both investigators and the meantime was used when analysing the data. The stopwatches were started when the back of the subject left the backrest and was stopped when the subjects touched the backrest again after walking. The test was repeated 3 times, with no resting opportunities for the clients. Out of the three measurements, the mean time was calculated. Clients using walking aids regularly were told to use them during the assessment (Rehabmeasures, 2014). The normal time to complete the TUG is estimated to be 7-10 seconds (Cordeiro et al., 2009). The test has shown high test-retest, reliability, when assessing mobility among elderly (Ng et al., 2014).
The last physical test performed was Bergs balance scale, see appendix 3, which required 10-15 minutes to perform. Standard equipment was used during all assessments, consisting of a stool with a height of 16 cm, two standard height chairs, one with armrests and one without. During the test clients performed 14 different
8
tasks, which were scored from 0-4 depending on how well they managed to complete the task. A score of “0” indicated the lowest level of performance and “4” indicated the highest. The investigators scored the clients ability separately after each section and then combined the scores together for a comparison. When different scores appeared, the client was asked to repeat the specific task again. The Bergs balance scale manual indicates that the lowest score as possible should be noted, in order to avoid the client’s physical capacity being overrated by the investigators. In the end, the scores was summed and compared with a table. Scores between 41-56 are a sign of a low fall risk, between 21-40 indicates on a medium fall risk and a score between 0-20 is a sign of a high fall risk (American Academy Of Health And Fitness, 2014).
5.4 Data analysis
Pearson’s correlation coefficient was used on normally distributed nominal data to investigate if a correlation exists between individual tests. When Pearson’s was not applicable, Spearman’s correlation coefficient was used to investigate the correlation between specific tests. The subjects included in the study were divided into three different BMI groups consisting of normal, BMI<25, overweight, BMI>25<30, and obese, BMI>30. BMI was calculated by the weight in kilos divided by the square of the eight in meters (kg/m2) (WHO, 2004). Clients were also divided into three different age groups consisting of 40-54, 55-69 and 70+. Differences in scores between the BMI groups and test parameters, gender, TUG, BBS and FFI, were analyzed by using the Kruskal- Wallis test.
Baseline data will be complied and provided to Motivation Australia and the Mobility device service in Samoa for future use.
5.5 Ethical considerations
Total anonymity was carefully considered throughout the process, each client was informed that their identity will not be revealed in the data that results from this thesis.
Clients who chose to participate in this study were not be exposed to any risk beyond the risks they are exposed to during their normal daily routine.
Ethics approval to perform the study was provided by the Government of Samoa, Ministry of health and the Health Research Committee of Samoa, see appendix 2. 6. Results
Twenty-three participants completed the tests, while twenty-one were included in the final analysis, (9 men and 12 women). Two clients were excluded from the analysis due to concomitant medical conditions not related to their diabetes and affecting balance and muscle strength. Specific information related to the participants who completed the assessments is presented in table 1.
The mean age of the participants was 59.4 (SD 8. 8). The average weight of men was 97.0 (SD 15.5). The weight and height measures resulted in a mean Body Mass index (kg/m2) value of 31.2 (SD 4.4) for men. Meanwhile average weight among women was 79.0 (SD 15.4), with a mean BMI of 28.3 (SD 4.5). 14.3% of the subjects used crutches while ambulating.
9
Table 1. Baseline Characteristics of the Participants
Characteristic Mean (SD) n=21 (%) Male (n=9) 9 (42.9) Female (n=12) 12 (57.1) Age 59.4 (±8.8) Weight (kg) 86.7 (±17.6) Male 97.0 (±15.5) Women 79.0 (±15.4) Height (cm) 170.7 (±6.9) Male 176.1 (±4.4) Female 166.6 (±4.4) BMI (kg/m2)α 29.6 (±4.6) Male 31.2 (±4.4) Female 28.3 (±4.5) Using crutches, n (%) 3 (14.3)
Using orthotic device, n (%)
Participants with amputation, n (%)
10 (47.6) 9 (42.9)
α: Body- mass index is the weight in kilos divided by square of the height in meters. n: Number of subjects.
6.1 FFI
The total score of the foot function index resulted in a mean score of 81.3 (SD 40.5) out of a total possible score of 230 see table 2.
The mean score for the subcategory, pain, was 24.3 (SD 15.2) compared to the highest possible score of 90. When comparing men and women, the pain score indicated a higher level of pain among men, see table 2.
Regarding the three different subgroups of BMI (kg/m2), normal, overweight and obese (WHO, 2004), subjects in the group of overweight BMI (>25<30) reported the lowest level of pain.
10
α: Body- mass index (kg/m2) is the weight in kilos divided by square of the height in meters. 6. 2 TUG
Average time to perform the TUG test was 14.0 (SD 6.7) seconds, there were no notable difference in mean time between the two genders, see table 3. In the three different age groups, a notable difference was seen. The youngest age group, 40-54, recorded a mean value of 9.4 (SD 1.6) seconds meanwhile the oldest age group, 70+, recorded a mean TUG time of 25.7 (SD10.8) seconds.
Subjects with the highest BMI performed the fastest TUG time, 11. 9 seconds compared to the subjects with lowest BMI who had a meantime of 17.1 seconds.
The normal time to complete the TUG is estimated to be 7-10 seconds among healthy subjects (Cordeiro et al., 2009), the data reveals that 71. 4 % of the participants required more than 10 seconds to complete the TUG task.
Table 2. Descriptive statistics of the Foot Function Index Total score (0-230) Mean (SD) 81.3 (±40.5) Pain score (0-90) 24.3 (±15.2) Male 28.2 (±16.1) Female 21.4 (±14.5) BMI (kg/m2)α BMI (≤25) (n=4) 30.0 (±21.0) BMI (>25<30) (n=8) 20.3 (±13.3) BMI (≥30) (n=9) 25.4 (±15.0) Disability score (0-90) 37.5 (±21.8) Activity limitation (0-50) 18.0 (±12.4)
11 Table 3. Descriptive statistics of the Time Up and Go Mean (SD) Time (sec) 14.0 (±6.7) Male 14.8 (±5.5) Female 13.5 (±7.7) Time> 10, n (%) 15 (71.4) Age (n) 40-54 (n=5) 9.4 (±1.6) 55-69 (n=13) 13.1 (±3.3) 70+ (n=3) 25.7 (±10.8) BMI (kg/m2)α BMI (≤25) (n=4) 17.1 (±12.7) BMI (>25>30) (n=8) 14.9 (±5.6) BMI (≥30) (n=9) 11.9 (±3.7)
α: Body- mass index is the weight in kilos divided by square of the height in meters. n: Number of subjects.
6.3 BBS
Bergs Balance Scale scores recorded a mean value of 40.6 (SD 9.2), out of 56, see table 4. Participants aged over 70 reported a lower mean score, 26.3 (SD 10.1) compared to the other age groups. According to the American academy of health and fitness (2014), scores ranging from 21-40 indicate a moderate risk of falling. 42.9 % of the clients in the present study are included in this group. 52.4 % of subjects had a low risk of falls, with scores ranging between 41-56 (American Academy Of Health And Fitness, 2014). Specific tasks from the BBS, see table 4, have been analysed. The specific task involving sitting to standing, task 1, was rated as not difficult by all participants. Task 13, standing with one foot in front of the other, and task14, standing on one leg, were found to be difficult to perform by the majority of participants with 52.4 % and 71.4% of participants reporting great difficulties.
12
Table 4. Descriptive statistics of the Bergs Balance
Scale Score Mean (SD) Total 40.6 (±9.2) Male 37.44 (±10.3) Female 43.0 (±8.0) Age (n) 40-54 (n=5) 45.4 (±5.2) 55-69 (n=13) 42.0 (±7.3) 70+ (n=3) 26.3 (±10.1) BMI(kg/m2)α BMI (≤25) (n=4) 37.0 (±12.0) BMI (>25<30) (n=8) 39.1 (±8.3) BMI (≥30) (n=9)
Specific score range
43.4 (±9.1) n (%)
0-20γ 1 (4.8)
21-40δ 9 (42.9)
41-56ε 11 (52.4)
Specific tasks(T) lowest score (0)
T1, n (%) 0 (0,0)
T13, n (%) 11 (52.4)
T14, n (%) 15 (71.4)
T1: Sitting to standing, score of 0: need of moderate or maximal assist to stand.
T13: Standing with one foot in front of the other, score of 0: loss of balance while stepping or
standing.
T14: Standing on one leg, score of 0: unable to try, need assist to prevent fall. α: Body- mass index is the weight in kilos divided by square of the height in meters. γ: Specific score range indicates a high risk of falling.
δ: Specific score range indicates a moderate risk of falling.
ε: Specific score range indicates low risk of falling(American Academy Of Health And Fitness,
2014).
n: Number of subjects.
6.4 Correlation between independent variables and the TUG
Pearson correlation coefficient revealed an association between different independent variables and the TUG, see table 5. Strong correlations were revealed between the TUG and age, (p <0.01), and a strong negative correlation was detected between the TUG and BBS (p< 0.01). The negative correlation between TUG and BBS, indicates that a higher score on BBS corresponds to a lower time for the clients to complete the TUG assessment.
13 Table 5. Pearson correlation coefficient of independent variables and Time Up and Go
Different variables r p
Age 0.597 0.004**
Sex – 0.095 0.682
BMI (kg/m2)α – 0.283 0.214
Bergs balance scale
Specific tasks (T) – 0.850 0.000**
T1 – 0.677 0.001**
T13 – 0.448 0.042*
T14 – 0.284 0.213
* Level of significant correlation, 0.05 (2-tailed). ** Level of significant correlation, 0.01 level (2-tailed).
T1: Sitting to standing, score of 0: need of moderate or maximal assist to stand.
T13: Standing with one foot in front of the other, score of 0: loss of balance while stepping or
standing.
T14: Standing on one leg, score of 0: unable to try, need assist to prevent fall. α: Body- mass index is the weight in kilos divided by square of the height in meters.
Table 6. Descriptive statistics of subjects with an amputation and subjects without
Subjects n TUG time
(mean) total(mean) BBS
No amputation 12 12,401 44,67
Amputation * 9 16,209 35,11
* One or more phalanges amputated.
n: Number of subjects.
6.5 Comparison of TUG and BBS among amputees and non-amputees
Descriptive statistics have been analyzed between two groups, those who have no toe amputation ant those who have undergone a surgical removal of one or more phalanges, see table 6. Results revealed a longer TUG time and a lower BBS score among the subjects who had undergone a surgical removal of toes.
6.6 Statistical analysis
Kruskal- Wallis test was used to analyze the difference between the BMI groups, normal, overweight and obese, and different tests. Result revealed no significance in any of the tests.
To investigate the differences in score between the client’s self-reported ability (FFI score) and the clients’ physical capacity (BBS, TUG), Spearman’s correlation coefficient
14
was used. Specific BBS tasks were analyzed due to the correspondents of similar FFI questions. For example placing alternative foot on step or stool, task 12 (BBS), compared with difficulty climbing curbs, question 17 (FFI). No statistical correlations were revealed in any of the specific tasks.
8. Discussion
The aim of this study was to collect baseline data to find suitable tests for measuring foot health, function and mobility among subjects suffering from diabetes. Data was collected by applying physical tests consisting of Time up and go, Bergs balance scale, and a self-report questionnaire, The Foot function index.
A further aim was to determine which tests are most appropriate to be applied as routine measures of mobility for clients with diabetes in Samoa. To the authors’ knowledge, no similar study has been conducted in this area before.
The study collected baseline data from 21 individuals. Participants in the study had a low mean age (under 60) compared to previous studies (Ng et al., 2014; Sinclair et al., 2008) that have investigated function and mobility among clients suffering from diabetes (65 and above). Due to the lower mean age in the present study, and the fact that increased age is related with mobility limitations, the great balance disturbance that was revealed from the results was not expected.
Low self-reported foot health was also indicated. Additionally, high BMI values were calculated from the client data and the majority of the participants were overweight bordering on obese (WHO, 2004).
8.1 Comparing the results from BBS and TUG with previous studies
When comparing the outcome in the present study with previous, different results have been revealed. In a study conducted by Vaz et al., (2013), the BBS and TUG was applied to assess the influences of diabetes on balance and functional strength. When comparing the results with the present study, a lower BBS mean score (40 compared to 50.3) and a higher TUG time (14 compared to 8.6) was recorded even though the both studies had similar age range. When comparing the BBS score with a study conducted by Fulk, Robinson, Mondal, Storey and Hollister (2010), who also included subjects in the similar age range as the present study, the BBS score was much lower in the present study, the mean score of 40 compared to 55.7. The reason for the results to differ is unknown but the authors have been discussing the high weight and BMI as possible factor. Balance can be affected by an increased BMI, which has been seen among the clients in the present study (Greve, Alonso, Bordini, & Camanho, 2007). When comparing scores from the Berg balance scale with earlier studies involving subjects with a higher mean age (Cordeiro et al., 2009; Jernigan, Pohl, Mahnken, & Kluding, 2012) results still revealed a lower score in the present study. Given that impaired mobility and balance are mainly associated to increased age (Cordeiro et al., 2009) and age has an impact on mobility (Rejeski et al., 2012), the opposite result was expected.
15 8.2 Evaluation of the self-report questionnaire
Results from the self-report questionnaire have been compared with previous outcomes. Results from the subcategory of FFI, pain, were not consistent with previous studies, which report a higher level of pain among women compared to men (Dawson & List, 2009; Hylton B. Menz et al., 2013). In the present study men reported a 7.6 percent higher level of pain, compared to women.
A mean of 24.4 was reported in the pain subscale of FFI. This was a generally low score compared to the possible score of 90. A study conducted by Novak et al., (2004) also reported a general low score. The low scoring in both studies can be an indication that clients suffering from diabetes in general, experience lower amount of pain in their daily living. Authors have been discussing the possibility of neuropathy as an impact on self-reported foot health. Neuropathy was not an inclusion or exclusion criteria in the present study and was never investigated among the subjects. The low amount of pain reported may be due to the low sensitivity among the subjects involved in the present study.
It is likely that one of the reasons for the scoring of pain and FFI can be attributed to cultural issues. The authors in the present study experienced that the clients tended to report the answer that they expected was most appropriate in the self-report questionnaire (FFI). Studies have reported different cultural coping-strategies regarding how people react to and experience pain (Davidhizar & Giger, 2004; Dawson & List, 2009). Pain is an experience with both individual and cultural meanings. Clients’ response and expressions of pain varies, although they are provided with similar surgical procedures and receive the same type of pain medication (Davidhizar & Giger, 2004). The differences in managing pain in various ethnical groups could contribute to the variation in result between the present- and previous studies. A study by Hylton B. Menz et al., (2013) is conducted in a developed country with different ethnical and cultural approach compared to Samoa. The study revealed the opposite results regarding self-reported pain, indicating that the cultural approach could have an impact on how people react and experiencing pain.
Studies have reported The Foot Function Index as an appropriate tool to evaluate foot health related problems, such as diabetes feet (Novak et al., 2004). Furthermore of its trustworthiness among clients with a higher mean age, 60 and above (Martin et al., 2006). The present study fulfills these criteria’s, where the clients suffer from diabetes and has a general high mean age of 59,4. Due to the instruments lack of considering different side effects to the diabetes, such as neuropathy, and its insufficiency regarding ethnical approach, the authors consider the FFI as an inappropriate tool in Samoa.
8.3 The link between BMI and mobility
When comparing the different BMI groups, time to perform TUG was not consistent with the expected outcome. Higher levels of BMI were expected to correlate with a longer time performing the TUG. Previous studies report that increased age and increased levels of obesity have an impact on mobility-related problems (Rejeski et al., 2012). In the present study, subjects in the obese group, BMI>30, recorded the lowest TUG time, while the subjects in the normal BMI group, BMI<25, recorded highest time
16
performing the test. The difference in results between the current and previous studies could be a result of the small sample in the present study or a high age in the lower BMI groups. A subsequent analysis of the data concerning age in each of the BMI groups did not however reveal any notable age differences between the groups. Limitations in mobility can be related to the person’s foot health. Studies have reported an association between increased body mass index with increased foot pain and disability (Tanamas et al., 2012). Furthermore another study reports a negative correlation between a person’s foot health, for example foot pain, and obesity, where 51% of the subjects classified as obese (BMI, >30), reported their foot health as “poor” or “fair” (The National health Assessment, 2012). When comparing the results with the present study the opposite results are revealed. The lowest level of pain was reported among clients classified as overweight (BMI, >25<30), with a mean score of 20.3, compared to clients with normal BMI, <25, who resulted in a mean score of 25.4. The
reason for a lower pain score in this specific group can, as mentioned earlier, can be
associated with neuropathy where decreased sensation can be a secondary cause to diabetes (Alavi et al., 2014).
Using BMI as a tool to classify different weight groups, normal-, overweight and obesity can be misleading. The classification tool does not clarify the structure and degree of muscles and fat in the body. WHO (2004) discuss the possibility of a modified BMI classification due to the degree of overweight and obesity in different ethnic groups. The difference in fat distribution contributes to an increased health risk. For example a person with a BMI score of 20, can be exposed to an increased health risk due to their ethnic group, even though the person does not represent the risk group of overweigh, BMI<25 (WHO, 2004).
Despite the fact that BMI can be a misleading measurement, it has been considered worthy of note in this specific environment, due to the general high weight among the participants in the study. Calculation of BMI can be used to get a general picture of the situation, regarding the weight status among the population, but the tool should be used with caution and evidence should be taken for consideration before applying and relying on it.
Evidence report of BMI having a great impact on balance and mobility related problems (Rejeski et al., 2012). The authors therefore discussed the possibility of weight being one of the main reason for the outcome regarding poor balance in this specific region because of the general high BMI in the population, where almost 60% of the female population report of BMI value of obese (Keighley et al., 2006).
8.4 Deciding the appropriate measurement instruments
In order to exclude one or multiple tests, the correlation was investigated between the different physical tests in the study. If a correlation could be seen between two or more tools, it simplifies the future work to investigate and evaluate the mobility among the clients that are included in the mobility device services. By excluding one test, it increases the opportunity to find the appropriate and the most time effective tool, in order to evaluate potential effects of interventions concerning foot health and mobility in Samoa.
The present study revealed a strong negative correlation (P<0.01) between TUG and Bergs Balance scale. The association between the two physical tests has been confirmed in previous studies (Cordeiro et al., 2009). The two tests assess balance in different
17
constructs. BBS measures balance ability during activities when sitting and standing, and TUG, timed movement and transfer (Cordeiro et al., 2009). Despite the difference in assessing balance, the high correlation between TUG and Bergs balance scale suggest that only one of the tests may be necessary in the future, when assessing mobility and to predict the risk of falling among clients with diabetes. The TUG test is a sensitive measure for identifying individuals who are at risk of falling (Shumway-Cook, Brauer, & Woollacott, 2000) in contrast to BBS, which has shown low sensitivity. When applying a tool that is not sensitive enough, it decreases the possibility to predict risk groups (Bennie et al., 2003).
The investigators have analyzed certain tasks in the BBS due to the general low score in these specific tasks and TUG. Out of all participants, 71.4 % received the lowest possible score when performing the task 14 in the BBS test, involving more challenging balance. This indicated that balance disturbance must be seen as a risk factor, affecting the independence of clients suffering from diabetes in Samoa. Also, the impact of age can be seen as a link to the level of mobility. Results revealed a longer time to perform the TUG test among elderly clients, similar results have been identified in previous studies (Cordeiro et al., 2009; Ng et al., 2014).
The reported correlation between TUG time and total BBS score, suggests that it may not be necessary to always perform both psychical tests when measuring function and mobility.
When considering the aspects regarding the TUG test, the ability to predict falls, limited use of equipment and the time limitations during a medical appointments, the present study suggest using the TUG test when assessing balance and mobility in Samoa.
Since the study involved both physical tests scored by the authors and self-report questionnaire, this makes it possible to compare capacity, what the clients think they can perform and what they actually can perform. Having access to both, data allows the investigators to determine the “gap” between capacity and performance (WHO, 2002). In the present study the “gap” was analyzed by using Spearman’s correlation coefficient. The coefficient was investigating differences in the person’s self-reported ability, scoring of FFI, compared to similar tasks included in person’s physical performance, scoring of BBS and TUG time. The result revealed no statistical correlation although a difference between the two aspects was observed during the assessments. Environment can be seen as a barrier for client’s performance, when capacity is greater than the physical performance (WHO, 2002).
8.5 Validity and reliability of the study
Before conducting the study, a research for evidence investigating the validity and reliability of the different instruments included in the study was made (Budiman-Mak et al., 2013; Ng et al., 2014). Validity and reliability have been taken into consideration during the assessments. For example, when clients preformed the different BBS tasks, the authors scored the ability separately and in the case that the raters disagreed, the subject was asked to perform the task again. Furthermore, all clients were tested in the same environment by the same raters and identical equipment was used during all assessments.
18 8.6 Limitations of the study
After evaluating the study, the authors have discovered some weaknesses in the structure. The tests were not randomized, which could have affected the results. The assessments started with the TUG test followed by the different BBS tasks. This consistent structure could have contributed to fatigue among the clients, affecting the tasks performed last during the assessments.
The study did not include any control group. According to AAOP, control groups can be applied to strengthen the validity further (American Academy of Orthotists and
Prosthetists, 2008). In the present study, a control group was not applicable since the
aim was to collect baseline data. Although, the data from present study could be applied as a control group in thefuture to evaluate the preventing programs.
Considering specific parts of the present results with previous studies, the differences in outcomes have been discussed. One reason for the diversity in outcome is the possibilities of the secondary problems caused by diabetes, such as sensory loss (Alvie et al., 2014). This was not taken into consideration when including appropriate subjects for the study. Sensory loss could have affected the rating of the different subscales in the FFI. The study mainly focused upon the inclusion criteria’s instead of both inclusion and exclusion criteria’s. This can be seen as a weakness in the recruiting process and the structure of study.
To be eligible for the study, inclusion criteria’s from the beginning was non-amputees. Due to the high prevalence of surgical removal of toes at the diabetic foot clinic where the assessments were performed, inclusion criteria’s had to change to find enough data to analyze. Authors have discussed the impact on the results when including subjects with toe removal since previous studies have revealed that the great toe has an impact on both statistic and dynamic balance (Chou et al., 2009). The effect on balance and functional ability among clients with different toe deformities has also been reported. Older persons with toes deformities are at greater risk of falls and therefore, a toe amputation increases the clients’ mobility limitations and balance (Mickle, Munro, Lord, Menz, & Steele, 2009). These deformities in the foot lead to mechanical instability, which affects the weight bearing, and therefore the stability during the different phases of gait (Mickle, Munro, Lord, Menz, & Steele, 2011). When comparing TUG time and total BBS score among subjects with an amputation and subjects without, results confirmed the discussion about amputation affecting the balance, see table 6. Results revealed that clients with a toe amputation preformed both a longer TUG time, and reported a lower mean score in the total BBS tests, compared to clients with no amputation. Considering these facts, the notable results concerning balance disturbances that were seen among the majority of the clients, seems to have been affected by the adjustments of the inclusion criteria’s in the study.
8.7 Recommendations to Motivation Australia
When determining suitable tools for prevention programs it is important to consider different aspects besides physical activity and limitations. One way to approach this is to consider the major domains presented in the ICF. In the present study, two out of three domains are included, body function and limitation in activity. For a broader view, future tools in prevention programs should involve the third domain, which represents the clients’ participation. Participation implies being involved in a life (WHO, 2002). The future recommendations suggest of using the TUG test in combination with the more challenging tasks in the Bergs balance scale, task 12-14. A
19
more detailed clinical examination of the client’s specific condition concerning the neuropathy, sensory and other diseases should also be included.
Because of the great balance difficulties that were reported in a large proportion of the participants, the authors suggest that a balance-improving-program for high risk clients should be considered in the future. This program could consist of easy exercises that can be applied at home. Ng et al., (2014) discusses the impact on muscle strength secondary to the diabetes. Specific muscle groups that focus upon ankle plantar flexion and dorsiflexion should be included in the program. Appropriate strengthening of these specific muscle groups are crucial due to their effect on walking speed and physical performance. Furthermore the stiffness and motion of the ankle joint should also be addressed in the program. The range of motion in the ankle is important for toe clearance, with the purpose to create enough torque of the plantar flexors during walk (Ng et al., 2014). This program could contribute to improved mobility among clients suffering from diabetes. In addition, good muscle strength in the lower extremities is required among clients who are relatively obese, in order to be able to ambulate (Ng et al., 2014).
9. Conclusions
Results revealed a great balance disturbance among the majority of clients included in the study. When comparing the level of BMI in the different outcomes, results did not correspond to the expected results. Previous studies had earlier revealed the opposite findings regarding the level of pain and TUG time in comparison with the level of BMI. Subjects in the present study who were overweight, reported lowest level of pain and subjects who were obese achieved the lowest TUG time. Additionally the lack of information about secondary causes to diabetes, such as neuropathy, can be a contributing factor to the low scoring. Furthermore, when determining the suitable tools in preventing programs in the future, it is important to consider all three domains included in the ICF, including participation.
Regarding the physical tests, the statistical analysis revealed a good correlation between the two different physical tests. This indicates that it is not necessary to apply both as a routine measure. Additionally, the TUG test is suggested to be applied, to evaluate function and mobility in Samoa. The test requires less time to perform, requires limited equipment and possesses the ability to identify risk groups who have a tendency to fall.
9.1 Acknowledgement
A scholarship provided by Swedish International Development Cooperation, supplied by the Swedish government, funded this project. Authors want to acknowledge the government of Samoa for an approval to conduct this thesis, and all the staff at the MDS who has assisted with the recruiting process, data collection and whenever needed.
9.2 Conflicts of interest
20 10. References
Alavi, A., Sibbald, R. G., Mayer, D., Goodman, L., Botros, M., Armstrong, D. G., . . . Kirsner, R. S. (2014). Diabetic foot ulcers: Part I. Pathophysiology and prevention. Journal Of The American Academy Of Dermatology, 70(1), 1.e. doi:10.1016/j.jaad.2013.06.055
Bennie, S., Bruner, K., Dizon, A., Fritz, H., Goodman, B., & Peterson, S. (2003). Measurements of balance: Comparison of the timed" Up and Go" test and functional reach test with the berg balance scale. Journal of Physical Therapy
Science, 15(2), 93-97.
Bogle Thorbahn, L. D., & Newton, R. A. (1996). Use of the Berg Balance Test to predict falls in elderly persons. Physical Therapy, 76(6), 576-583.
Boulton, A. J. M. (2008). The diabetic foot: grand overview, epidemiology and pathogenesis. Diabetes/Metabolism Research And Reviews, 24 Suppl 1, S3-S6. doi:10.1002/dmrr.833
Budiman-Mak, E., Conrad, K. J., Mazza, J., & Stuck, R. M. (2013). A review of the foot function index and the foot function index - revised. Journal Of Foot And Ankle Research, 6(1), 5-5. doi:10.1186/1757-1146-6-5
Burns, J., Wegener, C., Begg, L., Vicaretti, M., & Fletcher, J. (2009). Randomized trial of custom orthoses and footwear on foot pain and plantar pressure in diabetic peripheral arterial disease. Diabetic Medicine: A Journal Of The British Diabetic Association, 26(9), 893-899. doi:10.1111/j.1464-5491.2009.02799.x Caruso, L. B., Silliman, R. A., Demissie, S., Greenfield, S., & Wagner, E. H. (2000).
What can we do to improve physical function in older persons with type 2 diabetes? The Journals Of Gerontology. Series A, Biological Sciences And Medical Sciences, 55(7), M372-M377.
Chou, S.-W., Cheng, H.-Y. K., Chen, J.-H., Ju, Y.-Y., Lin, Y.-C., & Wong, M.-K. A. (2009). The role of the great toe in balance performance. Journal Of Orthopaedic Research: Official Publication Of The Orthopaedic Research Society, 27(4), 549-554. doi:10.1002/jor.20661
Codogno, J. S., Fernandes, R. A., & Monteiro, H. L. (2012). [Physical activity and healthcare cost of type 2 diabetic patients seen at basic units of healthcare]. Arquivos Brasileiros De Endocrinologia E Metabologia, 56(1), 6-11.
Cordeiro, R. C., Jardim, J. R., Perracini, M. R., & Ramos, L. R. (2009). Factors associated with functional balance and mobility among elderly diabetic outpatients. Arquivos Brasileiros De Endocrinologia E Metabologia, 53(7), 834-843.
Davidhizar, R., & Giger, J. N. (2004). A review of the literature on care of clients in pain who are culturally diverse. International Nursing Review, 51(1), 47-55. Dawson, A., & List, T. (2009). Comparison of pain thresholds and pain tolerance levels
between Middle Easterners and Swedes and between genders. Journal Of Oral Rehabilitation, 36(4), 271-278. doi:10.1111/j.1365-2842.2009.01943.x
de Rekeneire, N., & Volpato, S. (2015). Physical function and disability in older adults with diabetes. Clinics In Geriatric Medicine, 31(1), 51. doi:10.1016/j.cger.2014.08.018
DePue, J. D., Rosen, R. K., Batts-Turner, M., Bereolos, N., House, M., Held, R. F., . . . McGarvey, S. T. (2010). Cultural translation of interventions: diabetes care in American Samoa. American Journal Of Public Health, 100(11), 2085-2093. doi:10.2105/AJPH.2009.170134
Dibello, J. R., Baylin, A., Viali, S., Tuitele, J., Bausserman, L., & McGarvey, S. T. (2009). Adiponectin and type 2 diabetes in Samoan adults. American Journal Of
21
Human Biology: The Official Journal Of The Human Biology Council, 21(3), 389-391. doi:10.1002/ajhb.20858
Fulk, G. D., Robinson, C. J., Mondal, S., Storey, C. M., & Hollister, A. M. (2010). The effects of diabetes and/or peripheral neuropathy in detecting short postural perturbations in mature adults. Journal Of Neuroengineering And Rehabilitation, 7, 44-44. doi:10.1186/1743-0003-7-44
Goldhaber-Fiebert, J. D., Goldhaber-Fiebert, S. N., Tristán, M. L., & Nathan, D. M. (2003). Randomized controlled community-based nutrition and exercise intervention improves glycemia and cardiovascular risk factors in type 2 diabetic patients in rural Costa Rica. Diabetes Care, 26(1), 24-29.
Greve, J., Alonso, A., Bordini, A. C. P. G., & Camanho, G. L. (2007). Correlation between body mass index and postural balance. Clinics (São Paulo, Brazil), 62(6), 717-720.
Guell, C., & Unwin, N. (2015). Barriers to diabetic foot care in a developing country with a high incidence of diabetes related amputations: an exploratory qualitative interview study. BMC Health Services Research, 15, 377-377. doi:10.1186/s12913-015-1043-5
Haji Zaine, N., Burns, J., Vicaretti, M., Fletcher, J. P., Begg, L., & Hitos, K. (2014). Characteristics of diabetic foot ulcers in Western Sydney, Australia. Journal Of Foot And Ankle Research, 7(1), 39-39. doi:10.1186/s13047-014-0039-4
Jernigan, S. D., Pohl, P. S., Mahnken, J. D., & Kluding, P. M. (2012). Diagnostic accuracy of fall risk assessment tools in people with diabetic peripheral neuropathy. Physical Therapy, 92(11), 1461-1470. doi:10.2522/ptj.20120070 Keighley, E. D., McGarvey, S. T., Turituri, P., & Viali, S. (2006). Farming and adiposity
in Samoan adults. American Journal Of Human Biology: The Official Journal Of The Human Biology Council, 18(1), 112-122.
Keysor, J. J., Dunn, J. E., Link, C. L., Badlissi, F., & Felson, D. T. (2005). Are foot disorders associated with functional limitation and disability among community-dwelling older adults? Journal Of Aging And Health, 17(6), 734-752.
Maranesi, E., Ghetti, G., Rabini, R. A., & Fioretti, S. (2014). Functional reach test: movement strategies in diabetic subjects. Gait & Posture, 39(1), 501-505. doi:10.1016/j.gaitpost.2013.08.035
Martin, R. L., Irrgang, J. J., Lalonde, K. A., & Conti, S. (2006). Current concepts review: foot and ankle outcome instruments. Foot & Ankle International, 27(5), 383-390.
Menz, H. B., Dufour, A. B., Casey, V. A., Riskowski, J. L., McLean, R. R., Katz, P., & Hannan, M. T. (2013). Foot pain and mobility limitations in older adults: the Framingham Foot Study. The Journals Of Gerontology. Series A, Biological Sciences And Medical Sciences, 68(10), 1281-1285. doi:10.1093/gerona/glt048 Menz, H. B., & Lord, S. R. (2001). Foot pain impairs balance and functional ability in community-dwelling older people. Journal Of The American Podiatric Medical Association, 91(5), 222-229.
Mickle, K. J., Munro, B. J., Lord, S. R., Menz, H. B., & Steele, J. R. (2009). ISB Clinical Biomechanics Award 2009: toe weakness and deformity increase the risk of falls in older people. Clinical Biomechanics (Bristol, Avon), 24(10), 787-791. doi:10.1016/j.clinbiomech.2009.08.011
Mickle, K. J., Munro, B. J., Lord, S. R., Menz, H. B., & Steele, J. R. (2011). Gait, balance and plantar pressures in older people with toe deformities. Gait & Posture, 34(3), 347-351. doi:10.1016/j.gaitpost.2011.05.023
22
Morie, M., Reid, K. F., Miciek, R., Lajevardi, N., Choong, K., Krasnoff, J. B., . . . Lebrasseur, N. K. (2010). Habitual physical activity levels are associated with performance in measures of physical function and mobility in older men. Journal Of The American Geriatrics Society, 58(9), 1727-1733. doi:10.1111/j.1532-5415.2010.03012.x
Motivation Australia. (2014). Samoa Integrated Mobility Device Service Project. Retrieved 5th of February, 2016 from http://www.motivation.org.au/samoa-integrated-mobility-device-services-project/
National Evidence-Based Guideline on Prevention. (2011). Identifi cation and Management of Foot Complications in Diabetes (Part of the Guidelines on Management of Type 2 Diabetes). Retrieved 5th of February 2016 from https://www.nhmrc.gov.au/_files_nhmrc/publications/attachments/diabetes _foot_full_guideline_23062011.pdf
Ng, T. K.-W., Lo, S.-K., & Cheing, G. L.-Y. (2014). The association between physical characteristics of the ankle joint and the mobility performance in elderly people with type 2 diabetes mellitus. Archives Of Gerontology And Geriatrics, 59(2), 346-352. doi:10.1016/j.archger.2014.07.001
Novak, P., Burger, H., Marincek, C., & Meh, D. (2004). Influence of foot pain on walking ability of diabetic patients. Journal Of Rehabilitation Medicine, 36(6), 249-252.
Pourtier-Piotte, C., Pereira, B., Soubrier, M., Thomas, E., Gerbaud, L., & Coudeyre, E. (2015). French validation of the Foot Function Index (FFI). Annals Of Physical And Rehabilitation Medicine, 58(5), 276-282. doi:10.1016/j.rehab.2015.07.003 Pua, Y.-H., Cowan, S. M., Wrigley, T. V., & Bennell, K. L. (2009). The Lower Extremity Functional Scale could be an alternative to the Western Ontario and McMaster Universities Osteoarthritis Index physical function scale. Journal Of Clinical Epidemiology, 62(10), 1103-1111. doi:10.1016/j.jclinepi.2008.11.011
Raad, J. (2014). Rehab measures: Timed Up and Go. Retrieved 7th of January, 2016 from
http://www.rehabmeasures.org/Lists/RehabMeasures/DispForm.aspx?ID=9 03
Rejeski, W. J., Ip, E. H., Bertoni, A. G., Bray, G. A., Evans, G., Gregg, E. W., & Zhang, Q. (2012). Lifestyle change and mobility in obese adults with type 2 diabetes. The New England Journal Of Medicine, 366(13), 1209-1217. doi:10.1056/NEJMoa1110294
Schoppen, T., Boonstra, A., Groothoff, J. W., de Vries, J., Göeken, L. N., & Eisma, W. H. (1999). The Timed "up and go" test: reliability and validity in persons with unilateral lower limb amputation. Archives Of Physical Medicine And Rehabilitation, 80(7), 825-828.
Shumway-Cook, A., Brauer, S., & Woollacott, M. (2000). Predicting the probability for falls in community-dwelling older adults using the Timed Up & Go Test. Physical Therapy, 80(9), 896-903.
Sinclair, A. J., Conroy, S. P., & Bayer, A. J. (2008). Impact of diabetes on physical function in older people. Diabetes Care, 31(2), 233-235.
Tanamas, S. K., Wluka, A. E., Berry, P., Menz, H. B., Strauss, B. J., Davies-Tuck, M., . . . Cicuttini, F. M. (2012). Relationship between obesity and foot pain and its association with fat mass, fat distribution, and muscle mass. Arthritis Care & Research, 64(2), 262-268. doi:10.1002/acr.20663
Vasunilashorn, S., Coppin, A. K., Patel, K. V., Lauretani, F., Ferrucci, L., Bandinelli, S., & Guralnik, J. M. (2009). Use of the Short Physical Performance Battery Score to predict loss of ability to walk 400 meters: analysis from the InCHIANTI
23
study. The Journals Of Gerontology. Series A, Biological Sciences And Medical Sciences, 64(2), 223-229. doi:10.1093/gerona/gln022
Vaz, M. M., Costa, G. C., Reis, J. G., Junior, W. M., Albuquerque de Paula, F. J., & Abreu, D. C. (2013). Postural control and functional strength in patients with type 2 diabetes mellitus with and without peripheral neuropathy. Archives Of Physical Medicine And Rehabilitation, 94(12), 2465-2470. doi:10.1016/j.apmr.2013.06.007
Ward, R. E., Boudreau, R. M., Caserotti, P., Harris, T. B., Zivkovic, S., Goodpaster, B. H., . . . Strotmeyer, E. S. (2014). Sensory and motor peripheral nerve function and incident mobility disability. Journal Of The American Geriatrics Society, 62(12), 2273-2279. doi:10.1111/jgs.13152
Whitney, S., Wrisley, D., & Furman, J. (2003). Concurrent validity of the Berg Balance Scale and the Dynamic Gait Index in people with vestibular dysfunction. Physiotherapy Research International: The Journal For Researchers And Clinicians In Physical Therapy, 8(4), 178-186.
Win Tin, S. T., Gadabu, E., Iro, G., Tasserei, J., & Colagiuri, R. (2013). Diabetes related amputations in Pacific Islands countries: a root cause analysis of precipitating events. Diabetes Research And Clinical Practice, 100(2), 230-234. doi:10.1016/j.diabres.2013.03.012
World Health Organization. (2004). BMI classification. Retrieved 13th of February, 2016 from http://apps.who.int/bmi/index.jsp?introPage=intro_3.html
World Health Organization. (2016). Diabetes mellitus. Retrieved 28th of January, 2016 from
World Health Organiszation. (2014). Global status report on noncommunicable diseases. Retrieved 4th of January, 2016 from http://www.who.int/mediacentre/factsheets/fs312/en/
World Health Organization. (2016). Informed Consent Form templates. Retrieved 4th
of December, 2015 from
http://apps.who.int/bmi/index.jsp?introPage=intro_3.html
World Healt Organization. (2002). Towards a Common Language for Functioning, Disability and Health ICF. Retrieved 20th of January, 2016 from http://www.who.int/classifications/icf/training/icfbeginnersguide.pdf
Wu, S. C., Driver, V. R., Wrobel, J. S., & Armstrong, D. G. (2007). Foot ulcers in the diabetic patient, prevention and treatment. Vascular Health And Risk Management, 3(1), 65-76.
Zakaria, N. A., Kuwae, Y., Tamura, T., Minato, K., & Kanaya, S. (2015). Quantitative analysis of fall risk using TUG test. Computer Methods In Biomechanics And Biomedical Engineering, 18(4), 426-437. doi:10.1080/10255842.2013.805211