1 Master Thesis
Software Engineering Thesis no: MSE-2010: 37 December 2010
Statistical Debugging of Programs written
in Dynamic Programming Language -
RUBY.
Adeel Akhter
Hassan Azhar
Hassan Azhar
School of Computing
Blekinge Institute of Technology Box 520
SE – 371 79 Karlskrona Sweden
2 This thesis is submitted to the School of Engineering at Blekinge Institute of Technology
in partial fulfillment of the requirements for the degree of Master of Science in Software Engineering. The thesis is equivalent to 20 weeks of full time studies.
Contact Information:
Author(s): Adeel Akhter
Address: Folkparksvagen 14:10 372 40 Ronneby, Sweden.
E-mail: adeel_jilani@hotmail.com Author(s):
Hassan Azhar
Address: Folkparksvagen 14:10, 372 40 Ronneby, Sweden.
E-mail: hassanazhar14@gmail.com University advisor(s):
Professor Håkan Grahn
School of Computer Science and Communications
School of Computing
Blekinge Institute of Technology Box 520 SE - 371 79 Karlskrona Sweden Internet : www.bth.se/tek Phone : +46 455 38 50 00 Fax : + 46 455 38 50 57
3
A
BSTRACT
Context. Software debugging is always an important and critical phase during the development
process. Software debugging is serious and tough practice involved in functional base test driven development. Software vendors encourages their programmers to practice test driven development during the initial development phases to capture the bug traces and the associated code coverage infected from diagnosed bugs. Software applications with fewer threats of bug existence or faulty executions are assumed as highly efficient and stable especially when real time software products are in consideration. Any inconsistency or imperfection in early development phase of software product results in low efficient system and less reliability. Statistical debugging of program source code for visualization of fault is an important and efficient way to select and rank the suspicious lines of code. This research provides guidelines for practicing statistical debugging technique for programs coded in Ruby programming language.
Objectives. In this research work, we identified statistical debugging techniques available for
dynamic programming languages. Firstly, the statistical debugging techniques were thoroughly observed with different predicate base approaches followed in previous work done in the subject area. Secondly, a process of statistical debugging for programs developed in Ruby programming language environment is introduced.
Methods. We implemented six basic and complex candidate programs chosen on the basis of their
complexity, lines of code and code structure in standard Ruby language platform as test subject for study and analysis. Each candidate program was categorized to two categories having correct and buggy line of codes. Predicates base statistical analysis of candidate program source code is done by investigating false positive and false negative ratio during the test execution. Using this false positive and false negative ratio, we can work on instrumented sites to analyze the anomalies in the execution traces of source code.
Results. Results were obtained by using six different programs written in Ruby programming
language. Those programs were divided in three different levels on the basis of their complexity. Results showed that SOBER is more efficient and accurate in bug identification and ranking than Cause Isolation Scheme.
Conclusions. We conclude that, despite of extensive research in the field of statistical debugging and
fault localization it is not possible to identify majority of the bugs. We also concluded that SOBER and Cause Isolation Scheme algorithms are two most mature statistical debugging algorithms. Moreover, we concluded that our studies lacked in industrial validation of process practiced by us to localize the buggy site within the source line of code of subject programs.
Keywords: Statistical Debugging, RUBY, SOBER, Cause Isolation
4
ACKNOWLEDGEMENTS
In the Name of ALLAH the Most Merciful and Beneficent
We would like to thank ALLAH almighty, for His blessings that we have successfully completed this thesis. Without His blessings and grace we would not be able to complete our thesis work. We would like to thanks our parents and we are grateful to them for their support in all phases of life that helped us in successful conclusion of this thesis work.
We are thankful to our supervisor Dr. Håkan Grahn for his guidance, support and positive feedback throughout our research work. Without his guidance and support we think it could not be possible to finish research work in a good node. He helped us a lot to improve quality of the work throughout our research work.
Friends and colleagues in BTH also deserve thanks for their support and encouragement. We would like to thank Shahid in Boras for his support in experimentation and development of RUBY programs. We appreciate efforts of Aftab Nawaz and Syed Muhammad Ali Shah for proof reading and helping us in improving quality of the document.
5
Table of Contents
Abstract ... 3 ACKNOWLEDGEMENTS ... 4 List of Tables ... 8 List of figures ... 9 1. Introduction ... 10 1.1 Background ... 101.2 Aims And Objectives ... 12
1.3 Research Questions ... 12
1.4 Main Contributions ... 12
1.5 Research Methodology ... 13
1.6 Relationship Between The Objectives And Research Methodology ... 14
1.7 Literature Review:... 15
1.7.1 Planning Literature Review: ... 15
1.7.2 Literature Review Conduction: ... 15
1.7.3 Key Words for Literature Searching: ... 16
1.7.4 Utilized Databases: ... 16
1.7.5 Study Selection Criteria and Procedures for Including and Excluding Primary Studies: ... 16
1.7.6 Inclusion criteria: ... 17
1.7.7 Exclusion criteria:... 17
1.7.8 Data Extraction Strategy: ... 17
2. Programming languages ... 19
2.1 Overview of Programming Languages: ... 19
2.2 Classification of Programming Languages ... 21
2.2.1 Static Programming Languages: ... 21
2.2.2 Dynamic Programming Languages (DPL) ... 22
2.3 Difference between Static and Dynamic Programming Languages ... 22
2.3.1 Usability and Feature Aspects of Static Programming language ... 22
2.3.2 Usability and Feature Aspects of Dynamic Programming Language ... 23
3. Software Debugging ... 25
6
3.2 Software debugging, testing and verification ... 26
3.3 Debugging process ... 27
3.4 Dynamic Slicing ... 27
3.5 Fault Localization... 28
3.6 Statistical Debugging ... 32
4. Techniques of Statistical debugging ... 34
4.1 Context Aware Statistical Debugging ... 34
4.2 SOBER ... 38
4.2.1 A motivating example of SOBER for RUBY program ... 39
4.2.2 Predicate ranking ... 41
4.2.3 Probabilistic analysis of predicates execution ... 42
4.3 Cause Isolation Scheme ... 43
4.4 BAYESDEBUG ... 45
4.5 Why Cause Isolation Scheme and SOBER ... 48
5. Implementation and analysis of SOBER and Cause Isolation Scheme debugging algorithms in Ruby Language ... 49
5.1 Implementation guidelines ... 49
5.2 Process design ... 49
5.3 Statistical debugging algorithms applied to RUBY Programs ... 51
5.3.1 The Ruby FOR Loop ... 51
6. Experiment Execution ... 56
6.1 Subject selection ... 56
6.2 Instrumentation process ... 56
6.3 Operation ... 57
6.4 Experiment Sample ... 58
6.4.1 Test Candidate programs ... 59
7. Experimental Results... 62
7.1 Single-Bug version ... 63
7.2 Multiple –Bugs version ... 69
7.3 Comparative validation of SOBER and Cause Isolation Scheme algorithms... 71
7.4 Evaluate_Polynomial ... 71
7.5 JRuby_Calculator ... 72
7 8. Validity threats ... 75 9. Epilogue ... 77 9.1 Conclusions ... 77 9.2 Future Work ... 78 10. References: ... 79
8
L
IST OF
T
ABLES
Table 1: Classification of programming languages ... 20
Table 2: Differences between static and dynamic programming languages ... 24
Table 3: RUBY program evaluation of TARANTULA fault localization technique ... 30
Table 4: Results for the Siemens test suit [62]. ... 37
Table 5: LIBSVM-based experiments on rythmbox ... 38
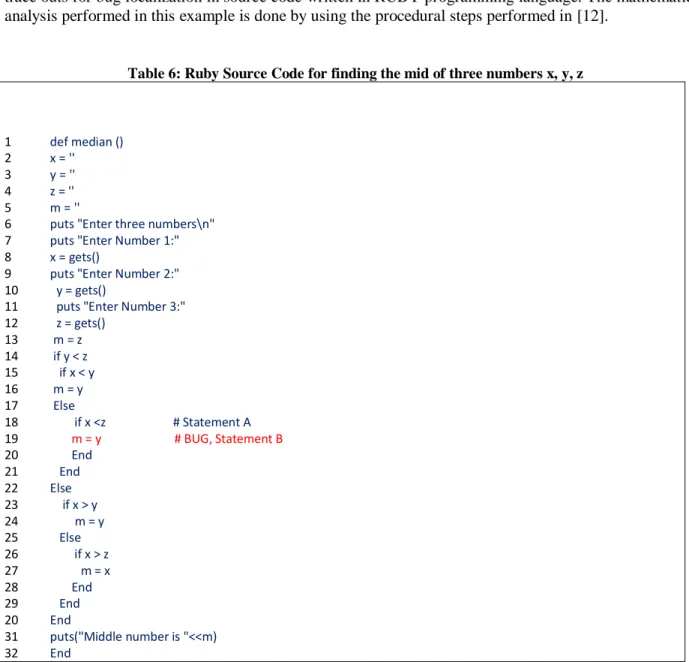
Table 6: Ruby Source Code for finding the mid of three numbers x, y, z ... 39
Table 7: Branching action of programs and ... 40
Table 8: Correct & incorrect execution in programs and ... 41
Table 9: Tsuit execution in success and failing scenarios ... 42
Table 10: Differences between SOBER and BAYESDEBUG [65] ... 47
Table 11: Top two predicates of fault 1 [65]... 47
Table 12: Comparison of SOBER, LIBLIT05 and BAYESDEBUG [65] ... 47
Table 13: Success / Failure results of predicates FOR loop... 53
Table 14: Operations setup for experiment scenarios ... 57
Table 15: Test candidate for experiment; Methods, Source line of code (SLOC), Cyclometic complexity (CC) ... 59
Table 16: Test candidate level categorization w.r.t to cyclometic complexity ... 62
Table 17: Programs CI, FP,FN analysis for candidate programs ... 62
Table 18: Bug identifications for test cases of candidate programs ... 64
Table 19: Located bugs w.r.t. examined code for Test cases { TC1, TC2, TC3, TC4, TC5} ... 65
Table 20: Located bugs w.r.t. examined code for Test cases { TC1, TC2, TC3, TC4, TC5} ... 66
Table 21: Located bugs w.r.t. examined code for Test cases { TC1, TC2, TC3, TC4, TC5} ... 67
Table 22: Located bugs w.r.t. examined code for Test cases {TC1, TC2, TC3, TC4, TC5} ... 68
Table 23: Multi bug implementation setup for Evaluate_Polynomial program ... 69
Table 24: Multi bug analysis in context of SOBER debugging algorithm ... 70
Table 25: Multi bug result analysis for Evaluate_Polynomial program ... 72
9
L
IST OF FIGURES
Figure 1: Research flow ... 13
Figure 2: Research methodology and objectives association ... 15
Figure 3: Flow of static dynamic programming languages ... 21
Figure 4: Flow of dynamic programming language ... 22
Figure 5: Software debugging, testing and verification process in software development process ... 26
Figure 6: Statistical Debugging Flow ... 32
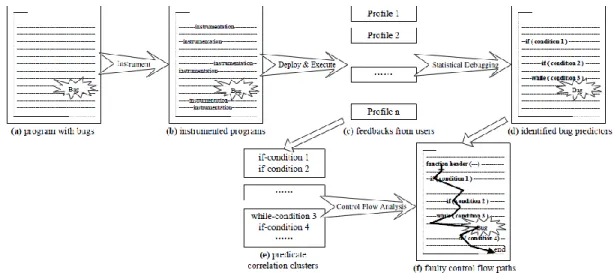
Figure 7: The framework of a general bug localization approach ... 34
Figure 8: Organization of context aware debugging ... 35
Figure 9: Proposed process of statistical debugging for programs in RUBY language ... 50
Figure 10: RUBY For loop syntax ... 52
Figure 11: RUBY FOR loop compilation and test sample ... 52
Figure 12: Success / Failure results of predicates FOR loop ... 53
Figure 13: RUBY WHILE loop syntax ... 54
Figure 14: RUBY WHILE loop compilation and test sample ... 55
Figure 15: Predicates results observation template ... 57
Figure 16: Control structure (FOR - While) loop debugging... 61
Figure 17: Identified bugs vs. Subject programs ... 63
Figure 18: Bug localization of candidate programs across test case executions ... 64
Figure 19: Graphical view of located bug‟s w.r.t. examined code for Test cases {TC1, TC2, TC3, TC4, TC5} ... 66
Figure 20: Triangle - Graphical view of located bugs w.r.t. examined code for Test cases { TC1, TC2, TC3, TC4, TC5} ... 67
Figure 21: Create_file - Graphical view of located bugs w.r.t. examined code for Test cases {TC1, TC2, TC3,TC4, TC5} ... 68
Figure 22:Generate_Product_Table - Located bugs w.r.t. examined code for Test cases {TC1, TC2, TC3, TC4, and TC5} ... 69
Figure 23: Predicates execution analysis for methods embedded in Evaluate_Polynomial ... 71
Figure 24: Cause Isolation Scheme - SOBER Multi bug analysis for Evaluate_Polynomial program methods ... 72
Figure 25: Cause Isolation Scheme - SOBER Multi bug analysis for JRuby_Calculator program methods ... 73
10
1. Introduction
1.1
Background
Dynamic programming languages are considered as a development environment having strong expressive power and have no type declarations [1]. Dynamic programming languages are less typed in nature that is why the declaration of variables before their actual usage has been reduced [1] [2]. In comparison with the dynamic typing, static typing proceeds to define variables and its type during the declaration process which will be checked during the compilation time [3]. However in dynamic programming languages the type check of variables and objects is done during runtime. Moreover in dynamic programming languages the class structure and hierarchy can be adjusted during the runtime [4].
Software source code debugging is an important and continuous activity. It is performed by developers during development process of a software application written in dynamic programming languages environment. In accordance to traditional approaches, debugging in dynamic programming languages is usually performed in two steps [5].
1. Analyzing the execution trace of a software application to figure out the cause of a bug or failure. 2. Visualizing the unexpected response of a application during testing.
Two types of debugging approaches are followed in order to improve the quality of software [6].
1. Static Analysis Based Approach:
Static analysis is performed by analyzing the program source code and by static identification of faults. Bugs identified in the static analysis approach tend to contain a high rate of false positives [6].
2. Dynamic Analysis Based Approach:
Following the dynamic based approach for bug detection, bug tracking is performed at runtime during the execution of a program. Dynamic analysis keeps track of the runtime behavior and hence figures out the actual bug pattern/behavior by comparing the runtime behavior of correct and incorrect executions respectively [6]. The run time behavior of fault occurrences can be visualized by observing the false positive and false negative ratio. During the execution of a program, whenever a bug or fault is encountered, stack information including root cause of the bug and its description is collected and reported to a server automatically for analysis and follow up.
In dynamic analysis based approach, compilation level checking is implemented based on a language specification and hence can detect common programming bugs [6]. However there are other bugs which are more related to verification of correctness of coding methods and functions for execution of desired requirements being implemented [7]. Bug localization is the initial step towards automated debugging [5]. In dynamic analysis technique most of the source code that need further debugging is separated from rest of the code. Selection and integration of an effective bug localization technique in the source code identifies the bug locations with an accurate trace out information, hence it presents the appropriate summary related to a bug. This information can be fruitful in understanding the cause of bugs in a particular source code of these software applications.
11 By using statistical debugging approach for localizing bug within the sampled source code, identified bugs and affected code coverage can be visualized in more accurate way. The statistical method of software debugging can handle the unsure and inconsistent bug existence by presenting the most accurate traces of software failures [8].
Many previous fault localization techniques based on the dynamic debugging statistical debugging revealed that an actual fault indicator is different from the specified or pointed trace location [9][10][11][12]. Initially invariant based technique was studied to understand the invariant properties related to a program‟s execution state that can be fruitful to relate the invariant properties of a program faults to variations respectively [13]. An algorithm “DELTA DEBUGGING” was proposed by Zeller and Hilderbrandt, which detach related variables of associated functions and narrowing the states of multiple predicate implementation based on their pass and fail execution [13]. The algorithm presented by Zeller and Hilderbrandt was based on localization of the fault by presentation of a program states using memory graphs [13]. Agrawal et al. offered a bug localization technique implemented as Xslice [14][15]. According to Xslice, bug localization can be analyzed by subtracting the distinct correct execution state from a distinct failed execution states respectively [15] [16]. Pan and Spafford in their studies proposed a chain based family of heuristics to bug affected areas of the source code of a software program by using a dynamic slicing technique [16][17].
Later on the Tarantula technique was presented by Jones et al. [18]. Based on which all the pass and fail trace information related to the testing of a program for bug localization was collected and distinct statements for both pass and fail scenarios were highlighted [16]. Afterwards Gupta et al. presented an algorithm “SLICECHOP” by combining the DELTA DEBUGGING [13] and the Dynamic Slicing [17] technique previously proposed by Zeller and Pan respectively [19]. The basic theme of the SLICECHOP is to discover a simplified failure inducting input from the provided failing case by implementing Zeller and Hildebrandt's algorithm [20]. Based on these failure inducting inputs backward and forward dynamic slice are calculated from the incorrect output [16]. The insertion or intersecting point of a backward dynamic slice and forward dynamic slice i.e. the chop, is assumed as the bug localization trace summary [16].
Liblit presented the process the principal of predicate-based dynamic analysis [6] by keeping focus on set of dynamic execution statistics of program source code. Liblit focuses on a set of dynamic execution statistics and analysis performed on those statistics [21]. It monitors the program‟s state, code-flow, control flow and data flow at runtime and identifies major reasons of a program failure [21]. Liblit proposed a method to solve complete list of predicates with their respective scores [22]. SOBER is a predicate based dynamic analysis technique [6]. SOBER can detect statistically more faults and bugs in a code than any other state-of-the-art technique like Liblit [16]. SOBER evaluates each predicate in each execution and provides more detailed information [16]. During each incorrect execution, SOBER ranks each predicate according to the behavior of predicate i.e. how program will execute if a bug occurs during the flow of program [16][6]. SOBER technique is based on estimation of a predicate likelihood either it is true or false [22].
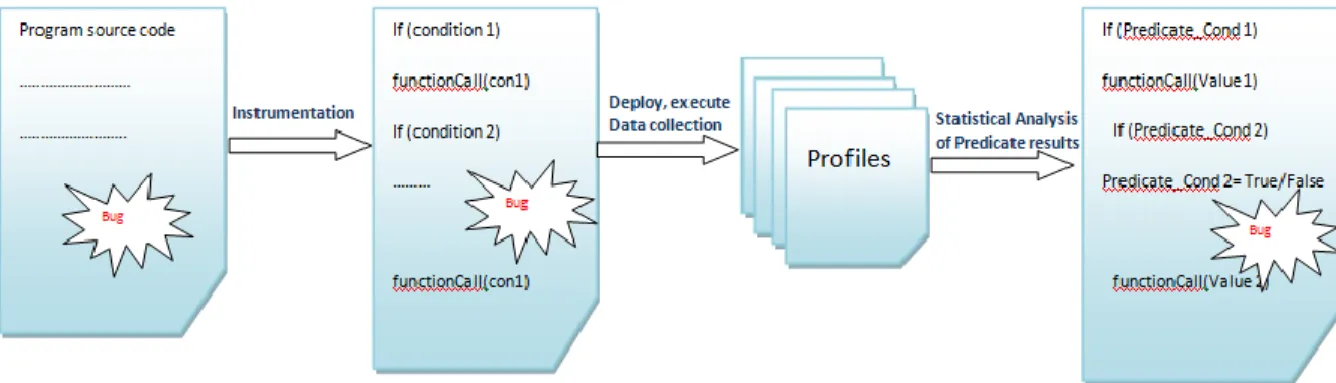
Statistical debugging techniques focus on runtime errors that have been left out by previous studies. The statistical approach to software debugging is based on a fine-grained instrumentation of software and a distributed data collection infrastructure. The Statistical debugging technique sketch out the program‟s
12 source code to gather data flow, program flows, program state trace information. Then statistical analysis on collected information was performed to figure out the bugs [11]. This instrumentation technique for the bug localization by using statistical debugging includes the insertion of some predicate based code before the decisive logical structures - loop statements, function calls and return values of a program [22]. Based on the pass and fail, True / False – test case values of predicates, program execution is traced out and related bug information is collected to figure out and modify the bug‟s actual location [11]. However there are few issues associated with the bug detection predicates. One of those problems is that the predicate implementation might affect the execution and termination state of a program [22]. Another problem with the bug detection predicates application is for complex software systems where huge numbers of predicates are implemented, of which many are rationally repeated [11]. In order to work out on these above mentioned problems, specific algorithms or statistical instrumentation techniques are required.
1.2
Aims And Objectives
The overall aim of study is to investigate the existing techniques and tools related to statistical debugging and its application to modern dynamic programming languages (Ruby in our research). To achieve this aim following objectives are set as goals to be achieved.
Identify and evaluate the existing statistical debugging techniques and algorithms for dynamic programming languages.
To implement the most mature statistical debugging algorithm and adapt them to the Ruby language.
Evaluation and analysis of SOBER and Cause Isolation Scheme algorithms in RUBY language programs.
Comparative validation of SOBER and Cause Isolation Scheme debugging algorithm on programs developed in RUBY language.
1.3
Research Questions
The following research question will be answered:
RQ1 What are the existing statistical debugging techniques adaptable for Dynamic programming languages?
RQ2 How many existing techniques for statistical debugging are adapted to work in the context of various dynamic programming languages?
RQ3 How to adapt statistical debugging algorithm SOBER and Cause Isolation Scheme in RUBY?
RQ4 How will SOBER and Cause Isolation Scheme perform when these will be applied on sample programs developed in RUBY?
1.4
Main Contributions
The main contributions of the study include:
A review of statistical debugging algorithms designed for fault and bug localization in dynamic programming languages.
Comparative analysis of existing statistical debugging approaches for effective fault localization.
Analysis of results by implementing debugging algorithm SOBER in RUBY language sample and seeded fault programs.
13
1.5
Research Methodology
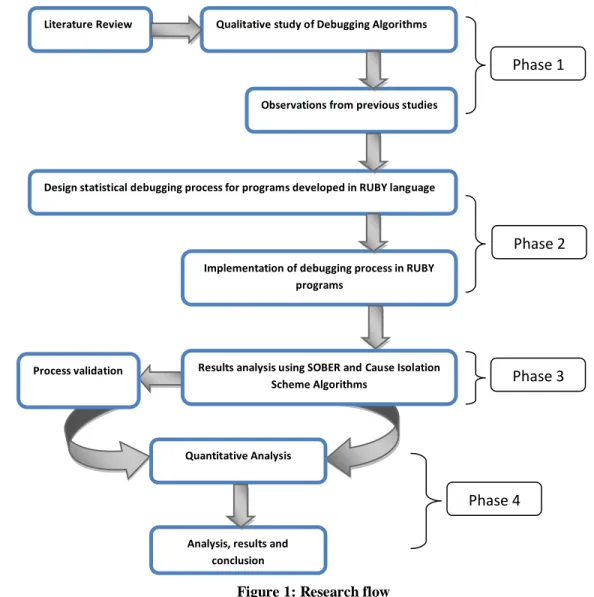
The mixed research method was adopted to perform this research work. The study was planned and conducted to four phases to answer the research questions and achieve the objectives of study.
Phase 1:
In the first phase detailed literature review was conduct to learn in-depth study of available statistical debugging techniques and related work done in the area of fault localizations. It guides us to identify the most useful and suitable techniques required for statistical debugging process for programs developed in dynamic programming languages. Phase one also helped us to learn the steps, procedures required for statistical debugging process and the related attributes of study to implement the existing algorithms.
Figure 1: Research flow
Literature Review Qualitative study of Debugging Algorithms
Observations from previous studies
Design statistical debugging process for programs developed in RUBY language
Implementation of debugging process in RUBY programs
Quantitative Analysis
Results analysis using SOBER and Cause Isolation Scheme Algorithms
Process validation
Analysis, results and conclusion
Phase 1
Phase 2
Phase 3
14
Phase 2:
In the phase two, we have proposed a process of statistical debugging process for programs developed in RUBY language. The attributes studied from phase one were used as objects of implementation and analysis in order to validate the algorithms and results. The predicting and fault localization behavior of proposed process was analyzed, verified and then tested by implementing bug injected programs in RUBY language. Implementation of Ruby program was done in Netbean IDE by using standard RUBY framework. Three simple and complex programs were implemented with and without having bugs, so that the execution results can be analyzed by using statistical debugging algorithms. The results gathered from executions were recorded and analyzed at the end of phase two.
Phase 3:
In this phase, data collected from the implemented programs and execution logs including program termination states i.e. success or failure were analyzed by using statistical analysis process defined in SOBER and Cause Isolation Scheme debugging algorithms. As a result of this phase, analysis of bug injected programs was practiced by using most recent debugging algorithms. The analysis of this phase was incorporated with the procedural steps of SOBER and Cause Isolation Scheme algorithms to validate and test the proposed process of statistical debugging for RUBY programs.
Phase 4:
In the phase four, we have provided the analysis and results of proposed process of statistical debugging for RUBY programs. The results were validated with the SOBER and Cause Isolation Scheme algorithms guidelines and analysis of bug injected programs coded in RUBY language is presented.
1.6
Relationship Between The Objectives And Research Methodology
The main objective of presented research work was to design and propose a process for statistical debugging for programs developed in RUBY programming language. Since much of the work has been done in debugging of programs coded in other programming languages including C and Java, so a comprehensive literature review was performed to learn the steps and procedure require for statistical analysis of bugs within source code. Moreover the adaptability of debugging algorithm was also an essential objective of the study and that was fulfilled by implementing the existing analytical techniques of fault localizations in bug injected programs coded in RUBY language. The relationship between research methodology and objectives is shown in figure below.
15
1.7
Literature Review:
Literature review is one of the most important activities performed to investigate about the research topic and related areas. Literature review guides to narrow down the topic area and hence recommends efficient ways to explore the topic area. It is suggested to perform literature review in all type of research approaches; however it plays vital role while doing exploratory research [1]. During our research work on topic of statistical debugging, we have conducted literature review to answer research questions RQ1 and RQ2. The results gathered from questions RQ1 and RQ2 were used to work on RQ3 and RQ4 respectively. The main reason of conducting literature review was visualization and learning of available statistical debugging techniques and the procedural steps to perform these on source line of codes. The review and synthesis of filtered articles during literature review activity was used to further analyze the related work done and available procedural guidelines in the area of Statistical debugging.
1.7.1 Planning Literature Review:
The reason of conducting literature review is to collect and describe the available studies related to Statistical debugging algorithms and their implementation for programs developed in different programming languages [78]. To conduct the literature review, it was planned to gather the research related topic areas during the period of 1998 to 2009. The motive of conducting literature review was to get an overview of fault localization techniques and ranking models available for statistical debugging algorithms.
1.7.2 Literature Review Conduction:
In order to conduct literature review for browsing the related studies about research topic, research questions were disintegrated into keywords so that related domain areas can be identified. The search keywords selected from research questions are as under:
RQ1 Debugging, Statistical debugging algorithms, Dynamic Programming languages
Figure 2: Research methodology and objectives association
Results analysis using SOBER and Cause Isolation Scheme Algorithms Implementation, Analysis & validation
of proposed process Proposed process of statistical debugging for programs in RUBY
Literature review Observations & conclusion Objective 2 Objective 3 Objective 4 Objective 1
16 RQ2 Fault Localization, Predicates profiling, Source code Sampling
RQ3 RUBY, SOBER, Cause Isolation Scheme, Bug isolation, Statistical Debugging Simultaneous Identification of Multiple Bugs.
RQ4 Cooperative Bug Isolation, SOBER, Cause Isolation Scheme
Boolean operator OR was used with listing of synonyms and key words. Boolean AND was used to form different combinations of complex terms for relevant searching.
1.7.3 Key Words for Literature Searching:
The keywords used for searching literature relevant to research topic area are as under:
(Statistical Debugging OR Fault Localization OR Debugging Techniques) AND (Software)
AND (Source Code)
(Statistical Debugging OR Fault Localization) AND (Dynamic Programming Languages) AND (Source Code)
(Fault Localization AND Predicates Profiling ) AND (Source Code)
(Statistical Debugging) AND (SOBER) AND (Sample programs)
(Statistical Debugging OR Fault Localization) AND (Cause Isolation Scheme)
(Statistical Debugging OR Fault Localization) AND (Bug predictors) AND (Fault localities)
(SOBER AND Statistical Debugging) AND (Dynamic Programming)
1.7.4 Utilized Databases:
The currently available software engineering search engines are not sufficient to perform literature reviews [79]. In order to overcome this issue, seven major electronic research archive resources are identified to search the literature related to software engineering [79]. During the literature review study for our topic area, we have browsed different electronic databases listed below:
IEEE explore
ACM Digital library
Citeseer library (citeseer.ist.psu.edu)
Inspec (www.iee.org/Publish/INSPEC/)
Google scholar (scholar.google.com)
Science Direct (www.sciencedirect.com)
Springer Link
1.7.5 Study Selection Criteria and Procedures for Including and Excluding Primary Studies:
After performing literature review, we find relevant studies related to our research topic “Statistical Debugging for Program developed in Dynamic Programming Languages-Ruby”. The instrumented key words were used to filter out the relevant literature in selected electronic resources. The selection process was formulated to identify the studies which are more supporting in context of research questions. The main concern of conducting literature review was to figure out material, facts and figures that discuss the statistical debugging algorithms and procedural steps followed.
17
1.7.6 Inclusion criteria:
The research papers which fulfill the research queries and lie during the period of 1998 to 2009 were included for further consideration. The inclusion process of research papers was performed on the basis of following criterion:
1. Research papers/articles which are available and accessible in full text in different databases. 2. Research papers/articles that encapsulate the studies related to experimentation, comparative
analysis in topic area.
3. Research papers/articles which are peer reviewed by reviewers.
4. Research papers/articles that provide relevant knowledge about the procedural steps for statistical debugging techniques.
1.7.7 Exclusion criteria:
The research papers which do not met the listings mentioned in inclusion criteria were discarded for the literature study of research topic.
1.7.8 Data Extraction Strategy:
Data extraction forms were used to elicitate the information from primary filtered research papers. The data forms with collected information were discussed between authors to validate the correctness and relevance with the research topic. The collected data was further categorized in to two sections mentioned below:
General Section
The general data of the related research articles was scripted by considering the following attributes: 1. Article title
2. Conference/ Journal Name
3. Conference/ Journal published date
4. Search string / phrase used for research paper extraction 5. Data source repository browsed for research paper extraction
Specific Information Section
The specific data of related research articles was scripted and reviewed by visualizing the following attributes in context of research topic area:
1. Academic.
2. Experimental study. 3. Case study.
4. Sampled source code.
5. Advantages and limitations of Statistical debugging algorithms.
6. Comparative study of traditional debugging approaches and statistical debugging algorithms. After completion of literature review activity both authors verified and validated the research article findings to minimize the duplication. Both authors shared the research article and papers findings by using Google document share. The main concern of literature review activity was to elicitate and selects
18 the relevant studies in accordance to formulated search strings and visualizing the extracted factors for general and specific sections specified.
19
2. Programming languages
2.1
Overview of Programming Languages:
Programming languages are core of every computer software system. No computer can run without the involvement of program written in it. To perform debugging of source code of some software system it is important to understand the basic properties of programming languages. On the basis of properties of different programming types, debugging can be performed and which makes analysis and development of a scenario easy. This section will explain some features of the static and dynamic programming languages and differences between them.
According to Mark Utting there are multiple types of programming languages [23] :
Object oriented programming language
Functional languages
Logic programming languages
Transformation Languages
Text formatting languages
XML-related languages
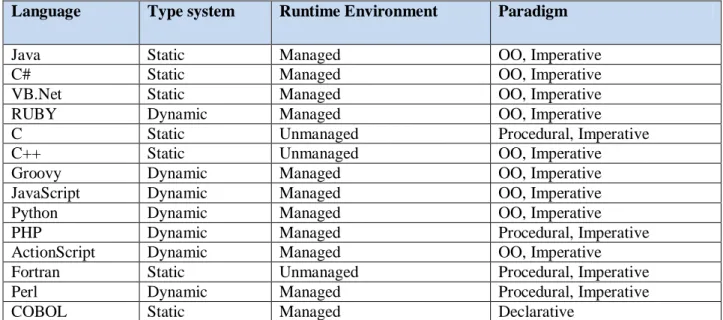
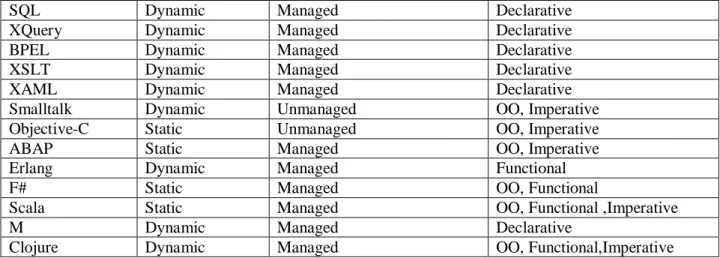
Programming languages are categorized on the basis of their syntax and semantics [24]. There is difference between typed and un-typed programming languages, because some languages support variable types, method types, and object types while others don‟t require any type during the compilation and normal execution of programs [23]. These un-type languages define types at runtime. Similarly, some languages don‟t allow casting of one type of variable to another while some support this feature [25]. In table 1 there is a list of languages types that shows classification of different programming languages on the basis of their type, problem space and paradigm [26].
The categorization of programming languages can be performed on the basis of following attributes:
Type System:
Type checking is performed on the programs by type system checks to restrict the occurrence of compile time or execution errors [27]. In static type system base programming languages, the procedure of type checking is performed at compile time of source code. On the other hand in dynamic type system base programming languages, the procedure of discovering type errors is performed during run time [27].
Programming Paradigm
Procedural type programming languages refers to concept where program states are executed based on some procedures and modularity [29].
a) Imperative paradigm
Imperative programming languages refer to the concept where a variable may be initialized to a value and later reallocated to another value. In the imperative programming paradigm, programs in executions produce a series of states. The imperative programs can be recognized on the basis of execution behaviors.
20
b) Object Oriented (OO) Paradigm
Object oriented programming paradigm which allows application developers to write code that defines both data type of data structures and operations performed on them. Programming in OO paradigm allows developers to create components that doesn‟t get affected when new object with same type is created, hence permitting to construct new object inheriting the features of existing objects [28].
c) Functional Paradigm
Functional type programming types are based on computational actions performed by evaluating expressions. These languages provide functional way of expressing functional activities. Some languages in this paradigm can‟t produce fast execution of a program than imperative paradigm.
d) Procedural Paradigm
Procedural type programming languages refers to concept where program states are executed based on some procedures and modularity [29].
e) Declarative Paradigm
Declarative type programming languages are logical programming languages like prolog. These languages try to retrieve what has to be computed. Structure of the declarative type based on expressions. These types of languages show functional relationship between input and output.
Runtime Environment
i. Managed Environment
Managed runtime environment is also known as dynamic runtime environment. According to Intel software network, it provides faster time to market, safer code, lower development cost, cross-platform and reachable code.
ii. Unmanaged Environment
In unmanaged environment code is directly executed by operating system. Code written in unmanaged environment, directly targets processor and is architecture dependent.
Table 1: Classification of programming languages
Language Type system Runtime Environment Paradigm
Java Static Managed OO, Imperative
C# Static Managed OO, Imperative
VB.Net Static Managed OO, Imperative
RUBY Dynamic Managed OO, Imperative
C Static Unmanaged Procedural, Imperative
C++ Static Unmanaged OO, Imperative
Groovy Dynamic Managed OO, Imperative
JavaScript Dynamic Managed OO, Imperative
Python Dynamic Managed OO, Imperative
PHP Dynamic Managed Procedural, Imperative
ActionScript Dynamic Managed OO, Imperative
Fortran Static Unmanaged Procedural, Imperative
Perl Dynamic Managed Procedural, Imperative
21
SQL Dynamic Managed Declarative
XQuery Dynamic Managed Declarative
BPEL Dynamic Managed Declarative
XSLT Dynamic Managed Declarative
XAML Dynamic Managed Declarative
Smalltalk Dynamic Unmanaged OO, Imperative
Objective-C Static Unmanaged OO, Imperative
ABAP Static Managed OO, Imperative
Erlang Dynamic Managed Functional
F# Static Managed OO, Functional
Scala Static Managed OO, Functional ,Imperative
M Dynamic Managed Declarative
Clojure Dynamic Managed OO, Functional,Imperative
2.2
Classification of Programming Languages
2.2.1 Static Programming Languages:
Static term is used to refer languages, bound to compile before runtime like C, Pascal, JAVA, C# and C++ [30]. Static languages are considered as compiler based programming languages that are more efficient than interpreter based languages because of their capability to take earlier decision [30]. Static programming languages check type at compile time; type is assigned at declaration time and it is checked type at the time of compilation [31]. Flow of SPL can be described as [32][8]:
Figure 3: Flow of static dynamic programming languages
Wrongly typed or incompatible variable name results in error at compile time [31][33]. Example code of static program written in C is as follows:
/* C code */
int num, sum; // explicit declaration num = 5; // now use the variables sum = 10;
22
2.2.2 Dynamic Programming Languages (DPL)
In term of programming languages, the word „dynamic‟ is used for taking care of bugs or errors at runtime like Python, Ruby, PHP and JavaScript [31]. In dynamic programming languages type checking is done at run time i.e. at the time of declaration there is no need of variable declaration type [31]. Dynamic typing is shown in figure 5 below [32]:
Figure 4: Flow of dynamic programming language
DPL are also known as weakly typed languages or type-less programming languages [31]. DPL takes string as an input, then perform analysis and provide end results. These languages can change the types and variables at run time [31]. DPL support new type addition, changes in functions already written and allow alteration in classes at runtime [34].
DPL are very small and flexible to use. DPL helps to develop a well maintainable, evolutionary and feasible program that can easily adapt changes in later stages, also it provides support in rapid development, simple design and easily tested system [35][1]. This helps developer to write more code and develop a product robustly. DPL helps developers not to put checks for type, as these will automatically be handled by DPL at runtime and thus result in more productivity [33]. It provides support to programmers like memory management; it provides memory dynamically [31]. This can be done by allocating types to methods, variables and objects at runtime which helps in utilizing memory at runtime. For a large system DPL is very attractive, because it provides multiple alternatives for object, method and variable type [36]. It provides flexibility to the system, which helps in opting for multiple alternatives at runtime. One major feature that DPL provide is, code optimization [31].
2.3
Difference between Static and Dynamic Programming Languages
2.3.1 Usability and Feature Aspects of Static Programming language
Main thing in static programming languages is typing, that restricts a programmer to use system types. It is really hard to modify a static type programming language; they are less flexible as compared to DPL [31][37]. Static programming languages require proper management for error control. There should be proper memory allocation at compile time otherwise memory overflow error can be generated. Static programming languages are considered as the most powerful languages, which help to develop a time
23 efficient systems. Some static programming languages has GUI support available but mostly they don‟t have GUI support. Static programming languages are used for complex data structures and extensive algorithms. Static programming languages help is available extensively on internet but not everything, also that help is too general not specific [31].
Encapsulation is a very important feature in static programming languages that helps to hide data in a program for unauthorized access from one module to another. Static programming languages support encapsulation from the beginning [38]. Multiple inheritances is available in all static programming languages [31], which is a very important and one of the major advantage of static programming language over dynamic programming language.
2.3.2 Usability and Feature Aspects of Dynamic Programming Language
When system is more critical and reliability is the major concern, then type-less languages balance this by taking this headache on their own. Programmers don‟t need to consider types, hence results in more productivity than static typed programming languages [31][39][40].
DPL has very powerful working environment, which helps to maintain safe error control mechanism [31], like there is no memory overflow sort of things in most of the DPL as these are in static programming languages. DPL allocate memory at runtime according to the requirements of the variable [37]. Researches proved that DPL are efficient enough to help developers to develop equivalent time efficient code [39][41]. DPL has built in feature of structural conformance, which helps to reduce coupling between interfaces [31]. DPL also provide good help for GUI design, also they provide good support to modify and add behavior to control [39]. DPL also provide rapid application development by providing support through quick code [39]. This makes DPL first choice for developers to use it for rapid application development. DPL are used for applications where complexity lies in connection between those applications [31][39]. These DPL are mostly open source programming languages and there is extensive online support is available from installation till deployment [31] [39].
Encapsulation is a very important concept in programming. It helps to hide data internally and keep it restrict different access rights on different modules [31]. Data can be hiding by using public, protected and private concepts. DPL supports it either very less or not at all [38]. This is still a drawback in DPL, even many languages provided support for encapsulation but then they removed it [38]. DPL has capability to perform auto inspection i.e. they can inspect their codes by using their own compilers known as introspection [31] [42]. Almost all dynamic programming languages provide this support.
Dynamic programming languages don‟t provide support for subtype inheritance but support for multiple implementation inheritance is available [43] [44]. Some DPL use special classes known as Mixin, for adding additional properties to other classes [31]. These classes don‟t have any instance as well as they don‟t have super classes. They don‟t have any specific place to be put in hierarchy [31]. It also makes code complex [43][31].
DPL are mostly open source programming languages hence there is extensive availability of help and documentation available online. Help and documentation of static programming languages is also available but DPL has from beginning and available extensively [31].
24
Table 2: Differences between static and dynamic programming languages Feature Aspect
Language Type
Static Languages Dynamic Languages
Type Declaration Required Not Required
Productivity Less Productive More Productive
Portability Some are very much portable some
are not
Mostly Portable
Memory Allocation At compile time or at runtime At runtime
Documentation Support Available but not much Extensively available and helpful
for beginners.
Encapsulation Available Available but not much only in
very few at lower levels
Flexibility Less flexible More flexible
Reliability More reliable Less reliable
Memory Management Only few languages support
automatic memory management
Automatic memory management is available
25
3.
Software Debugging
3.1 Software Bugs
Software development is a primary process which goes in accordance to the modern technologies i.e. different software development environments with the pace of swift growth. Every day complex software systems face lots of runtime bugs during the execution process [22]. Humphery provided in his studies that on average a software system consists of 10 to 20 bugs per thousand lines of code after performing compilation and testing process [45]. The existence of bugs can become a cause of major software breakdown and indirectly suffers the software vendor and users [22]. Approximately 50% to 80 % effort of software development and testing process is utilized on bug detection and localization activities. Software debugging is a process to localize the effective trace out locations of bugs in programs written in all programming languages. Conventionally debugging is a manual activity performed in two steps [5]: 1 Debugging by analyzing the execution trace of software application to figure out the causes of bug or
failure.
2 Debugging by developer during testing i.e. automated testing, to visualize the unexpected response of software application.
Due to the fact that process of development of software projects relies on great number of users and testers which required having an effective fault localization technique. This specific fault localization technique can highlight the most critical areas of software system at code as well as modular level so that any specific debugging algorithm can be used to debug the application source. Now a day‟s many complex or simple software systems are in corporation with open bug repositories to localize the bugs The activation of software bugs during the execution process of software systems can become a cause of system‟s unavailability or program crash with normal logical operation executions [3]. However the impact of software bugs experienced in real time scenario is quite different than those which are identified during the testing phase of software systems [47]. The impact difference due to scenario change from real time defect visualization to testing phase is due to certain factors including execution environment change and workload deviation. Several studies have been done on software bugs and their occurrences, many of those focuses more on bug‟s identification during development and testing phase [6]. Endres presented the readings about software errors which are identified during the inner testing of DOS/VS operating system [48]. The categorization of software faults presented by Endres was oriented on high level design faults to low level programming errors [3][48]. Glass [49] presented in his studies the high level pattern oriented sketch of software bugs and their detection during the development activity of software system [3]. Chillarege [50] discuss about the analysis of bugs and software defects during the testing phase of SDLC in comparison to the scenarios of bug occurrence in real life [3].
26
3.2 Software debugging, testing and verification
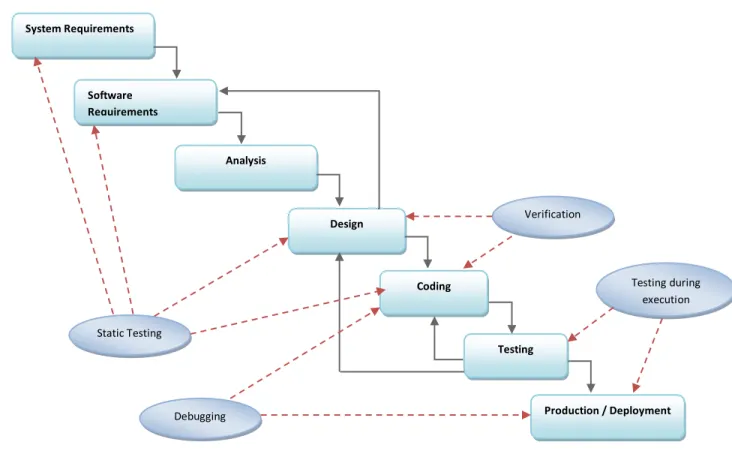
In a typical software development process, irrespective of development methodology followed, verification and validation activities are employed in order to successfully complete the project as shown in Figure 5.
Figure 5: Software debugging, testing and verification process in software development process
The purpose of debugging is to trace and correct the code which may violate a known specification [51]. Debugging usually takes place in three stages of software development life cycle as shown in Figure 5. These three development stages are coding, testing and deployment. In coding stage debugging is done by the programmer, as soon as programmer writes the code programmer also verifies it and debugs it. Bugs found in coding during this stage are quickly removed by developers before moving on to next development stage. Then debugging takes place in testing phase, testers look for unexpected behavior by program and debug as and when such bugs occur. Finally debugging is done in production/deployment phase of development life cycle. When software is deployed and it performs its functions in real life environment it is evaluated for performance, behavior, consistency etc. If software is found under-performing and/or inconsistent with functional and quality requirements it is debugged.
Verification process is done in order to validate the functional correctness of the program which is possible by capturing the model of the behavior of program in formal language or by using program itself. The formal specification of the system design is developed by using system requirements and attributes associated to functional points. In most commercial software development companies there is no formal
Static Testing Design Production / Deployment Testing Analysis Coding System Requirements Software Requirements Debugging Verification Testing during execution
27 verification process however few companies do employ verification through debugging especially in the domain of protocol verification and embedded systems. Verification through debugging is done by comparing formal specification of system design to the functions that the program actually performs. Testing is a typical verification and validation activity that is performed in almost every development phase and throughout the software development life cycle. Before coding phase, static testing is done [52] which is implemented for verifying requirement specifications, design specifications, coding standards etc by reviews, checklists and/or inspections. Once system and software requirements are transformed into program code in coding phase different dynamic and static debugging techniques can be applied to verify the correctness of program.
3.3 Debugging process
“Debugging is the activity of identification of actions and events that causes for failure of mid level crash
down of normal execution of program before ending to final stage [53]”.
Software reliability and performance are the main attributes suffered from the behaviors of software bugs [54]. Due to the triggering of any bug infected line of code in software code repository during the normal execution, uninterruptable loop iteration or some overflow value of certain variable is observed. In the process of debugging at initial level of diagnosis the failure area on which bug is discovered is manifested first. Once the failure root is identified the developer then can iterate back recursively to the bug initiator point. Even this backward tractability of source line of code at modular or application level to the bug initiator area is a monotonous approach that might take the programmer to iterate on complex structures of source line of code and deep lookup of object creations and destruction respectively [55]. However by following the recursive tractability to the bug root cause area, programmers can visualize the effective reasons of bug occurrence and base on these certain hypothesis will be constructed. Based on the hypothesis, the source code associated to bug triggering area is recorded and the application is again deployed with changes. There is an exception in this approach and that is the exact identification of bugs related to memory leakage or buffer overflow issues. The main reason of such memory related bugs or buffer overflow exception is the impact of such bugs comes on seen after a long time during the normal execution process.
The backward and repetitive exploration of bugs by continuous analysis of source code is not much fruit full activity. In order to provide an alternate approach then repetitive exploration for bugs, different scenarios for software debugging are presented by researchers.
3.4 Dynamic Slicing
Dynamic slicing is a slice based recursive tracking approach used in both automated and manual debugging. In this approach, programs are chopped in to slices and the results of these slices are then analyzed by inducting failure as well as correct inputs. The dynamic slice of computed value or method call in program source code at certain execution point encapsulates the related line of code, control structures and events, related to the calculation of that particular variable [46].
28 Following the approaches of dynamic slicing, programs can be sliced in to two ways:
1. Forward Dynamic Slices
Since the dynamic slicing involves all the related source code statements in relation with their impact in certain variables, method calls or pointer to unallocated memory space. Forward dynamic slicing point out all the trace out information of affected areas i.e. code snippets, control structures, function calls etc. due to value change of certain variable.
2. Backward Dynamic Slices
In comparison with forward dynamic slicing, backward dynamic slicing in context of certain variables or method calls include the related / dependant statements i.e. control structures, inherited methods from object classes etc. that can influence on the value of particular variable [46].
3.5 Fault Localization
Fault localization after the failure or crash of normal execution on program is a diagnostic activity of software development process and requires much effort and resources for effective completion. In traditional approaches, there are very less practices followed to indicate the trace out information of bug and its initializing point. Following such traditional approaches like tracking of bug by printing execution trace information or acquiring third party debuggers can be less effective for bug localization due to consumption of more resources and time [56].
Since manual fault localization is a less effective and time consuming process, so in order to overcome the resource and expense consumption many automated dynamic localization techniques have been produced [56]. During the normal execution process of program‟s source line of codes, dynamic results based on the execution behavior are obtained and then most likelihood of bug spots in program code are highlighted accordingly. The result provided by predicates either can be in form of TRUE or FALSE value, which represents the correctness behavior of program source code execution [5]. Moreover the automated fault localization techniques also encapsulate the base line information related to the program source code coverage and related test data generation. An empirical study of results gathered by implementation of such “Coverage Base Fault Localization” techniques revealed that dynamic evaluation of predicates implementation in program source code can visualize the likely hood and relevancies of bugs in concern with their actual generating points.
Fault localization technique in context of the coverage based code analysis initiates with the source code renovation from buggy program written in some dynamic programming language. The renovation of source code by implementing bugs in critical and semi critical areas of source code generates large number of instrumented areas to analyze the bug‟s occurrences and their behavior on normal program execution respectively. On the basis of source code coverage information provided by instrumented sites, programmers can visualize the indication and impact of failure point. Once failure areas are identified, these are ranked in predicate based localized samples.
The sampling process involves introduction or insertion of predicates at multiple blocks within the source code. The likelihood of sampled predicates within the program code will return either TRUE or FALSE value. Base on these boolean returns, statistical algorithms are used to analyze the complexity and criticality on rest of program executions due to such faulty areas. Fault localization can be visualized as
29 an automated compact technique that required the insertion of predicate based statements within program source code at modular or functional level, base on the results of which the buggy statements of program‟s code will be replaced by correct pattern [57]. The discovery of anomalous predicates out of all the implemented predicates can be done by executing the program with wrong data sets. Base on the failing execution events, the anomalous predicates then derived to correct one and again a test execution is performed to verify the updated code statements.
Fault Localization Techniques
As fault localization is the most base line activity to perform debugging process of source line of code, many studies have been done so far in the domain of fault localization. Time factor is most important in fault localization criterion implementation, so researchers have done a lot to identify the different ways to automate the localization process. At one extent some of the techniques localize the fault computation factor of statements within programs source line of code by coverage information provided by test suits, however some other techniques work on binary search base evaluation of predicate based returned values by looking at the PASS and FAIL execution on test cases to highlight the likelihood of buggy source code statements [58].
a) Tarantula
Software testing before release to end user‟s is an important activity to figure out the test results by generating some test data to software applications. The analyzed data then can be used to visualized the traces of software application source code that is not executed partially or fully due to some logical or compilation error also called bugs. The non executed source code traces can be related to localize the fault or buggy areas within source code. Tarantula in his studies utilized such datasets gathered from test suits, base on Failure and Pass results on execution of test cases with multiple test data [58]. In context of each test case with test data, the concerning source code structures including control structures i.e. If – else conditional statements, Looping structures, function call and return values are analyzed respectively. The primary concern of Tarantula fault localization is to locate those attributes within source line of code that are more likely to create a fault by execution of Failed test cases in comparison with those that are executed by Passes test cases [58]. In previous techniques the failure encounter situations are wrapped in the overall source code coverage information by certain test case. However Tarantula visualize the more in-depth of faults occurrences and their eventual behaviors by allowing the faults to happen not only for Pass test cases but also for Fail test cases respectively [59],[58].
J. Jones and M.J Harold presented the Tarantula fault localization technique by a visualization tool that relates the specification of each statement within source line of code to a specific value in relation with the likelihood of fault existence and its impact [60][61]. Base on the execution of test case by using some test data, fault related statements are then denoted by Red, Green and Yellow colors. Statements in source line of code which goes in execution by implementation of fault test cases are denoted by Red color. These red color marked statements are labeled as more suspicious to fault occurrences. The source code statements which go in execution at earliest by implementing Pass test cases are then denoted by Green color. Similarly the statements which executed both in random implementation of Pass and Fail test cases are dented by Yellow color [60]. These Yellow labeled statements are not so much suspicious but are labeled as “watched for care”. The mean spectrum value of these partitioned statements “hue” can be calculated for statement s by using the following formulae:
30
The hue factor in equation 1 presents the likelihood of faulty behavior of statement “s” respectively. The value of hue factor can be between 0 and 1, where 0 is the most suspicious and 1 is less suspiciousness of statement „s‟ [60]. In formulae (1), passed (s) represents the counting of passed test cases that executes the program source code statement „s‟ one or more than one time [58]. In the same way failed (s) is the number representing the counting of failure test cases that trigger the execution of source code statement „s‟. Since this formulae base evaluation of Pass and failure test cases with certain test data is executed with in test suite at some software application source code level so it can be used for measuring the hue factor of additional coverage entities including functions, method calls and object – class relationships [58].
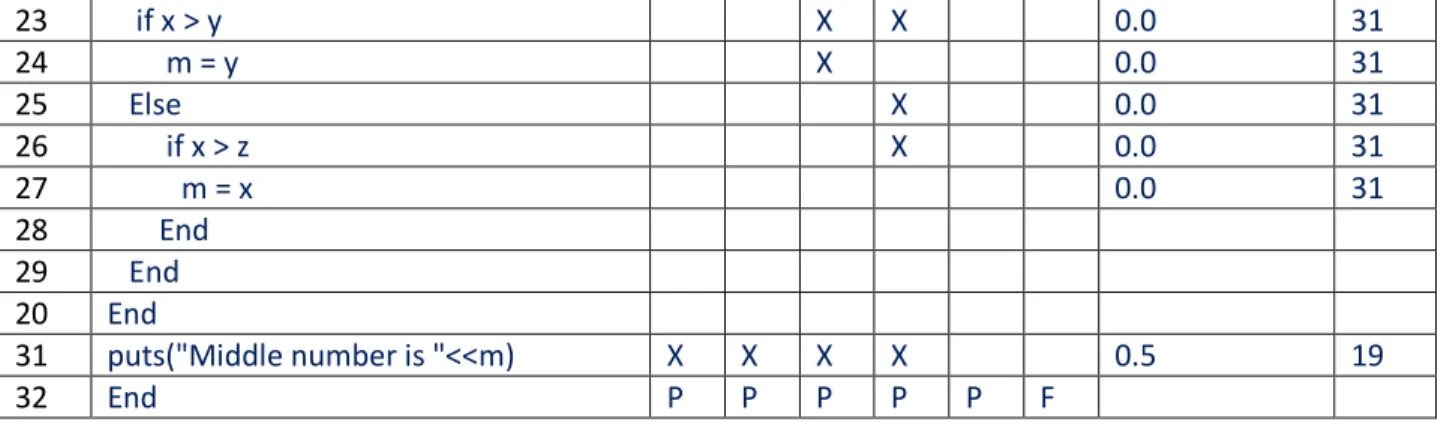
Tarantula technique for fault localization can be more discussed by analyzing a sample program that calculates the middle of three integers input by the user. The program is written in RUBY programming language. A bug is injected in source code of program at a specific locality that can be triggered by multiple test input values.
Table 3: RUBY program evaluation of TARANTULA fault localization technique S.no Ruby Source Code for finding the
middle of three numbers x, y, z
Test cases Suspiciousness Rank
3 ,3 ,5 1 ,2 ,3 3 ,2 ,1 5 ,5 ,4 5 ,3 ,4 2 ,1 ,3 1 def median () X X X X X X 0.5 19 2 x = '' X X X X X X 0.5 19 3 y = '' X X X X X X 0.5 19 4 z = '' X X X X X X 0.5 19 5 m = '' X X X X X X 0.5 19
6 puts "Enter three numbers\n" X X X X X X 0.5 19
7 puts "Enter Number 1:" X X X X X X 0.5 19
8 x = gets() X X X X X X 0.5 19
9 puts "Enter Number 2:" X X X X X X 0.5 19
10 y = gets() X X X X X X 0.5 19
11 puts "Enter Number 3:" X X X X X X 0.5 19
12 z = gets() X X X X X X 0.5 19 13 m = z X X X X X X 0.5 19 14 if y < z X X X X X X 0.5 19 15 if x < y X X X X 0.63 14 16 m = y X 0.0 31 17 Else X 0.0 13 18 if x <z X X X 0.71 13 19 m = y # BUG X X 0.83 1 20 End 21 End 22 Else X X
31 23 if x > y X X 0.0 31 24 m = y X 0.0 31 25 Else X 0.0 31 26 if x > z X 0.0 31 27 m = x 0.0 31 28 End 29 End 20 End 31 puts("Middle number is "<<m) X X X X 0.5 19 32 End P P P P P F
Table 3, demonstrates a bug injected program written in RUBY language environment. It takes three numbers from user as input values and then calculates the middle value by executing the code lines respectively. Program works fine for some input values, however by generating randomize inputs to the program, it is observed that due to a bug at line 19 the programs identify the wrong middle values. The test suite values used to analyze the fault occurrences and its impact on end result values is presented on left of the table. The suspiciousness factor in the table above is calculated by finding the ratio between the fail test cases to the total test suites and pass test cases to the total test pass test suites respectively. Consider the statement 15 that is executed by all five test cases including Pass and Fail. According to Tarantula ranking method code line 15 will be assigned by suspiciousness score of 0.63, because one failed test case in the test case suite executes it. Similarly three test cases of total five passed test cases in a test suit execute it. The calculation of assigning suspiciousness is given below:
Hue value can be calculated by using formulae given in eq. (1)
For statement 15,
32 Statements of source code are organized to rank value in accordance to Tarantula technique. Initially statement at line 19 is ranked as minimum index and hence it is the statement in set of source code line to be inspected for bug existence. In case if the fault were not on line 19, then remaining statements will be inspected for bug or fault existence. Statements 1 to 16 are having same suspiciousness values because these will be executed for any test case data from the test suite, hence are indexed with same ranking value. However there is inconsistency for line 16,17,18,19 and 23 so calculation of suspicious by using formula in eq. 1 gives different value. The statement with very less rank value will more likely to be the cause of bug and therefore will be inspected first for fault occurrences.
3.6 Statistical Debugging
Statistical debugging is a technique to implement different algorithms/techniques on different programs to identify bugs. Statistical debugging is used to track down different bugs in a program and for each bug identify most critical predicate. These predicates then ranked on the basis of different statistical debugging algorithm. Figure 6 shows the flow of statistical debugging of sample programs.
mean
Figure 6: Statistical Debugging Flow
Statistical debugging can be used to rank predicate on the basis of their criticality in the code. Also many algorithms like Context aware statistical algorithm, Baysdebugg, Cause isolation scheme, SOBER can debug return calls, function calls, predicates and exceptions.
The major limitation with statistical debugging are:
1. Statistical debugging requires effective implementation of predicate to visualize the bug traces within the sampled source code. Inappropriate predicate implementation might cause useless results and wastage of time
2. SD involves complex computational and ranking process to visualize the effected code coverage and associated computations. However SD seems to be less effective to perform fault localization of API / DLL base source code.