Business Models
for Mobile Broadband Media Services
– Case Study Indonesia Telecom Market
LAILI AIDI
TRITA-ICT-EX-2012:305
Degree project in
Communication Systems
Second level, 30.0 HEC
Stockholm, Sweden
Business Models for Mobile Broadband Media Services –
Case Study Indonesia Telecom Market
Master of Science Thesis
Student:
Laili Aidi (aidi@kth.se)
Supervisors:
Jan I. Markendahl (janmar@kth.se), KTH Royal Institute of Technology
Greger Blennerud (greger.blennerud@ericsson.com), Ericsson Sweden
Examiner:
Konrad Tollmar (konrad@kth.se), KTH Royal Institute of Technology
Communication Systems
School of Information and Communication Technology
KTH Royal Institute of Technology
Stockholm, Sweden
2012
Abstract
The increase mobile data traffic from the emerging Internet services, especially multimedia, has posed considerable challenges for the telecom industry. Their initial mobile data services business models are generally not compatible with these emerging Internet services. Thus, there is a substantial need to investigate the suitable options to make media as a profitable telecom business sector. However, there are different challenges and opportunity factors in developing sustainable mobile media business in each market, due to the unique circumstances applied as the result of customer characteristics, mobile market situation and regulatory/law enforcement.
The first purpose of this thesis is to explore the business model options to deliver media services on top of mobile broadband. Although, we limit our focus to Indonesia, we first analyzed the worldwide patterns toward the media services in order to get a broader view of the current trend. We mapped multitudes of actor involved in digital online / on the top (OTT) media service, which together they form different types of constellation in the value network, as well as service, delivery and revenue model. We also put our focus to get the lessons learned from Spotify’s business model, by framing it using Chesbrough and Rosenbloom’s model.
The second purpose is to understand the Indonesian mobile user's characteristic toward the mobile media services. We conducted survey to 119 Indonesians, analyzed the result with one sample T-tests and validated it with the correlation tests (Cronbach Alpha and Pearson correlation), within the Unified theory of acceptance and use of technology (UTAUT) framework. Our findings confirm the low willingness to pay, but an open attitude for the services. The mobile device and network quality are not the barriers for them to adopt the services, and there is a tight connection between the decisions to adopt the services with the perception that the service is popular.
Through those findings, we assessed the feasibility of the identified options and formulated the recommendations. We used our understanding about Indonesian market structure (telecom and media), regulation, and mobile user, as well as the lesson that we got from media services provisioning in Sweden and worldwide trend. We found that the pricing tiers, adjustable pricing, and differentiated features are some of the key success factors. Meanwhile, being part in the point-to-multipoint partnership with the well-known OTT player is the potential position that the Mobile network operators (MNOs) in Indonesia should take in provisioning OTT media services, rather than deliver the services by their own.
Acknowledgements
I would like to acknowledge my academic supervisor, Associate Professor Jan I. Markendahl at KTH. Jan’s consistent insightful comments on numerous occasions are invaluable for me to improve this work. In addition, the extraordinary dedication and encouragements that he has shown to his students through the whole process of the research are ones that inspire me.
I thank my industrial supervisor, Greger Blennerud at Ericsson. Greger opened possibilities to discuss with important people in the industry and gave access to the valuable market-related reading materials. He also exposed me to a valuable experience in real industrial environment and provided help in many aspects of this research.
I am also thankful to Associate Professor Konrad Tollmar at KTH, for accepting role as an examiner for this thesis research. Konrad has also given helpful feedbacks and directions, even during the process of this research. I am also grateful to Jan, Greger, and Konrad for the chances that they have given to authoring together with them in conferences, which later encouraged me to explore fascinating things within this field.
I also have to address my appreciation to researchers and staffs at Wireless@KTH and Ericsson Sweden and Indonesia, especially the team of Marketing and Communication department, Kajsa Arvidsson, Mattias Engvall, and Dharma Simorangkir. I thank them for helping in conducting interview with several contacts in the industry, providing supporting environment for me while doing this research, as well as sharing valuable ideas in numerous discussions and presentations.
Last but not least, a special grateful to my family for their support that makes me possible reach this stage. I specially dedicate this work for my beloved one, in loving memory.
Stockholm, October 5, 2012 Laili Aidi
Contents
Abstract... i Acknowledgements ... ii Contents ... iii List of Figures...v List of Tables ... viList of Abbreviations ... vii
Chapter 1 – Introduction...1
1.1. Background ...1
1.2. Problem Definition...2
1.3. Contribution ...2
1.4. Thesis Outline ...3
Chapter 2 – Literature Study ...4
2.1. Business Model ...4
2.2. Technology Acceptance...6
2.3. Mobile Multimedia Services...7
Chapter 3 – Methodology ...8
3.1. Research Approach ...8
3.1.1. Literature Study...8
3.1.2. Data Collection ...8
3.1.3. Data Analysis ...9
3.2. Quality of the Study ...10
3.2.1 Reliability...10
3.2.2 Validity...11
Chapter 4 – The Digital Music Industry...12
4.1. Industrial landscape ...12
4.2. Actors, Relations, and Networks ...12
4.2.1 Actors ...13
4.2.2 Value Network of the Core Actors...14
4.2.3 Value Network in OTT Distribution ...15
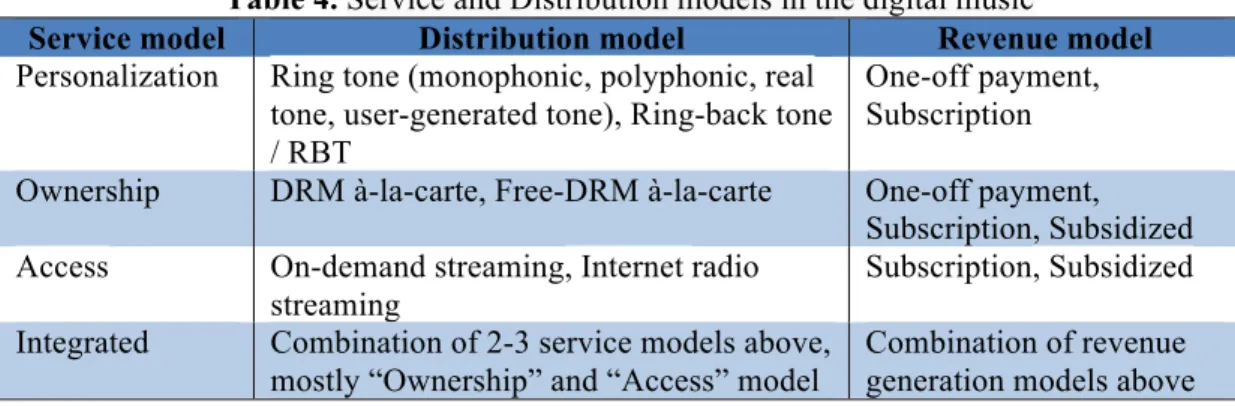
4.3. Service, Distribution, and Revenue Models ...18
Chapter 5 – The Digital TV/Video Industry...21
5.1. Industrial landscape ...21
5.2. Actors, Relations, and Networks ...21
5.2.1 Actors ...21
5.2.2 Value Network of the Core Actors...22
5.2.3 Value Network in OTT Distribution ...23
5.3. Service, Distribution, and Revenue Models ...27
Chapter 6 – Spotify Business Model ...29
6.1. Value Proposition...29
6.2. Revenue Generation and Market Segment...30
6.3. Competitive Strategy ...31
6.4. Value Network ...32
6.3.1 Relation with the core actors of the music industry...32
6.3.2 Relation with the Telecom actors...33
Chapter 7 – The Indonesian Market ...36
7.1. Regulatory Framework ...36
7.1.1 QoS and Technology Convergence...36
7.2. Telecom Market ...37
7.2.1 Structure and Characteristic ...37
7.2.2 Mobile broadband ...38
7.3. Media Services Market ...40
7.4.1 Sample Characteristics ...41
7.4.2 Technology Acceptance ...42
Chapter 8 – Implications to Indonesia...47
8.1. Actors, Relations and Business models ...47
8.2. Indonesian Mobile Media user’s characteristic ...49
8.3. Potentials and Challenges for MNOs in Indonesia ...50
8.4. Positions and Roles for MNOs in Indonesia...51
Chapter 9 – End of Discussion ...54
9.1. Criticism of the Study ...54
9.2. Future Work ...54
Bibliography ...55
Appendix A – Qualitative Interviews... viii
A.1. Interviewee List... viii
A.2. Interview Transcripts and Notes ... ix
Appendix B – Mobile Network Operator in Indonesia ... xxviii
Appendix C - Quantitative Survey ...xxx
C.1. Summary of the Hypotheses and Questions...xxx
List of Figures
Figure 1. Data tsunami trend by various researches [53] ... 1
Figure 2. Business model concept hierarchy [1] ... 4
Figure 3. The Technology Acceptance Model (TAM) [30]... 6
Figure 4. The Unified theory of acceptance and use of technology (UTAUT) [33] ... 6
Figure 5. Digital music revenue and its percentage share over total revenue worldwide ...12
Figure 6. Conceptual actors and relations of the music industry’s core network...14
Figure 7. Actors and relations of “Direct-To-Fan” in the digital music...15
Figure 8. Typical actors and relations of the “Point-to-Point” partnership in the digital music ...16
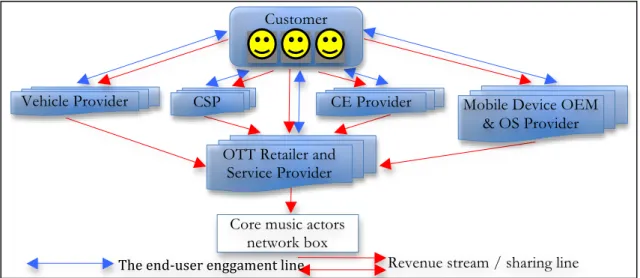
Figure 9. Typical actors and relations of the “Point-to-Multipoint” partnership in the digital music ...17
Figure 10. Revenue stream share from the digital music [68]...20
Figure 11. Actors and relations in the TV/Video industry’s core network...22
Figure 12. Typical actors and relations of the “Direct-to-Fan” partnership in the digital TV/Video...23
Figure 13. Typical actors and relations of the “Point-to-Point” partnership in the digital TV/Video...25
Figure 14. Typical actors and relations of the “Point-to-Multipoint” partnership in the digital TV/Video...26
Figure 15. Revenue share from the digital TV/Video [79] ...28
Figure 16. Spotify’s user based by service type in Europe, Sept 2008 – March 2011 [73]...31
Figure 17. Spotify monthly revenue by service type in Europe, Sept 2008 – March 2011[73] ...31
Figure 18. Actors and relations in Spotify point-to-multipoint partnership ...32
Figure 19. Fixed broadband penetration in the BRICI countries [81] ...37
Figure 20. Mobile phone penetration in the BRICI countries [81]...39
Figure 21. Question 1 result...xxx
Figure 22. Question 2 result...xxx
Figure 23. Question 3 result...xxx
Figure 24. Question 4 result...xxx
Figure 25. Question 5 result...xxx
Figure 26. Question 6 result...xxx
Figure 27. Question 7 result...xxxii
Figure 28. Question 8 result...xxxii
Figure 29. Question 9 result...xxxii
Figure 30. Question 10 result...xxxii
Figure 31. Question 11 result...xxxii
Figure 32. Question 12 result...xxxii
Figure 33. Question 13 result...xxxiii
Figure 34. Question 15 result...xxxiii
Figure 35. Question 16 result...xxxiii
Figure 36. Question 17 result...xxxiii
Figure 37. Question 18 result...xxxiii
Figure 38. Question 19 result...xxxiii
Figure 39. Question 20 result...xxxiv
Figure 40. Question 21 result...xxxiv
Figure 41. Question 22 result...xxxiv
List of Tables
Table 1. Interpretation of Internal consistency from Cronbach alpha ...11
Table 2. Interpretation of Correlation coefficient from Pearson Correlation...11
Table 3. Revenue models in the digital music ...18
Table 4. Service and Distribution models in the digital music...19
Table 5. Revenue models in the digital TV/Video...27
Table 6. Service and Distribution models in the digital TV/Video ...27
Table 7. Formation changes in Indonesia's Telecom Regulation ...36
Table 8. Hypothesis 1 result...41
Table 9. Hypothesis 2 result...42
Table 10. Average and Internal consistency of respondent’s willingness to use ...42
Table 11. Internal consistency of respondents’ expectancies ...42
Table 12. Hypothesis 3 result ...43
Table 13. Hypothesis 4 result ...43
Table 14. Average of respondents’ expectancies ...43
Table 15. Internal consistency of respondents’ expectancies ...44
Table 16. Hypothesis 5 result ...44
Table 17. Average and Internal consistency of respondents’ perceive to MNO network & billing ...44
Table 18. Hypothesis 6 result ...45
Table 19. Average and Internal consistency of the respondents’ perceive in mobile device feature and ownership ...45
Table 20. Hypothesis 7 result ...46
Table 21. Average and Internal consistency of the respondents’ believe about social environment ...46
Table 22. Hypothesis 8 result ...46
Table 23. Interviewee List...viii
Table 24. Interview with Lars Roth... ix
Table 25. Interview with Andreas Liffgarden...xv
Table 26. Interview with Märta Rydbeck ...xvi
Table 27. Interview with Jockie Heruseon ...xxi
Table 28. Interview with Yose Tireza Arizal ...xxiii
Table 29. Interview with Didik Akhmadi Usman ...xxv
Table 30. Interview with Hengky Philip Ginting ...xxvi
Table 31. MNOs in Indonesia...xxviii
List of Abbreviations
Telecom operator Provider of telecommunication services that delivers telephony and
data communication access, and mostly functions as internet service provider (ISP) as well.
Mobile Network
Operator (MNO)
Telecom operator that provides the communications services over wireless access that owns or controls necessary elements to deliver cellular services to the end-user, especially radio spectrum license and network infrastructure
Communications
service provider
(CSP)
Provider that delivers communication services to the end-user (telecommunications, entertainment and media, and Internet/Web services) encompasses telecom operator (landline and mobile), Internet service provider, and cable and satellite provider.
Mobile broadband Wireless Internet access through mobile device, using one of the
wireless network technologies: CDMA2000 1X EV-DO (EV-DO Rev. A and Rev. B), WCDMA, WCDMA HSPA (HSDPA, HSUPA and HSPA+), TDSCDMA, WiMAX and LTE (FDD-LTE and TDD-LTE).
Third-generation (3G)
Wireless network technology defined by the ITU (International Telecommunication Union), include all of those listed under ‘Mobile broadband’ as well as CDMA2000 1X, some also includes the LTE and WiMAX which are not classed as 4G (LTE Advanced and WiMAX 2).
Average revenue per user (ARPU)
Revenue divided by weighted average number of customers at the same period (e.g. monthly).
Blended ARPU Revenue divided by average number of total subscribers at the same
period (e.g. monthly).
Voice ARPU ARPU from voice services
Data ARPU ARPU from data services
Value added
services ARPU
(VAS ARPU)
ARPU from value added services (e.g. ring tones, ring-back tones (RBT), wallpaper downloads, screensaver downloads, music, TV/Video)
Non-voice ARPU ARPU from all non-voice services (Data, Messaging, Value added
services) Over-The-Top
(OTT)
Services that are utilized over the network, delivered directly to the end-user via any connected devices, but the network access operator itself does not offer that. It rides on top of the services already provided and do not require any business or technology affiliations with the underlying network access operator
OTT TV/Video OTT service that range to TV broadcasting to video services, e.g.
video conferencing, video chat, video on demand, Live TV broadcasting, etc
Chapter 1 – Introduction
This chapter presents a brief introduction along with the description of the addressed problem areas of this study. At the end, the expected contributions to the knowledge and solution are described.
1.1.
Background
The evolution of Internet and growth of smart phone penetration have resulted a paradigm shift in society. It triggers higher expectation to the user and increases competition level across the markets. Cisco reported that the typical users using this device consume data traffic ~79 MB/month, compared to ~3.3 MB/month from basic feature mobile phone users. This is predicted to keep increase in the future, reaching ~1.3 GB/month [50]. Mobile data usage was also reported to grow to 83 % in 2011, in line with the data traffic tsunami predictions [51], as shown in Figure 1. This poses a considerable challenge for the telecom industry, such as weakening user relationships and diminishing revenue from existing voice and messaging services [52].
Figure 1. Data tsunami trend by various researches [53]
However, this also offers a potential moment for telecom operator to evolve, remain competitive, and copes with those challenging situations. The data shows that mobile broadband subscriptions have increased to almost half of 2.4 million Internet users by 2011 [62]. It grew by 45% annually over the last 4-years and reached twice of the fixed broadband subscriptions. There are five emerging developing markets (Brazil, Russia, India, China, Indonesia), called as the BRICI countries that represent 45 % of the world population and predicted to add 1.2 billion more Internet users by 2015 [54]. Mobile broadband likely becomes a preferred access mechanism there, due to cheap smart phones, low PC penetration, limited fixed broadband, etc [55].
The combination between mobile broadband and media services offers a huge potential to be a source of revenue and a key to growth for telecom operator in those emerging markets. The digital music revenue, for example, has increased to 8 % for the first time since 2004 [56]. It was followed by the growth in the subscription to streaming services, purchasing download, and expansion of digital media services across the globe, especially in the mobile devices. This is in contrast to what have happened in the fixed broadband, where the file sharing services dominated. The mobile broadband’s role in these emerging markets is important, as it is likely not just as a substitution for fixed broadband, as we have seen in developed markets [55].
Indonesia is interesting to be a case study due to its market size and potential growth. The mobile penetration has passed 113 %, but it is still expected to grow [61]. In addition, despite the 3G has been rolled out for more than five years, its penetration is still less than 10%. The GDP is growing fast compared with neighbors in the region, followed by booming of the middle-class and young population [98][60]. There are tendencies to watch OTT video through mobile devices rather than the Internet-TV [57]. The personalization service is still dominating the digital music landscape and MNO has a strong position towards the billing relationship, as bank account penetration is extremely low, covering less than 20% of the population [59].
1.2.
Problem Definition
There are different challenges and opportunity factors in developing sustainable business, both when viewing it in the global and local market perspective. The combination of the aspects above creates unique circumstances to the Indonesian market. In addition, our findings show the complexity that the telecom actors should face to offer media services. First, it requires them to serve users with a higher demand and to understand the differentiation aspects to suit types of user segment [42]. Second, there is a trend in the telecom industry, where new actors with different economic interest enter the ecosystem and introduce changes [37]. Third, the digital piracy remains a barrier for business growth [56].
In addition, the initial mobile data services business models that the telecom actors usually use are not compatible with these emerging Internet services [41]. Therefore, there is a substantial need to investigate and/or analyze suitable options in the existing mobile broadband business models, in order to make it as a profitable telecom business sector. However, the business model itself is a vast scope of a subject, as it covers broad range of aspects and is seen in different points of view [1][2]. The telecom industry itself also runs in a dynamic environment, e.g. in term of demographical, social, economical, and political situation. Despite the similarities among particular user segments across these emerging markets, there are differences in usage habit [54].
Therefore, the strategies used to monetize the potentials and to overcome the challenges mentioned above have to be targeted to a specific service and market. Hence, the universal solutions would not be suitable. Therefore, the main intention of this thesis is to explore the business model options for mobile broadband media services in the Indonesian telecom market. In order to do that, the following four questions below are answered in this thesis: 1. Who are the actors involved in serving the media services, and what kind of relations and
business models do they use?
2. What are the mobile user’s usage characteristics, especially in Indonesia, toward the media services through mobile broadband?
3. What kind of potentials and challenges would the MNOs in Indonesia face in providing media services as a mobile broadband business?
4. What kind of positions and roles can the MNOs in Indonesia take to make media services as a profitable business?
1.3.
Contribution
In order to analyze and evaluate the feasibility of solutions described in the problem definition above, we will need to see it from a multitude of perspectives. Therefore, this tele-economic discussion was done from a range of aspects and presents outcomes as below:
1. Business models and market structure
We do classification and assessment of different types of existing business model that are currently used to deliver mobile broadband media services worldwide, and then put focus to Sweden, as our reference market. We then provide insights of the telecom and media market structure in Indonesia, which is our target market. In other words, this result mainly concerns about the supply side aspect. The discussion contains analysis of eco-systems, which are the
identification of actors, their relation model, business roles, and responsibility distributed among them, as well as drivers and challenges of their strategies. This industrial background is structured as market maps that consist of telecom operators and other actors in the media and Internet industry.
2. Mobile media user
The second outcome is the understanding of mobile media user, which means the discussion relates to the demand side aspect. The majority of users are not interested with the technical details, and the successful loyalty programs demand the provider’s ability to capture the actual or further composition structure of their preferences. In this context, we analyze the customers’ preferences’ patterns worldwide toward the media services, then we are in deep to Indonesia customer characteristic. It ranges to satisfaction aspect, willingness to pay and continue using the service, and expectation. This is done because, before we are able to identify the suitable business model options for a market, we need to first identify and predict these aspects.
3. Recommendation
Through those two studies above, we analyzed the feasibility of the identified options. We used the market understanding data that we had about Indonesia as an affirmation tool. In other words, we highlight the available business model options to deliver media services on top of mobile broadband in Indonesia. We do this according to our understanding of its market structure (telecom and media), regulation, and end-user, as well as the lesson that we learn from the trend that has happened / is currently happening in the global and reference market (Sweden). We expect that, by using our analysis and recommendation, the MNOs can take a strong position and build profitable business in delivering mobile broadband using media services.
1.4.
Thesis Outline
The structure of remaining chapters in this thesis is done as follows. Chapter 2 lays theoretical foundation and frameworks required to understand the research areas. It ranges in the business model, technology acceptance field, as well as related study of the mobile media services.
Chapter 3 describes the activities undertaken to accomplish the research. This chapter also argues the frameworks and theory used as the basis of the work. Chapter 4 and chapter 5 present the introduction of current landscape of digital music and TV/Video industry. It is followed by discussion of the actors involved, and relations and networks that they form, as well as evaluation of the distribution models, service models, and revenue models used.
Chapter 6 contains the analysis of Spotify business model, and discusses its collaboration with other actors in different industries. Chapter 7 presents the Indonesian mobile telecom and media market, as well as regulatory framework. After that, the discussion of the mobile users is presented, along with the empirical results of the quantitative study, where the hypotheses about these users are tested and analyzed.
Chapter 8 consists of conclusions of final analysis and implications for Indonesian market, related to the research questions. The discussion is formulated based on the findings derived from the global market trend, lesson learned from mobile media service pre-study in Swedish market, as well as understanding about the Indonesian market (regulatory, telecom and media market, and mobile user). Finally, some critics of the study along with suggestions for future work are presented.
Chapter 2 – Literature Study
This chapter presents the review of theoretical foundations, frameworks, and related studies. The discussion ranges from the business model concepts, to the technology acceptances and the mobile multimedia services.
2.1.
Business Model
Despite its popularity, there is no common consensus on how to define the business model, and this term is often used to express different things [1]. Thus, it is important to stand on the specific definition, before we review various concepts. According to [2], business model is “a conceptual tool containing a set of objects, concepts and their relationships with the objective to express the business logic of a specific firm. Therefore we must consider which concepts and relationships allow a simplified description and representation of what value is provided to end-users, how this is done and with which financial consequences.” Following this, various business models written in range of sources are classified into three categories, which might be hierarchically linked to each other, as shown in Figure 2.
Figure 2. Business model concept hierarchy [1]
First, business model is stated as a concept that can be used to describe various businesses (Concept point of view). This is the abstract layer, which is designed to answer typical basic definitions and/or the meta-model questions. The works in [2], [8], and [9] for example, provide both concept and meta-model framework to design a business model. The work in [2] defines the Business Model Ontology (BMO) that constructs business model using four main pillars (product, customer, interface, infrastructure management, and financial aspects), and then split it into nine interrelated business model building blocks as core of the ontology (value proposition, target customer, distribution, channel, relationship, value configuration, capability, partnership, cost structure and revenue model). In [9], this framework consists of six components, which are the value proposition, market segment, value chain structure, revenue generation and margins, value network and competitive strategy.
Second, business model is explained as types of model that each is used to describe a set of business with common characteristics (Taxonomy point of view). The typical questions answered here are either the taxonomy of types and/or the sub-meta question. One example is
[6] that classify the different business models according to the types of value proposition and revenue stream. It classify nine generic forms of e-business models based on value proposition and revenue stream are proposed, which are brokerage, advertising, infomediary, merchant, manufacturer, affiliate, community, subscription, and utility model. Meanwhile, the work in [5] defines specifically business model in wireless business based on revenue stream and target user segments. This was modified from previous models, which consist of nine models as well: advertising, application provisioning, brokerage, content provisioning, infrastructure provisioning, network operating, service provisioning, application service provisioning, internet service provisioning, and terminal manufacture.
Third, business model is discussed as a “bottom-line” analysis that represents an instance of the generic business model (Instance level point of view). It describes the real world business, such as the particular operating case or firms’ business model. The works in [3] and [4] cover the tele-economic calculation, which are the network rollouts assessment for a mobile broadband access. The objective is to evaluate, present the viewpoint from radio-access network investment, and make an evaluation of providing amount of user with forecasted traffic demand. The profitability and the viability of business model are then evaluated using cost and revenue matrix. The work in [9] also matches into this category, as it assesses the implemented and existing business models. In this case, the Xerox’s business model is analyzed using the framework designed previously.
The Network-centric approach
There has been a concern raised that business model should also be seen as cross-firm collaboration as the value network analysis. Focusing to only a single company’s perspective is insufficiently suited to address the services that require multi-actors collaboration [10]. The mobile telecom business itself is also getting complex because there is multitudes of actor outside the industry, with different economic interests, enter the market [12]. Therefore, it is fundamental to identify all of these actors and their roles, as well as to understand their interaction with each other. Numbers of works specialized to ICT field have broad business model analysis of traditional manufacture industry into variety of actors, interaction and strategy discussion, either in the concept, taxonomy and/or taxonomy point of view.
In [5], there has been an identification of nine basic types of actors and roles in the wireless business, which are application provider, application service provider, content aggregator, content integrator, content provider, infrastructure provider, network provider, service provider, and terminal manufacturer. In [13], there are assessments of two existing models for multi-actors analysis, one is based on the system theory (MACTOR) and other is game theory (Allas model). The new model, MASAM, is then proposed to capitalize and overcome previous’ strengths and weaknesses. The cooperation models used by telecom operator to interact with some of these actors are discussed in [7], using the Actor, Relation, and Activity (ARA) point of view. It focuses to three services (public mobile broadband access services, services and solutions for indoor wireless access, and mobile payment and ticketing services), by identifying main drivers of cooperation and how to organize it.
The primary lines of reasoning of the partnership between actors are grouped in [12]. The first motive argued is “Cospesialization”, which is to make the product in optimal and economically scale through specialized resource or knowledge of partner. Such common examples are outsourcing and sharing infrastructure. The second motive is “Cooption”, which is to reduce or share the risk and uncertainty in the environment. Such example is the engagement in a temporary alliance with the actor/s that was/were previously the competitor (“co-opetition”). The last is in order to do “Learning and internationalization”, which is the resources acquisition. The targets are mostly knowledge, data, or end-user access. This is done in order to leverage the business model or competencies, e.g. to conquer the new market. This is also mentioned in [18] as “accessing complementary asset”. This is done to leverage the existing business model and/or competencies.
2.2.
Technology Acceptance
Mobile media streaming service would bring shift in the habit of the early user. The diffusion of a new technology is a result of decision series and comparison factors from end-user’s perception regarding the benefits and costs of adoption. Therefore, the ability to predict this diffusion plays an important aspect in assessing the suitable business models of new services, because the potential user might not adopt it, in spite of the availability of that technology in the market. This factor includes user’s readiness to use and willingness to continue using the technology, especially in Indonesia where mobile broadband media services do not take off yet, compared with the developed markets.
Researchers have performed various theories and designed frameworks to analyze factors that affect end-user intention to adopt new technologies and services. However, substantial theoretical and empirical works accumulate to some of it. Such works in mobile Internet field are [34], [35] and [36] those adopt, extend, and combine several frameworks. They assess range of mobile value-added services, due to its flexibility to fit in various cases. The prominent one is Technology Acceptance Model (TAM), shown in Figure 3, designed for two purposes during early stage of computer [30]. First is to understand a successful acceptance process from implementation of new information system. Second is to provide a basis of methodology to predict further usage of a technology after a brief interaction.
Figure 3. The Technology Acceptance Model (TAM) [30]
However, as TAM gives more attention to examine the factors that drive user’s adoption, it is inadequate to assess how the external interventions would affect individual perceptions and their attitude intention. These are important to evaluate successful new implementation of information system [31]. Moreover, TAM is also designed to examine user’s adoption and intention to continue using the technology after user had exposed to it. This means, this framework is rather to explain post-adoption behavior. It is not originally designed to be used during pre-implementation stage, which is also critical to assess the sustainability of the new technology [32].
Figure 4. The Unified theory of acceptance and use of technology (UTAUT) [33] Design feature Cognitive response Affective response Behavioural response
Perceived usefulness
Perceived Ease Of Use
Attitude Toward
Using Actual System Use X1 X1 Xn Performance Expectancy Effort Expectancy Social Influence Facilitating Conditions Behavioural Intention Use Behaviour Gender Age Experience Voluntariness of
The Unified theory of acceptance and use of technology (UTAUT) should be taken into account [33]. This framework is visualized in Figure 4 above. It was designed as an extension of eight previous prominent models1, in order to overcome their imitations, especially on
considering social context and personal expectancy. This model is able to explain 70% of the observed variances in the study; compared to 17 - 53 % of TAM’s cite success. It has been tested to the technology usage cases for both individual and organizational/enterprise oriented, as well as in the voluntary and mandatory context. It includes the demographic factors ignored previously and it was designed to examine the technology during their initial introduction state.
The UTAUT framework consists of four user acceptance and behavior factors. The performance expectancy means a degree that user thinks that this new technology will help them in gaining in a job performance. The effort expectancy is a degree of ease associated with usage of the new system. Social influence is a degree to which user perceives the importance of others to think he/she should use this new technology. The facilitating conditions a degree that user thinks the infrastructure is available to support them to use this new technology. These determinants lead to behavioral intention, with is influenced by four key moderators: gender, age, experience, and degree of voluntariness to use the technology.
2.3.
Mobile Multimedia Services
Several works have been done to research the emerging media services in mobile environment, but most of it focuses to either the technical underlying details or technology acceptance factors. As far as our knowledge, the study about mobile media services that analyses both the business aspect (in multi point of views) and user acceptance factors are not covered yet, especially one that is intended for the Indonesian market and considers the unique circumstances there (regulatory, telecom/media market and mobile user characteristics)
The work in [38] assesses the factors that will affect the mobile video services usage and implications to the service providers. It limits the focus to user-generated on-demand video, where the assessment was done based on theories of the Long tail, user-generated content (UGC), technology acceptance, as well as mobility and self-expression. The findings covers the influence factors connected to the service offering and value for the users, as well as indicate the importance to the service provider to cooperate with other actors in offering and marketing the service.
Moreover, the study in [39] also explores user’s preference in the mobile multimedia service and put the focus to the young people. It was done to investigate the possible value added services from the multimedia that can be offered to this user segment. The findings, which were investigated using the Innovation Diffusion Theory, reveal that the cost and technical constraint to use the service are the main barriers for this user segment, and it is followed by the knowledge level about the offered services. This knowledge factor is also confirmed in [38] as one of the important factors that should be considered by service provider. Furthermore, the impact of the convergence that happens in the multimedia business is analyzed in [17]. This work explores how this convergence drives change in the competitive strategies of the media and communication actors. It also mentions about multitude of actors form different origins that may attempt to assume the most favorable position, and assess the strategic options that can be taken by these actors in form of migration and integration. However, this work only point out the actors’ positioning in value chain point of view, and actors’ constellation in the value network were not covered.
1 Technology Acceptance Model (TAM), Theory Reasoned Action (TRA), Motivational Model (MM), Theory of Planed
Behavior (TPB), Combined Theory Acceptance Model and Theory of Planned Behavior (C TAM-TPB), Model of PC utilization (MPCU), Innovations Diffusion Theory (IDT), Social Cognitive Theory (SCT)
Chapter 3 – Methodology
This chapter presents the motivation of the research approach, theories, and frameworks used. In addition to that, we also present the detail methods for the data collection and data analysis, as well as strategies to assure the quality of this study.
3.1.
Research Approach
In many cases, a research is done either using a qualitative or quantitative approach. The intention of this thesis is more into understanding the phenomenon and answering the problem that the important factors are still unclear. Thus, the main research approach that fits to be used is a qualitative.
However, there is also a need to use the quantitative approach, especially to get an understanding of the media user by using a statistical validity. Therefore, the mixed approach is suitable, where the qualitative approach is complemented with the quantitative approach [19]. We applied this approach to four research phases: literature study, data collection, data analysis, and then forming the conclusion and recommendation for the future research.
3.1.1. Literature Study
As the research needs to dive into a range of perspectives, we first establish clarity of theoretical building blocks. We have to get an understanding of the business model concept. This includes the mechanism of how frameworks and theories work, as well as their antecedent and consequence. In this discussion, we also get deep into a value network discussion, which is to model the relevant actors in the digital media ecosystem and relations among them.
The industrial background and user’s acceptance factors also play an important aspect, which also as a based of the analysis. Thus, we reviewed the technology acceptance frameworks, especially ones that can be used to study the mobile services. This was used to understand the current and future pattern of media services diffusion that is delivered on top of mobile broadband in the Indonesian market.
3.1.2. Data Collection
Beside the literature study, there were also data collection and analysis stages. These were done to understand the business models used to deliver the media services on top of broadband in worldwide markets today. However, the final intention is not to design such new solutions, but to evaluate the existing ones and to identify suitable options for the case study market. Therefore, analyzing the pattern of existing business models becomes a requisite, before we be able to evaluate and propose the relevant options. In order to do that, we used the data collection techniques, as mentioned below:
• First, we conducted the unobtrusive technique through secondary resources, as the basis of our research problem definition and pre-study cases analysis [20]. Discussions with the advisors and examiner also helped us to formulate the problems. Different types of source from both the relevant and adjacent areas were studied. It consists from academic and market report, to the newspaper and magazine articles. The KTH library catalogue was used to gather the scholarly journals2, while the market reports and analysis documents
were mainly searched through Ericsson’s business intelligent center (BIC)3.
• Second, we have undertaken the qualitative interviews with the contacts in the companies that operate in the reference market (Sweden) and target market (Indonesia). These persons are relevant due to their expertise and professional activities in the telecom and
2 “KTH Bibliothek”, available http://www.kth.se/kthb/
media industry that relate to our study. These interview sessions took around 1 hour and conducted as semi-structured and open questions4. This was done to get an understanding of the context of these actors’ decision, intention, and opinion about the case we were studying. It means we performed the expert sampling [20] that covered the contacts from MNOs, telecom regulator, OTT music service provider, TV broadcaster and mobile content provider. The list of the interviewees is available in Table 23 at Appendix A – Qualitative Interviews.
• Third, we gathered the quantitative user data using a simple random sampling survey [20]. This empirical data was used to perceive user patterns (behavior, expectation, perception, and acceptance) toward the mobile media services. Therefore, we could get a better understanding of this market and snapshot of end-user affirmation. The questionnaire was a combination of types of question: multi-item statement (“Likert response scale”), multi-choices, dichotomous, contingency, and open questions.
We first conducted the pre-test survey to a small sample of respondents in Sweden, to improve the questionnaire accordingly. The survey then was opened for 14 days from July 30 to August 12, 2012 and published in the survey monkey, an Internet-based survey tool5. The link to this survey was privately mailed to an extensive list of 1488 Indonesians,
who were randomly selected from social media websites and mailing lists. During that period, we got 195 responds, which consist of 119 valid data. Then, this valid data was used to test and validate our hypotheses about the Indonesian mobile users.
3.1.3. Data Analysis
It is important to do the analysis for the broadband business in its complete ecosystem (network, aspect, services, and application aspects), in order to get a complete understanding and picture of what we are dealing with [40]. In the network aspect, we focused on the analysis of the business model specifically for mobile broadband. The service and application aspect was concentrated on the multimedia in entertainment aspect, covered digital mobile music and TV/Video application. The analysis about end-user aspect covered the consumption and preference pattern of the mobile user to those services, in the global and Indonesian market perspective.
Based on the problem domains defined previously, it is clear that the scope of this thesis is not to form new business models, but to assess the suitable options. Thus, the analysis was done with the pre-study and post-study analysis according to theoretical framework mentioned in 2.1. This pre-study analysis consists of three parts:
• First, we saw the business model as value network of entities (Network centric approach) [10], because there are multi-actors involve in the media business ecosystem. We identified these actors, what kind of roles they have, and the value network they form in the OTT music and TV/Video services provisioning. We used the actors, resource, and activities (ARA) point of view [7], where the identification of these actors was elaborated from the work at [5].
• Second, we analyzed common characteristics that lie in the business models used to deliver media services worldwide. We evaluated different business models (Taxonomy point of view) [2], by elaborating the work at [6] and [5]. Here, we observed different forms of business model based on the service, distribution, and revenue model.
4 The interview questions for the representatives from companies based in Sweden are designed together with the other
students that studied similar topic but different case study, which are Ekambar Selvakumar and Jin Huang
• Third, after getting the understanding of these digital media industries landscape, we evaluated specific firms’ business model (Instance point of view) [2]. We chosen Spotify, as it is one of the current prominent OTT and mobile media service providers in Europe and have inter-actor relation within its business model. We framed our analysis by using six elements in the framework designed in [9].
These three analyses provide us the conceptual bridge to align the triangle of strategy, organization, and technology. We need to do those, as mobile broadband in Indonesia is still immature and mobile media services have not taken off yet. Therefore, there is not much to learn if we only see it from a local point of view. Therefore, it would be hard to analyze this target market, without first doing the pre-study analysis to the mature markets and get understanding of the landscape.
While doing this pre-study analysis, we developed hypotheses that later are then tested in the post-study analysis, which was OTT music and TV/Video services provisioning in Indonesia’s mobile broadband market. These hypotheses and its tested variable are listed in Table 32 in Appendix C.1. Using this, we assessed the Indonesian mobile users’ acceptance and readiness toward media services through mobile broadband within the UTAUT framework [33], which was chosen as it is an improvement of the previous prominent user acceptance models and has widely used among researcher, as discussed in section 2.1.
UTAUT is based on belief that individual factors affecting user’s decision to accept or reject a technology or service can be identified and measured. According to this, user’s expectancy for performance, effort for adoption, and social environment would influence behavioral intention. This intention, along with the facilitating condition factor, is fundamental determinant of the actual usage behavior. It also considers age, gender, experience, and voluntariness aspect, and it has been successfully applied in numerous studies. Therefore, this is suitable to be used in this study, to understand Indonesian mobile users’ characteristic toward mobile broadband media services.
3.2.
Quality of the Study
3.2.1 Reliability
Reliability refers to the consistency and/or stability of a particular result from procedures done in the different circumstances, assuming the variable factor/s has/have not changed [21]. As this thesis uses mixed approach, thus the reliability to both of the qualitative and quantitative study should be taken into account. The reliability of the qualitative study was ensured by letting the interviewee be informed about the interview protocol and the questions prior to the interview session.
In addition, because the interviews are semi-structured and open questions, the interviewer might repeat and paraphrase the information relayed by the interviewee, to correct any misunderstanding. We mostly recorded the conversation on behalf of the interviewee’s permission, which makes us possible to re-analysis the information in its whole context later during the post-interview session. The main points from the interviewee’s answer to each question are listed in Table 24 to Table 30 in Appendix A.1.
The reliability of the quantitative study was ensured using internal consistency, by testing the hypotheses in a single survey. Internal consistency refers to the degree of the relation among items measured [22]. This means, in this study we assessed the internal consistency by measuring how the results (variable) from different questions that are designed to measure the same hypothesis, yield to the similar construction. We assessed these results using two prominent types of Correlation tests, which are Cronbach alpha and Pearson product-moment correlation (Pearson correlation).
Cronbach alpha shows us the consistency of the variables, which is approached within the value of its reliability coefficient (α) [22]. The assessment for the Cronbach alpha’s values is done by following the thumb mentioned in [23] as quoted in [24], as listed in Table 1. Meanwhile, Pearson correlation shows the correlation coefficient value (r), which tells us whether the variables correlate each other and the strength of their correlation. This at the end also represents the reliability. Nevertheless, different with the Cronbach alpha, it only can be used to measure two variables. Pearson correlation may show negative or positive value, which the negative value means the negative correlation between two variable (one variable, the other decrease), and vice versa. The assessment for the Pearson correlation‘s values are done by following the thumb as listed in Table 2.
Table 1. Interpretation of Internal consistency from Cronbach alpha
Reliability Coefficient Internal Consistency
α ≥ 0.9 Excellent 0.8 ≤ α < 0.9 Good 0.7 ≤ α < 0.8 Acceptable 0.6 ≤ α < 0.7 Questionable 0.5 ≤ α < 0.6 Poor α < 0.5 Unacceptable
Table 2. Interpretation of Correlation coefficient from Pearson Correlation
Pearson Correlation Correlation coefficient
-0.09 to 0, or 0 to 0.09 None -0.3 to -0.1, or 0.1 to 0.3 Small -0.5 to -0.3, or 0.3 to 0.5 Medium -1.0 to -0.5, or 0.5 to 1.0 Strong
3.2.2 Validity
Validity describes the extent to which a measurement accurately represents what it intents to measure [21]. In the qualitative study, the validity was enhanced using the triangulation strategy. Here, we use multi sources of information in the qualitative data collection, which are the secondary sources and interviews. The qualitative validity was also ensured through carefully choosing these data, including the report documents, companies and interviewees. The data taken from the secondary resources were compared and cross case analyzed with the information from the interviews session, and vice versa. Therefore, the bias and interpretation from author’s personal perspectives can be minimized.
The validity of the quantitative study was assured through both external and content validity. The external validity was done by performing a survey to the small random sample of Indonesians who are currently living in Indonesia, which means the study was carried out to the representative environment to which the study are intended to be applied. The content validity was achieved by conducting the pre-study to the reference markets, with the support of literatures review and qualitative data collections. Thus, we could design the questions that have a close connection with theoretical frameworks (UTAUT) by ensuring the aspects within the framework were measured. The questionnaire was made using Indonesian language (Bahasa) instead of English, to avoid any misinterpretation about the context of the questions.
Chapter 4 – The Digital Music Industry
This chapter presents the analysis of business models used in the digital music industry. We start with the current landscape of the industry, and then provide discussion of the actors involved, and relations and networks they form using “ARA point of view” as mentioned in section 2.1. In addition, we also evaluate business models used by these actors in the “taxonomy point of view”, where we analyze their distribution, service and revenue models.
4.1.
Industrial landscape
The digital music services have caused the revolution in the music industry, and it is obvious that the compact disk (CD) has been the largest revenue stream for the industry for more than two decades. This industry has also faced a shift from the physical to the OTT digital distribution era, since the debut of the OTT retail store a decade ago. It extends the music business models and reaches out to more users across the globe. This makes the music as the first media sector that gets full impact from the Internet and technology-empowered forces.
Nowadays, people do not need to purchase CD to enjoy the music, because the available OTT services allow them to immediately and legally download or stream the music stored in the cloud. According to IFPI6, there has been a consistent rapid increase in the digital music revenue worldwide since 2004 and its percentage over the overall revenue keeps expanding, as shown in Figure 5. This number has far away passed physical format, and made digital penetration in music industry dwarfed all comparable creative industries, except game sector.
Figure 5. Digital music revenue and its percentage share over total revenue worldwide6
However, digital music business internationally is not a homogenous, but consists of various service model portfolios that run at different speeds. Therefore, there would be no single business development road map applicable in all markets, due to the uniqueness and enormous interaction preferences in the way user in each territory consumes music. This is either due to the differences in economic situation, network connectivity, device penetration, digital development, etc. In addition, the obstacles across countries are also not just the piracy levels and low law enforcements, but also different publishing right mechanisms, user’s preference stages of online payment, etc.
4.2.
Actors, Relations, and Networks
Before we are able to analyze the network value of the music industry with others, it is important to identify the main actors inside this industry and to get an understanding of their
roles. We then analyze these actors’ relations, from traditional era to the recent phenomena. First, we identify the prominent relations in the digital music industry that have run or are running worldwide. Second, we observe these patterns and model it using ARA point of view [7].
4.2.1
Actors
Despite the dramatic changes in the industry’s landscape, the majority of the actors in the music industry still fulfill their traditional roles [48], as mentioned below.
1. Artist
The term of artist in the music industry covers several parties, which are the recording singer and/or musician, composer, and songwriter. The recording singer is an artist that delivers the recorded music and/or stages the performance. The composer is an artist that writes the music sheet, while the songwriter is one who writes the music lyrics. Some of the artists in music producing industry might hold several roles. A common example is an artist who both works as a singer and songwriter, which makes him/her hold multi-properties for the copyright works. 2. Publisher and Record label
These parties are concerned with the development, protection and valuing the copyright works. The publisher works with the artist based on the publishing contract. It handles the copyright registration, promotes, and monitors the usage of it, and then collects and distributes the royalties of the copyright work as written forms (music sheet, lyrics). The record label works with the artist based on the recording contract, where its main responsibility is in the production and enforcement of the copyright works as recorded forms (sound recording). These actors and the artist act as the content owners who hold the copyright works.
There are currently around 1400 music record labels and publishers worldwide [56], which can be grouped into two types as below:
• Major record labels
These big record labels are often as an umbrella organization (record/music group), and control ~ 75 % of the worldwide music market [48]. They also may consist of several subsidiary companies, such as the music publishers, record manufacturers, and distributors. • Independent record labels (Indies)
The music publisher and record label company, which do not have a corporate backer, might form business relationships with other companies to handle full tasks. However, since in the 1990s, the line between Indies and major record label has begun to blur, as the major record labels sometime also distribute some works of the large Indies as well. 3. Collecting society
The collecting society (copyright collective, copyright collecting agency, licensing agency) is an organization that handles management rights on behalf of its members (publisher and artist). These management rights might include selling non-exclusive licenses, enforcing rights and prohibit the use of copyrighted works, collecting royalty payment and distributing it to the content owners, negotiating license fees for public performance and reproduction, etc. In other words, this organization acts as a point of contact for licensing music from its members, to avoid cumbersomeness for the third party to navigate multitude of independent rights holders.
In some countries, there may be also the collecting society that focuses on functions that are more specific. Some common examples are the collecting society that grants license for performing the work (Performance rights organization / PRO), and collecting society that focuses on publishing management (Reproduction Rights organization / RRO). Indeed, according to the finding in [5], we can classify this actor as the content integrator, as they integrate the copyright works and bridge the content owners, which are mostly the Indies, to the third parties.
4. Content aggregator
The content aggregator is an organization that supplies and aggregates the music from the record label (mainly Indies record label) and distributes it to the music retailer and/or service provider. There are aggregators that offer direct-to-fan integration services (merchandise, event management, etc). In addition, some might also supply download services to other aggregators/distributor and act as a music retailer/service provider directly to the end-user. This is consistent with the finding in [5] that also mentioned a same role in mobile service provisioning.
5. Music retailer and service provider
These actors are at the end of the supply chain line that holds range of licensed copyright works in various formats for distribution to other or to be sold in their own platform. There are currently ~ 520 legitimate digital music Retailers and Service providers worldwide, ranging in 58 countries [58]. The music retailer provides the music as a product, e.g. CD or downloadable track, or any physical packages that contain music. The music service provider provides the music as a service or any act that convey the music. Some parties provide music as product and service, which makes them as both music retailer and service provider, e.g. Spotify.
4.2.2
Value Network of the Core Actors
As same as what have been discussed in the actors’ role previously, the core actors of the music industry’s relation (“Core partnership”) also do not change dramatically. As far as we can identify, their “core network” exist in every models that we discuss further. Meanwhile, the variation happens outside this network “box”. The core actors of the music industry and their relations can be visualized as shown in Figure 6.
Figure 6. Conceptual actors and relations of the music industry’s core network
When a music artist wants to distribute its artwork, it is quite frequent that they have to deal with separate parties, which are the record label and publisher, through at least two basic contracts to each of them: the Recording contract and Publishing contract respectively. The music artist whose role is a songwriter mainly deals with the publisher, e.g. for the music composition, lyric sheet, etc. The publisher then, on behalf of the songwriter’s, brings that artwork to the record label in order to be used by the singer.
Meanwhile, a music artist that has a role as the singer, mainly deals with the record label, e.g. for the music recording. The record label, on behalf of the singer, contacts the publisher for the music material that is suitable for this singer. Both the publisher and record label deal with the collecting society, which is mainly settled per country-based, that then acts on their
Other Actor(s)
Core music actors’ network box
Publisher
Collecting Society Content Aggregator
Artist
Indies Record label Major Record label
behalf to collect the royalties for the usage of their artist’s work from the aggregator. The Aggregator acts as a point of contact for the distribution of that work to the music retailer / service provider.
However, following the development in the technology and decreasing in the revenue, there are several exceptions from the default strategy and working relation mentioned above [63]. This is mainly applied to the Indies environment, as the major record label uses to have a complete capability to fulfill these scoops by themselves. They merge the publisher’s and record label’s traditional roles, and turn as the “music company” by setting up compact all in one deal with the artist (“360-degree” / “multiple-rights” agreement). While in return, the artist gets more shares, compared with having separate deals with different actors (publisher and record label).
4.2.3
Value Network in OTT Distribution
In the traditional era, there is only the music retailer that the core actors of the music industry deal with. The music retailer distributes the copyright works to the end-user as a physical product (e.g. phonograph record, cassette, CD, etc). Then since a decade ago, the music business mainly run under the OTT channel, where it is distributed using several packaging models, as discussed later in section 4.2. This then expands and actors from different fields are involved in the ecosystem. This evolution forms diversification to the music industry’s business model, brings music closer to consumer, and becomes the key route to the global mass-market music distribution.
4.2.3.1 “Direct-To-Fan” Model
During the early digital music business, the record labels also rolled out their own digital retail channel. They act as the OTT music retail / service provider, under their own or artist’s brand [64][65]. Their offerings range in variances of product (e.g. track and album, merchandise, performance ticket, artist interview, etc) [90]. Some record labels also turn their channels as an advertisement platform for the brand partners. The decrease in the traditional advertising forms, makes the music industry offers a better opportunity for the international brands to reach their end-user. The actors and their relations in this network are visualized in Figure 7.
Figure 7. Actors and relations of “Direct-To-Fan” in the digital music
4.2.3.2 Telecom Actor’s Potential Positions
A. “Point-To-Point” Model
The earlier relation variance under this model was struck worldwide around 2001, started first by the collaboration between music industry actors with Internet industry actors. Despite various variances and complex ecosystem, the relation under this model requires “external” actor partners to build their own distribution platform, positions themselves at the end of the Value chain. Meanwhile, core actors of the music industry act as suppliers at the back-end, as same as in the traditional distribution era. The Figure 8 shows the typical actors and their relations in the digital music industry using the point-to-point model.
Core music actors
network box Brand Partner
The end-‐user enggament line
Customer
![Figure 1. Data tsunami trend by various researches [53]](https://thumb-eu.123doks.com/thumbv2/5dokorg/5454870.141482/10.892.165.725.431.764/figure-data-tsunami-trend-by-various-researches.webp)
![Figure 2. Business model concept hierarchy [1]](https://thumb-eu.123doks.com/thumbv2/5dokorg/5454870.141482/13.892.137.758.447.803/figure-business-model-concept-hierarchy.webp)
![Figure 4. The Unified theory of acceptance and use of technology (UTAUT) [33]](https://thumb-eu.123doks.com/thumbv2/5dokorg/5454870.141482/15.892.136.787.898.1114/figure-unified-theory-acceptance-use-technology-utaut.webp)


![Figure 10. Revenue stream share from the digital music [68]](https://thumb-eu.123doks.com/thumbv2/5dokorg/5454870.141482/29.892.205.692.527.749/figure-revenue-stream-share-digital-music.webp)
