www.vti.se/publications
Farhad Salour Sigurdur Erlingsson
Impact of groundwater level on the mechanical
response of a flexible pavement structure
A case study at the Torpsbruk test section
along county road 126 using
a Falling Weight Deflectometer
VTI rapport 808A Published 2014
Publisher: Publication:
VTI rapport 808A
Published: 2014 Projectcode: 60961 Dnr: 2009/0664-29
SE-581 95 Linköping Sweden Project:
Reinforcement of frost/thaw damaged roads – development of technical solutions
Author: Sponsor:
Farhad Salour and Sigurdur Erlingsson The Swedish Transport Administration
Title:
Impact of groundwater level on the mechanical response of a flexible pavement structure – A case study at the Torpsbruk test section along county road 126 using a Falling Weight Deflectometer.
Abstract
Excess moisture presence in pavement unbound layers can result in lower structural stiffness and reduce the service life of road systems. A field study was conducted along the county road 126 near Torpsbruk to investigate the effect of the moisture content on the bearing capacity of a flexible pavement structure and its unbound layers stiffness.
The subsurface drainage system of the test road was clogged during a three-month period in summer 2010, raising the groundwater level under pavement structure and therefore increasing the moisture content of the pavement unbound layers. During this period, the groundwater level and the volumetric moisture content of the pavement was continuously monitored using the instrumentations at test site and the structural response of the pavement was evaluated by conducting frequent Falling Weight
Deflectometer (FWD) tests with multilevel loads. Using the FWD data, the unbound layers stiffness were backcalculated and their sensitivity to the moisture content and load level were studied.
The field measurements showed that the groundwater level can significantly affect the moisture condition of the unbound layers and therefore their stiffness. Both the unbound granular layer and the subgrade showed stress dependent behavior to multilevel FWD loads.
Keywords:
pavement structure, groundwater level, bearing capacity, moisture content, Falling Weight Deflectometer (FWD)
Utgivare: Publikation:
VTI rapport 808A
Utgivningsår: 2014 Projektnummer: 60961 Dnr: 2009/0664-29 581 95 Linköping Projektnamn:
Förstärkningsåtgärder av tjälskadade vägar – utveckling av tekniska lösningar
Författare: Uppdragsgivare:
Farhad Salour och Sigurdur Erlingsson Trafikverket
Titel:
Påverkan av grundvattennivån på den mekanistiska responsen av en vägkonstruktion – En studie på provväg Torpsbruk på länsväg 126 med fallviktsmätningar.
Referat
Ökad fuktkvot i vägars obundna lager kan inverka på vägkonstruktionens strukturella styvhet och minska dess livslängd. En fältstudie gjordes längs riksväg 126 nära Torpsbruk för att undersöka de obundna lagrens fuktkvoter på vägkonstruktionens strukturella respons och styvhet.
Vägkonstruktionens dräneringssystem täpptes till under tre månader under sommaren 2010.
Tilltäppningen av dräneringssystemet resulterade i en snabb höjning av grundvattennivån, samtidigt ökade de obundna lagrens fuktkvot. Under studieförloppet har grundvattennivåns läge och fuktkvoten i vägkonstruktionens obundna lager mätts kontinuerligt med hjälp av fältinstrumenteringar. Dessutom gjordes frekventa fallviktsmätningar med tre lastnivåer för att mäta konstruktionens strukturella respons. På så sätt kunde lastnivåns och fuktkvotens inverkan på de obundna lagrens beteende studeras med målsättningen att bestämma egenskaperna hos de obundna materialen genom bakberäkning av fallviktmätningsdata.
Enligt bakberäkningarna resulterade konstruktionens fuktökning till en betydande reducering av de obundna lagrens styvhet. Det observerades dessutom att de obundna lagren visade ett spänningsberoende beteende under de olika lastnivåerna vid fallviktsmättningarna.
Nyckelord:
vägkonstruktion, grundvattennivå, bärighet, vattenhalt, fallviktsmätare
Preface
This study was performed at the Swedish National Road and Transport Research Institute (VTI) in Linköping, Sweden and sponsored by the Swedish Transport Administration (Trafikverket). The support of the Swedish Transport Administration in preparing this report is gratefully acknowledged.
Linköping, December 2013
Quality review
A review seminar was held on 11 October 2013 with Safwat Said, Peter Dittlau and Jesper Elsander where Safwat Said was the presenter. Farhad Salour has made alterations to the final manuscript of the report. The VTI research director Björn Kalman examined and approved the report for publication on 7 January 2014.
Kvalitetsgranskning
Granskningsseminarium genomfört 11 oktober 2013 med Safwat Said, Peter Dittlau och Jesper Elsander där Safwat Said var lektör. Farhad Salour har genomfört justeringar av slutligt rapportmanus. Projektledarens närmaste chef Björn Kalman, har därefter granskat och
godkänt publikationen för publicering 7 januari 2014.
Table of contents
Summary ... 5
Sammanfattning ... 7
1 Introduction ... 9
2 Test site background ... 11
2.1 Pavement structure ... 15
2.2 Test site instrumentation ... 15
3 Testing program and procedure ... 18
4 FWD measurements ... 21
5 Measured data and analysis ... 24
5.1 Deflection basin indices ... 25
5.2 Time history and dissipated work analyses ... 30
5.3 Stress sensitivity of the unbound materials ... 33
6 Layer moduli backcalculation ... 35
6.1 Backcalculation algorithm ... 35
6.2 Nonlinear constitutive model ... 39
6.3 Nonlinear parameter backcalculation ... 39
7 Groundwater influence on the pavement performance ... 44
8 Findings and conclusions ... 45
Acknowledgements ... 47
Impact of groundwater level on the mechanical response of a flexible pavement structure – A case study at the Torpsbruk test section along county road 126 using Falling Weight Deflectometer.
by Farhad Salour and Sigurdur Erlingsson
VTI (Swedish National Road and Transport Research Institute) SE-581 95 Linköping Sweden
Summary
The test section along county road 126 in Torpsbruk is equipped with subsurface drainage systems on both sides of the pavement structure – a plastic filter drain (Trammel) – fabricated along with the construction of the road in 1985. The main purpose for using this type of drainage system was to drain the highly moist ground at the site, which had become a major hindrance in the construction of the road section.
Since the opening of the road to traffic in late 1985, the Swedish Transport Administration has carried out ongoing maintenance along county road 126 near Torpsbruk to deal with pavement distresses in the form of low bearing capacity, formation of potholes, extensive rutting and cracking. These problems seemed to be associated with the presence of high moisture content in the unbound layers, in addition to other factors such as poor construction materials and heavy traffic.
In 2010, a field study was carried out at this road section to investigate the influence of groundwater level and unbound layers moisture content on the mechanical response of the pavement structure. The drainage system of the structure was clogged during a three-month period, allowing the groundwater level to rise and the structure to undergo high moisture conditions. Thereafter the drainage was reopened, allowing the structure to approach its previous hydrological draining state.
Along with the continuous subsurface groundwater level and moisture content monitoring, the structural response of the pavement was studied by conducting frequent Falling Weight Deflectometer (FWD) tests with multilevel loads. The stress sensitivity of the unbound layers and the influence of moisture on their stiffness were studied using the FWD data in an effort to determine the unbound materials nonlinear parameters through a backcalculation algorithm. Clogging of the drainage system resulted in a rapid groundwater level rise under the pavement which significantly affected the overall stiffness of the pavement structure. As the drainage system became clogged, the moisture content measured in the unbound layers also showed a rapid increase. The increase in the moisture content of the unbound layers resulted in a considerable decrease in the stiffness of the unbound layers that was backcalculated from the FWD data.
It was further observed that the unbound layers exhibited stress-dependent behaviour in response to multilevel loads. The subgrade showed a stress-softening response in the unsaturated condition and stress-independent behaviour in the saturated state. The granular layer exhibited stress-hardening behaviour during all the measurements. Using the FWD data, series of nonlinear parameters were backcalculated for both the granular layer and the
subgrade soil at different moisture conditions. The effect of in situ moisture content variations on these parameters were further investigated.
Påverkan av grundvattennivån på den mekanistiska responsen av en vägkonstruktion – En studie på provväg Torpsbruk på länsväg 126 med fallviktsmätningar.
av Farhad Salour och Sigurdur Erlingsson
VTI (Statens väg- och transportforskningsinstitut) 581 95 Linköping
Sammanfattning
Längs riksväg 126 nära Torpsbruk i Småland byggdes 1985 en vägsträcka med djupdränering på bägge sidor i dikesbotten. Djupdräneringen bestod av en filtertrumma av perforerad plast. Huvudsyftet med djupdräneringen var att dränera det fuktiga området som vägen gick igenom och som hade orsakat bärighetsproblem vid konstruktionen av vägöverbyggnaden.
Efter att vägen togs i bruk 1985 har vägsträckan krävt mer omfattande underhåll jämfört med en vanlig väg på grund av dålig bärighet, slaghål samt relativt snabb spårutveckling och sprickighet. Dessa problem verkar vara associerade med den höga fuktkvoten, väg-konstruktionens obundna material samt möjligen bristfälliga konstruktionsmaterial i kombination med tung trafik.
År 2010 gjordes en fältstudie om hur grundvattenytans läge samt fuktkvotsändringar i de obundna lagren påverkade vägkonstruktionens respons. Vägkonstruktionens dräneringssystem tilltäpptes då under tre månader med en höjning av grundvattennivån som konsekvens samt att fuktkvoten i de obundna lagren ökade. Därefter öppnades dräneringssystemet och strukturen tilläts återgå till sitt ursprungliga hydrauliska jämnviktsläge.
Under förloppet utfördes kontinuerligt mätningar av grundvattennivåns läge och av fuktkvoten i de obundna lagren i vägkonstruktionens överbyggnad. Dessutom gjordes frekventa fallviktsmätningar med tre lastnivåer på vägytan för att mäta konstruktionens strukturella respons. På så sätt kunde lastnivåns och fuktkvotens inverkan på de obundna lagrens beteende studeras med målsättningen att bestämma egenskaperna hos de obundna materialen genom en bakberäkningsprocess.
Tilltäppningen av dräneringssystemet resulterade i en snabb höjning av grundvattennivån, samtidigt ökade de obundna lagrens fuktkvot. Detta hade i sin tur en stor inverkan på
vägkonstruktionens strukturella respons. Enligt bakberäkningarna resulterade konstruktionens fuktökning i en betydande nedsättning av de obundna lagrens styvhet.
Det observerades dessutom att de obundna lagren visade ett spänningsberoende beteende under de olika lastnivåerna. Terassmaterialet uppförde sig som ett spänningsmjuknande material under dränerade förhållanden men visade sig vara spänningsoberoende under
odränerade förhållanden. De obundna lagren (bärlager och förstärkningslager) visade däremot ett spänningshårdnande beteende under hela försöket.
Data från fallviktsmätningar användes för att bakberäkna de parametrar som användes för styvhetsmodellerna för både de obundna granulära materialen och för terrassmaterialen med varierande vattenkvot. Ytterligare undersöktes känsligheten av parametrarna på
styvhetsmodellen med varierande fukthalt för både de obundna granulära materialen och det vattenomättade terrassmaterialet.
1
Introduction
It is generally recognized in pavement engineering that excess moisture in pavement layers with moisture-susceptible materials, when combined with heavy traffic loading, can reduce the service life of the roads. In unbound pavement materials, prolonged exposure to excess moisture results in moisture-accelerated distresses. These distresses are primarily initiated by factors other than moisture (e.g. traffic loading) but whose rate of deterioration is accelerated when accompanied by the presence of moisture. Prolonged exposure to excess moisture may lead to low subgrade bearing capacity, reduction in stiffness of unbound granular layers, degradation of material quality and loss of bonding between the pavement layers.
Moisture exchange between the pavement structure and the environment may occur through precipitation infiltrations through surface cracks and the embankments or from beneath due to capillary suction and a high groundwater table. The water flow pattern and moisture
movement profiles in pavement structures are rather complex and are coupled to a number of different physical phenomena such as heat transfer. Studies on understanding and quantifying moisture transfer in pavement layers have been limited. A number of numerical simulation studies were performed, investigating the applicability of hydrological theories and methods in modeling the road and environment system interactions. Hansson (2005) investigated the flow pattern in the road profile generated by surface runoff and infiltration through cracks and the embankments.
Furthermore, in pavement structures subjected to frost penetration or freeze-thaw cycles (including large part of the road network in Nordic countries) water related distresses become major issues (Saarenketo and Aho, 2005). High excess water and moisture content in unbound pavement layers is generally observed as the water accumulated within the structure during the freezing period converts back into the liquid phase during the thawing period. This usually accelerates the accumulated pavement damage during the spring thaw period.
The detrimental effect of moisture on the resilient and permanent deformation properties of pavement materials and subgrade soils has been investigated in a number of studies during the recent decade (Lekarp et al., 2000; Yuan and Nazarian, 2003; Erlingsson, 2010; Cary and Zapata, 2011). These studies have shown that moisture is a fundamental parameter in pavement martial behaviour which significantly affects the long term performance of the pavements.
Recent advances in measurement techniques have assisted in real-time tracing of the subsurface environmental factors flow in pavement systems (Erlingsson et al., 2009). Field instrumentation and continuous in situ monitoring of subsurface moisture and temperature variations in pavement systems have been performed successfully (Janoo and Shepherd, 2000). These data can be used to validate and calibrate analytical models and response variables. Although the significant influence of moisture on the properties of unbound pavement materials is well recognized, due to its complexity, pavement design codes do not explicitly account for moisture transfer. In practice, the effect of moisture content is taken into account through environmental adjustment factors in a coefficient that is multiplied by the elastic modulus of unbound layers as a function of position and time.
A major design consideration in flexible pavement infrastructure design is to keep the base and subbase granular layers and subgrade material from being exposed to prolonged high moisture levels. In practice, approaches employed to reduce the undesirable effect of excess moisture presence in pavement structures are to incorporate design features to minimize moisture entering the system, quickly removing the moisture that has entered the system, and using less moisture-insensitive materials. An adequate pavement drainage system can
effectively reduce any potentially detrimental effects of water. Surface and subsurface drainage is an important factor for long-term pavement performance of road networks exposed to environments with a high groundwater level, high precipitation, frequent freeze-thaw cycles and a poor subgrade condition. Application of subsurface drainage has gained popularity among road authorities over the past decades, which routinely require modern drainable systems to reduce moisture related issues.
A common construction practice to obstruct water from getting into the pavement foundation is the use of longitudinal ditches and trenches, occasionally filled with highly permeable material with perforated collecting pipes at the bottom. Alternatively, prefabricated geo-composite edge drains can be used. This drainage system in principle consist of a synthetic polymer core surrounded by a membrane or geotextile filter that can collect and direct any groundwater and/or surface water into a traditional drainage system
(Bäckman, 1986). In this system, the core acts as a water channel while the membranes prevent the ingress of soil and clay particles, eliminate blockages of the system and enhance filtration. The main functions of these drainage systems are to lower the water table and therefore the capillary moisture in the pavement system and to intercept percolating water. It is worth mentioning that the application of deep subsurface drainage and groundwater drainage is rather recent and only a limited amount of performance data are available from sections incorporating these types of drainage systems. Therefore, the sensitivity of the pavement distresses to drainage considerations is restricted to available performance data. Additional work regarding analyses, evaluation, reliability and effect of positive drainage on pavement performance and its life cycle is needed in order for their use to be recommended with confidence.
In order to better understand the effect of environmental factors in pavement performance and structural response, a test section along the county road 126 near Torpsbruk in Southern Sweden was instrumented in 2009. The reason for selecting this section was that it passes through a region with highly moist ground conditions near Torpsbruk and that part of road in this section was built with a subsurface drainage system. The drainage system was built during the construction of the road in 1985 for research purposes (Bäckman, 1986). This unique condition of this road section makes it interesting for pavement in situ studies with respect to environmental factors.
The efficiency and long-term performance of the subsurface drainage system at Torpsbruk test site in controlling the groundwater level and subsurface moisture condition was studied in a VTI report by Hansson et al. (2012). Concomitantly, the effect of moisture content on the structural response and performance of the pavement structure and the unbound layer
materials was studied and the results presented here. The structural response of the pavement was investigated using frequent Falling Weight Deflectometer (FWD) measurements with multi-level loads throughout the study period. Measurements indicated that the response of pavement moisture to drainage condition was very quick. In situ measurements revealed the effective contribution of a well-designed drainage system in controlling the moisture
condition in the pavement system and its importance in maintaining the bearing capacity of the pavement structure.
This report presents the collected pavement environmental data, measured deflections and the performed analysis. Furthermore, the stress dependent behaviour of the unbound layers and the feasibility of backcalculating their nonlinear parameters from the deflection basin were also studied. The pronounced influence of the moisture content on the stiffness properties of the unbound layers and the pavement structure is demonstrated.
2
Test site background
County road 126 is a two-lane two-directional rural road located in the southern part of Sweden (Figure 1). The earthwork of this road section was done in spring 1985 and the section was opened to traffic later in November in the same year. During the earthwork and construction of the substructure, major difficulties were faced which were related to the relatively moist ground condition near Torpsbruk (Figure 2). The wet ground condition with low bearing capacity subgrade prolonged the construction period of the superstructure. Part of the road (the test section) lies on the eastern side of a relatively elevated area where the potential downward flow of the groundwater can pass under the road path (see Figure 3, top). Field investigations prior to and during the construction showed that the road corridor has a high groundwater level (nearly at the natural ground surface), underscoring the presence of water uplift from the elevated area (Bäckman, 1986).
Over the years, the Swedish Transport Administration has carried out ongoing maintenance and rehabilitation work to deal with the fast distress developments in the form of cracking, rutting and low bearing capacity along this road near the Torpsbruk. For instance, in a measurement carried out near the test section, rut development of 30-35 mm was observed over a three - year service period. This measurement was done in 2008 which was only after three years of the new overlay construction that was carried out in 2005 (Hansson et al., 2012). The continuous deterioration along this road has evidently been due to prolonged exposure to the high water content in the pavement system in combination with freeze-thaw cycles and poor construction materials.
Along with the construction of the road, in order to reduce the groundwater level and accelerate the drying of the natural ground for overlay construction, a research project was planned at VTI (Bäckman, 1986). An approximately 250 m long stretch of the road section was equipped with a subsurface drainage system during the summer of 1985 (Figure 3). The drainage system consisted of a synthetic polymer core surrounded by geotextile filters with perforated collective pipes at the bottom. The drainage sheets were installed approximately one meter below the bottom of the road ditches on both sides of the road. The groundwater table level was measured using 10 wells on both sides and the middle of the road section. More details on the drainage installation and field measurements are reported in the VTI report 478 by Bäckman (1986). After the installation of the drainage system, the groundwater table was successfully lowered around this stretch of the road. The drainage systems were thereafter left without any maintenance until October 2008 when the drainage collector pipes were cleaned using hydrojet flush and the test section was further instrumented for a new research project at VTI (Hansson et al., 2012).
In the last few years, a number of research projects on spring-thaw weakening and drainage performance were initiated at VTI related to this test section (Salour & Erlingsson 2013a; Salour & Erlingsson, 2013b). Subsequently, in 2009, the section was equipped with four moisture content and several groundwater level measurement rods with manual and automatic data logging. These arrangements could register variations in the moisture content and
groundwater table level in the unbound layers in real-time. Moreover, the section has also been equipped with a frost rod by the Swedish Transport Administration. A detailed description of the site instrumentation is further discussed in this document.
Figure 1 Location of the test site near Torpsbruk in the province of Småland in Sweden (Left), Overview of the Lv126 county road (Right), (Geographical coordinates: 57.047600,
14.566020). (Photo from Farhad Salour)
Figure 2 Rehabilitation of a section along county road 126 near Torpsbruk in 2012. Note the moist ground condition in the section. (Photos from Lars-Göran Svensson)
SWEDEN Stockholm Gothenburg Malmo Torpsbruk (Test Location)
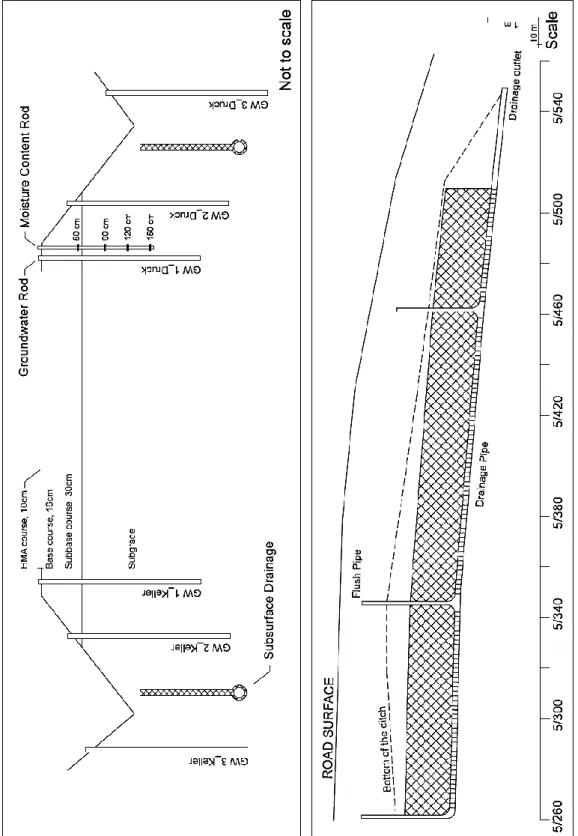
Figure 3 Plan v iew of the te st s it e w it h de ep -drai nage sy stem ne ar T orpsbr uk ( modifi ed aft er Bäc km an, 1986) . (G eographi cal c oordi nates: 57.047600, 14.566020) .
Figure 4 C ross s ec ti on of t he test road at T orpsbr uk ( top ). L ongit udinal prof il e of t he drai nage sy stem along t he w estern si de ( bott om ), (modifi ed aft er Bäc kman, 1986 ).
2.1
Pavement structure
The test section along county road 126 is nearly 300 m long with a typical three layer flexible pavement structure that consists of a 100 mm Hot Mix Asphalt (HMA,ABT16 160/220) layer, 160 mm crushed gravel base layer and 300 mm natural sandy gravel subbase layer resting on a silty sand subgrade (Figures 1to 4). Along the test section, the natural ground has a moraine formation with silty sand classification in depth (Bäckman, 1986). The HMA bound layer and the overlay wearing course were of a dense graded mix with 16 mm
maximum grain size. Using FWD data, an approximate stiff layer (bedrock) is anticipated at a depth of 3 to 3.5 m in the test section. According to the geological map of the area, the
substratum consists of granite and gneiss bedrocks (Hansson et al., 2012). The grain size distribution graphs for subgrade, base and subbase materials are presented in Figure 5. The graph is based on core samples taken from the test section in spring 2012.
Figure 5 Grain-size distribution of the pavement material along county road 126 near Torpsbruk.
2.2
Test site instrumentation
The test site instrumentation and field data acquisition consisted of groundwater level measurements (with both manual and automatic data logging), pavement subsurface volumetric moisture content measurements (with automatic data logging), frost depth
measurement rod and FWD surface deflection measurements. Figure 6 illustrates a schematic overview and positioning of the instrumentation at the test section.
Figure 6 Schematic overview of the pavement instrumentation along county road 126 near Torpsbruk (GW: groundwater level probes, MC: volumetric moisture content probes).
In total, 22 groundwater measurement wells existed in the vicinity of the section (16 with manual and 6 with automatic data logging). The groundwater measurement bores with manual data logging were spread around the test section area to provide a general overview of the groundwater level in the surrounding region.
The groundwater level bores with automatic data logging system were installed across the road profile, measuring the groundwater changes in real time (indicated with ‘GW’ in Figure 6). Two different data logging sensor brands, with separate data collection systems were used at each side of the road section. The measurements on the eastern side of the road were done using the Druck sensors and the measurements on the western side of the road were done using the Keller sensors. Both the Keller and Druck systems were identical in principle and consisted of pressure cell sensors mounted in PVC pipes.
The volumetric moisture measurement rods were installed only on the eastern side of the road. They consisted of four rods, each consisting of four high frequency domain (capacitance) sensors installed at four different depths (indicated with ‘MC’ in Figure 6). They measured the volumetric moisture content of their surrounding environment using the time domain reflectometry technique. The moisture sensors were of the EnviroSMART ™ model produced by Campbell Scientific Incorporation. Three of the rods were installed along the unpaved shoulder of the road and one in the pavement embankment toward the ditch. Readings were recorded automatically every 30 minutes using a data logging and storage device. From the three moisture rods that were installed along the shoulder of the road, one malfunctioned eventually due to water penetration into the PVC tube. Therefore, measurements from the remaining two moisture rods along the pavement edge were used in this study. It was assumed that measurements from the sensors along these moistures rods could represent the moisture condition of the pavement structure.
GW: groundwater probes MC: moisture content probes
In this report, moisture measurements from two of the moisture rods that were still in service when this study was performed (summer 2011) were used. These moisture rods were the ones along the unpaved shoulder of the pavement and each consisted of four probes that measured volumetric moisture content of the pavement profiles at different depths. Moisture probes along these moisture rods were installed at 0.50 m (bottom of the subbase), 0.90, 1.20 and 1.50 m (subgrade) depths (Figure 6).
The subsurface temperature profile of the road section was measured by the frost rod, Tjäl2004, developed at VTI (Wilhelmson et al., 2004). Tjäl2004 consists of a series of temperature sensors along a metal rod placed in a casing which registered data every four hours at 5 cm intervals throughout the pavement profile down to a depth of 2 m.
The pavement structural response was measured using a KUAB 50 Falling Weight
Deflectometer. The KUAB FWD is a trailer-mounted device. It produces an impulse force that simulates the actual effects of a moving vehicle using a combined two-mass configuration and buffer system. The segmented load plate in this device produces a uniform pressure distribution over the full area of the loading plate. The deflections are measured using seven accelerometers at 0, 200, 300, 450, 600, 900 and 1200 mm from centre of the loading plate which was150 mm in radius (http://www.erikuab.com/).
3
Testing program and procedure
Evaluation of the drainage system in controlling the groundwater table level and reducing the moisture content of unbound pavement materials was studied. Furthermore, the effect of the moisture content of the unbound layers on the mechanical response of the pavement structure was evaluated by conducting frequent Falling Weight Deflectometer measurements with multilevel loading.
In order to allow for estimating the influence of moisture in pavement response and the unbound layers, the water condition of the pavement was changed by manipulating the subsurface drainage system. The drainage outlets were manually clogged during a
three-month period in summer 2011, allowing the water table to rise and the unbound layers to undergo high moisture conditions. Thereafter the drainage outlets were unclogged, allowing the structure to regain its previous draining hydrological condition.
The pavement response was evaluated during the “draining”, “non-draining” and “transition” conditions. The “draining” condition was the period in which the drainage system was fully functioning. The “non-draining” condition was when the outlets were clogged and therefore the drainage was not functioning. The “transition” condition was the changeover period between these two conditions. The mechanical response of the pavement structure under these conditions was evaluated by conducting frequent Falling Weight Deflectometer (FWD) testing with multilevel loads.
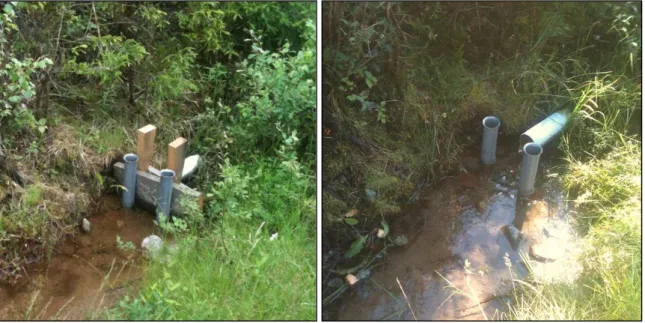
The pavement moisture condition was continuously monitored by on-site instrumentation throughout the study period. The drainage outlets on both sides of the road were clogged on June 7, using plastic capping supported by wooden wedges (Figure 7). The pavement was kept in this condition for more than three months. Thereafter, the drainage pipes were
unclogged on September 15, allowing the pavement to recover to its normal draining conditions.
Figure 7 Drainage pipes clogged on June 7, 2011 (Left). Drainage pipes unclogged on September 15, 2011. (Photos from Mikael Bladlund)
Figure 8 shows the groundwater level measured before clogging, during clogging and after unclogging the drainage pipes. The measurements were from the six groundwater probes with
automatic data loggers that were installed along the transverse direction of the test section. Before clogging the drainage system, the groundwater table was approximately 2.5 m below the surface of the pavement structure. Blockage of the drainage system (June 7, 2011) increased the groundwater level nearly 1.5 m in total over the clogged drainage period. Just before unclogging the drainage pipes, the groundwater level was nearly 1.0 m below the road surface.
It can be observed from Figure 8 that the groundwater level increased sharply after the
drainage clogging. Within a few days after clogging the drainage pipes, the sensors registered a 1.0 m increase in the groundwater table level. Thereafter a more gradual increase in the groundwater level was observed during the clogged drainage period.
After reopening the drainage system (September 15, 2011), all of the groundwater probes registered an immediate drop in the groundwater level (within a few hours). The groundwater level then flattened out until reaching the pre-clogging levels.
Figure 8 Variation of the groundwater table in pavement profile due to drainage clogging of county road 126 near Torpsbruk.
The variation of groundwater table level together with the accumulated precipitation is shown in Figure 9. Rainfall intensity and the accumulated precipitation during the study period are shown in Figure 10. The data presented in figures 9 and 10 reveal that the rain events had a direct and rapid impact on the groundwater table in the vicinity of the road structure. The kinks in the groundwater level measurements presented in Figure 10 were in direct correspondence to the precipitation events during this period.
Figure 9 Groundwater level measured from probes across the test road section and accumulated precipitation from SMHI weather station near Torpsbruk (modified after Hansson et al. 2012).
Figure 10 Precipitation measured from SMHI weather station in Moheda (Hansson et al. 2012).
4
FWD
measurements
The mechanical response of the pavement structure to moisture variations in the unbound layer as a result of drainage manipulation was studied using FWD testing. In total, 11 series of FWD measurements were performed during the study period. One FWD test was conducted in the pre-clogging “draining” condition (May 11), five during the “non-draining” condition (June 13 and 20, July 4, August 1 and September 14) and five after the drainage was
unclogged during the “transition” and further during the “draining” conditions (September 16, 19, 22 and October 26 and 13). Unlike the proposed plan, no FWD measurements were conducted just before the drainage clogging on June 7. However, based on the previous measurements from the road section, it is expected that the deflection basins remained quite stable and identical to the summer values at this time of the year. The HMA layer mid-depth temperature and the drainage condition during the FWD tests conducted in 2011 are
summarized in Table 1.
The FWD tests were conducted along the outer wheel path of the road and in both directions with 10 m intervals (Figure 3). Each measurement series consisted of 38 stations (19 stations in each direction). In this study, FWD data from 8 stations (4 in each direction) which were closest to the moisture probes were used. These stations were the 60, 70, 80 and 90m as illustrated in Figure 3. They were supposed to represent the structure and moisture condition of the whole test section. The first two FWD measurements (May 11 and June 13) had a slightly different setup. They consisted of 11 stations with 2 m intervals, performed only in one direction adjacent to the moisture probes.
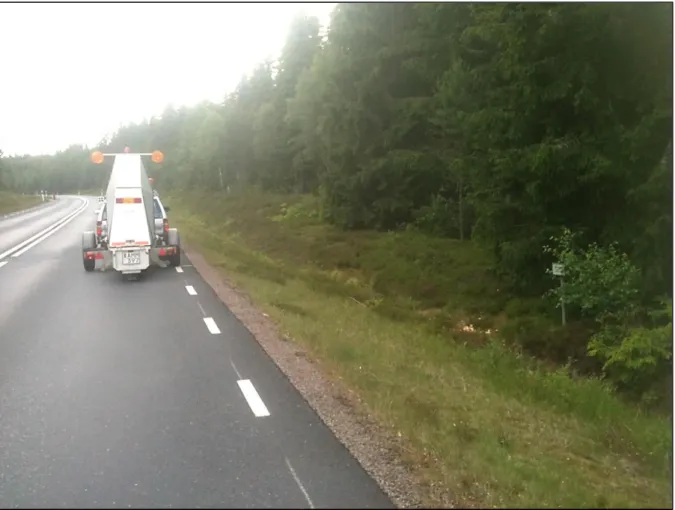
All of the FWD tests were performed at 30, 50 and 65 kN load levels. Drops at each load level were applied two times. Deflections were measured using seven accelerometers at 0, 200, 300, 450, 600, 900 and 1200 mm distance from the centre of the loading plate (15 cm in radius). Before any further analyses of the FWD data, the measured deflections were linearly adjusted to the target load level. For each load level, the average value of all the FWD stations was used as the representative deflection basin for the test section at that load level. Figure 11 shows the KUAB trailer-mounted FWD device used for this study.
Table 1 HMA layer temperature and drainage condition during the FWD tests conducted in 2011.
Date 11 May 13 Jun 20 Jun 4 Jul 1 Aug 14 Sep 16 Sep 19 Sep 22 Sep 26 Sep 13 Oct HMA Temp.
[ºC] * 33.0 32.0 29.0 22.0 29.5 17.0 15.0 17.0 16.0 16.0 9.0
Drainage
Condition Open Clogged Clogged Clogged Clogged Clogged Open Open Open Open Open
Figure 11 KUAB Falling Weigh Deflectometer testing device at the test section of county road 126 near Torpsbruk. (Photo from Mikael Bladlund)
Figure 12 shows the maximum FWD deflection (d0 or dmax) corresponding to 50 kN load pulse
along with the pavement subsurface volumetric moisture content during a six-month period in 2011. The maximum FWD deflection in this figure is the deflection measured by the
accelerometer at the centre of the loading plate. This deflection can represent the stiffness of the overall pavement structure. The moisture profile in Figure 12 is based on the volumetric moisture content that was registered by the 8 sensors from the two moisture rods used in this study.
The maximum FWD deflections shown in Figure 12 are from two different set of stations. The first set of stations was located inside the stretch with subsurface drainage system and the second set of stations was located outside the stretch with subsurface drainage system. The measurements inside the stretch with subsurface drainage system were the average maximum FWD deflection of 60, 70, 80 and 90 m stations and the measurements outside the stretch with subsurface drainage system were the average maximum FWD deflection of 170 and 180 m stations as shown in Figure 3.
Figure 12 illustrates the significant contribution of the drainage system in reducing the moisture content of the unbound layers. It further shows the impact of unbound materials moisture content on the overall stiffness of the pavement structure. During the non-draining period (clogged drainage), a maximum FWD deflection of 541 μm was measured. This was reduced to 368 μm as the drainage was unclogged and the excess was drained out from the pavement structure.
Figure 12 Subsurface moisture variation in pavement profile due to drainage clogging in county road 126 near Torpsbruk (average measurement of MC1 and MC3) and maximum FWD deflection corresponding to 50 kN load level.
5
Measured
data and analysis
The measured subsurface moisture content and the maximum FWD deflections (d0 or dmax) are presented in Figure 13. The moisture registrations shown in this figure are the average subsurface volumetric moisture measurement from moisture rods MC1 and MC3. The deflections are the average maximum FWD deflection of the 60, 70, 80 and 90 m stations along the test section corresponding to a 50 kN load pulse. As previously mentioned, the drainage collective pipes were blocked on June 7, 2011on both sides of the road until
September 15, 2011 when they were unclogged. Figure 13 shows the significance role of the drainage system in reducing the moisture content of the unbound layers in the pavement structure.
Before clogging the drainage pipes on June 7, the average volumetric moisture content in the subgrade layer was about 16%. The subgrade moisture sensors that were positioned lower in the moisture rod were expected to register higher moisture content as they were closer to the groundwater table level with higher capillary moisture presence. However, this was not observed in the measurements. This slight deviation could have been due to the initial calibration of the sensors or any possible gaps around each individual sensor that could interrupt the measurements. This difference was insignificant considering their deviations and the difficulties involved in such field measurements. However, the moisture registrations trend in the subgrade was as expected after the drainage was clogged. The sensors that were positioned lower in the moisture rod showed earlier response to drainage clogging due to the fact that the groundwater was rising from the bottom. These sensors also registered higher moisture until reaching a relatively constant level when the full saturation of the subgrade at that level had occurred (sensors at 1.20 and 1.50 m depths). The sensor at the 0.90 m depth, showed a general increasing trend throughout the clogging period with few sharp rises that were associated to the rain events. As registered by the sensor at 0.90 m depth, the upper part of the subgrade reached to near saturated state almost towards the end of the drainage
clogging. After unclogging the drainage system on September 15, all of the sensors showed reduction in the moisture content. The sensors that were positioned higher in the moisture rod responded earlier to the drainage condition. The registrations of the sensors after the
unclogging were in the expected order. Sensors that were positioned higher in the moisture rod had further distance to the groundwater table and therefore registered lower capillary moisture.
The response of the pavement moisture level to drainage condition was quite rapid. The moisture content in the lower subgrade levels (1.50 and 1.20 m depths) increased sharply after the drainage was clogged. The moisture content at the lower subgrade increased from the normal summer value of about 15% to nearly 40%. The moisture contents then remained almost steady during the whole period of the “non-draining” condition. It is very probable that the subgrade below 1.20 m reached a saturated state during the “non-draining” period (see Figure 8).
The moisture content in the upper part of the subgrade (0.90 m depth) showed a sharp rise after the drainage clogging. Thereafter, a general increasing trend in the moisture content was observed at this depth during the “non-draining” period. The sharp rise after the drainage clogging was likely due partly to the effect of the subgrade saturation at lower depths and partly due to the 25 mm of precipitation on the July 10 (Figure 10). The overall increasing trend during the “non-draining” period may have been the result of a gradual increase in the thickness of the capillary fringe zone (and/or intermediate vadose zone) with time. The increase in groundwater table level and moisture condition at lower subgrade levels affected
the capillary and intermediate vadose zones over a longer period when the pavement was in the “non-draining” condition.
As can be seen in Figure 13, disregarding the random spikes in the data (rain events),
moisture measurements at the bottom of the subbase layer showed nearly a twofold time rise due to drainage clogging. The moisture content increased from 8.0% (before clogging) to approximately 14.0% (after clogging). The recurring spikes in the moisture measurements were due to the rainfall events.
The drainage pipe outlets were then unclogged in mid-September. As can be seen in Figure 13, the moisture content in the pavement structure showed a quick response. At all the measurement depths in the subgrade (0.90, 1.20 and1.50 m) moisture content dropped off. In the lower subgrade levels (1.20 and 1.50 m depths) the moisture almost leveled off to the pre-clogging values. The same trend was observed in the upper subgrade level (0.9 m) which was followed by a steadier decline to the pre-clogging values. The slightly higher moisture values after unclogging compared to the pre-clogging values were mainly due to the overall higher moisture content in autumn compared to summer, which was also observed for measurements during the past few years.
Figure 13 The average subsurface moisture measurement from moisture rods MC1 and MC3 and maximum FWD deflection corresponding to a 50 kN load level.
5.1
Deflection basin indices
The first step in assessing the mechanical behaviour of the pavement structure using FWD measurements is to analyse the deflection basins. Deflection basin and deflection basin indices provide an overview of the pavement structural response. Variations of the deflection basin and its indices during the study period are presented in this section. The maximum deflection (D0 or Dmax), Surface Curvatures Index (SCI), Base Curvature Index (BCI) and
Base Damage Index (BDI) were the indices used (Table 2). Many authors have suggested use of these indices as a fundamental enhancement parameter for evaluation of the structural
condition of pavements and its seasonal variation (Cekerevac et al., 2009; Doré and Zubeck, 2008).
The deflection basin corresponding to a 50 kN load pulse is traditionally used for calculation of these parameters, assuming that a standard axle load of 100 kN is simulated. The
representative deflection basin was used for each FWD test date which was the averaged deflection of all the FWD stations along the study stretch on that date (60, 70, 80 and 90m stations). The choice of using a representative deflection basin for each FWD test date is based on the relatively uniform deflection basins measured along the test section. Using a representative deflection basin provides an overall indication of the whole test section condition and eliminates the possible local deviations in the measurements. It also speeds up the data analysis process.
The FWD deflection basins measured during the study period are presented in Figure 14. This figure shows the variation in the deflection basin during this period. The correlation between the measured deflection and the measured subsurface moisture condition (groundwater table level) can be seen clearly in this fashion. The deflection basin showed a considerable increase as the groundwater table level was raised and the subsurface moisture content in the unbound granular layers increased (drainage clogging). The deflection basins during the non-draining conditions are shown with dashed black lines in with the maximum measured deflection (plate load deflection) varying between 500 to 530 μm. The deflection basins after unclogging the drainage pipes are shown with dashed grey lines. The maximum deflection measured after unclogging the drainage pipes was reduced to 365 μm, measured on May 11. The deflections basins in Figure 14 are the averaged measurements of the 60, 70, 80 and 90m stations and correspond to 50 kN FWD load pulse.
Figure 14 Variations of deflection basin due to ground water level changes (based on measurements from 60, 70, 80 and 90m stations corresponding to 50 kN load pulse).
Table 2 Deflection basin indices used for structural evaluation of flexible pavements (modified from Cekerevac et al., 2009; Doré and Zubeck, 2008).
Deflection Basin Index Description
Maximum deflection d0 or dmax
Maximum deflection recorded. Indirectly proportional to the overall stiffness of an elastic half-space.
Surface Curvature Index SCI = d0 – d300
Curvature of the inner portion of the basin. Indicates the stiffness of the top part of the pavement system (base layer in thin structures).
Base Damage Index BDI = d300 – d600
Curvature of the middle part of the basin. Indicates the stiffness of the middle part of the pavement system (subbase layer in thin structures).
Base Curvature Index BCI = d600 – d900
Curvature of the outer part of the basin. Indicates the stiffness of the bottom part of the pavement system (subgrade soil).
Figure 15 shows the variation in the pavement surface deflection under the FWD loading plate (d0 or dmax) corresponding to a 50 kN load level. The maximum FWD deflection
measurement provides an indication of the global bearing capacity of the pavement system to the applied loading. The effect of the subsurface moisture condition in the overall bearing capacity of the pavement structure can be seen in this figure. During the non-draining condition, an average maximum deflection of 541 μm was measured. After unclogging the drainage pipes, the maximum deflection was reduced to as low as 368 μm (measured on October 13). This indicates a nearly 47% increase in the measured maximum deflection due to the rise in the subsurface water content.
The maximum FWD deflection measured after unclogging the drainage system was relatively lower than before clogging the drainage. This could be explained by the fact that the FWD measurement performed on May 11 was conducted while the pavement was still recovering from the spring thaw weakening. Another explanation to this could be the difference in the HMA layer temperature during the tests. During the FWD test on May 11 the HMA layer had a temperature of 33.0 ºC while this was 16.0 and 9.0 ºC during the September 26 and
October 9 tests, respectively. Moreover, the FWD station setup during the May 11 and June 13 measurements marginally varied from the rest of the measurements and, even though they were in the same stretch, minor deviations in deflection measurements could be probable.
Figure 15 Maximum deflection measured during the study period (deflections correspond to 50 kN load pulse).
The Surface Curvature Index (SCI) is the difference in the measured deflection under the centre of the loading plate and 300 mm from the centre of the loading plate. SCI is the characterizing factor representing the stiffness of the upper part of the pavement structure. In thin flexible pavement structure, SCI may represent the base layer. The SCI during the study period is plotted in Figure 16a. Clogging of the drainage system during the study period increased the SCI by 49%.
The Base Damage Index (BDI) is the difference in the measured deflection at 300 mm and 600 mm away from the centre of the loading plate. This is the curvature of the middle part of the basin and in thin pavement systems can be associated to the stiffness of the subbase layer (Cekerevac et al., 2009). The BDI index showed a 40% increase due to clogging of the drainage during the study period (Figure 16b).
The Base Curvature Index (BCI) is the difference in the measured surface deflection at 600 mm and 900 mm away from the centre of the loading plate. Since BCI is the curvature of the outer part of the basin, and is known to represent the stiffness of the subgrade layer (Doré and Zubeck, 2008). During the study period the BCI increased by 43% due to the drainage clogging and water content increase in the unbound layers (Figure 16c).
Changes in groundwater table level and subsurface moisture condition significantly affected the deflection indices (SCI, BDI and BCI). The increase in moisture in the pavement unbound layers increased the magnitude of the indices. These indices almost showed trends similar to those of the measured moisture content. It should be mentioned that even though these indices are valuable enhancement parameters for the overall evaluation of pavement structural
capacity, it is not possible to clearly distinguish the representativeness of these indices for every distinct layer. Interpretation of these parameters should be taken with additional concerns, particularly when it comes to pavements with thin structural layers.
Figure 16 Variation of Surface Curvature Index SCI (a), Base Damage Index BDI (b) and Base Curvature Index BCI (c) during the study period.
5.2
Time history and dissipated work analyses
In the FWD tests, readings of the applied load pulse and the corresponding surface deflections were registered in the data acquisition system every 0.1 ms. Using the deflection history data, it was observed that the FWD load pulse generally occurred over a 75-80 ms time period (Figure 17). It was observed that during all the measurements over the study period, the induced deflections recovered almost immediately after the load pulse reached zero. Almost no time lag was observed between the end of the load impulsion and the end of the
deflections. The pavement structure exhibited an elastic behaviour regardless of the
groundwater table variations. The elastic behaviour could be explained by the relatively thin asphalt layer of the pavement structure in which the viscous component of the bituminous surface layer was negligible compared to the general properties of the pavement structure.
Figure 17 Load and deflection history over the study period at the Torpsbruk test section.
Dissipated work is also another important parameter in determining pavement behaviour and characteristics. It is defined as the area delimitated between the loading and unloading portion of the load-deflection curve referred to as a hysteresis loop. The hysteresis loop consists of two curves in which the upper curve represents the load progression during the loading phase and the lower curve represents the load progression during the unloading phase. Using the FWD load deflection data, it is possible to measure the dissipated work for any arbitrary impact load.
It is hypothesized that the dissipated work from the FWD load deflection-time measurements can be related to flexible pavement distresses and possibly used as a key parameter in
pavement structure evaluation and rehabilitation requirements. Traditionally, research related to dissipated work emphasise the determining the properties and condition of the bituminous layer such as fatigue properties. This is usually the case for pavement with thick asphalt concrete layers in which low dissipated work is associated with a near-elastic response of the
pavement structure and high dissipated work is associated with a more viscoelastic behaviour. Studies have indicated that pavements with more distresses in magnitude and severity have greater dissipated work. A more distress type diversity was also observed on sites with higher dissipated work (von-Quintusand and Killingsworth, 1998; Rowe, 1996). However, in
pavement structures with thin bituminous layers, the dissipated work concept may also be used to investigate the pavement structural conditions such as seasonal environmental effects in the pavement unbound layers (Deblois et. al, 2010) and drainage condition.
Figure 18 Hysteresis curve for the initial deflection sensor (d0 or dmax) over the study period
by 50 kN FWD at Torpsbruk test section.
Figure 18 shows variations in the hysteresis curve for the initial deflection sensor (d0 or dmax)
over the study period corresponding to a 50 kN FWD load level. This figure presents a considerable change in the hysteresis loop dimension as the moisture condition (groundwater level) changed due to drainage manipulation in the pavement structure. An increase in the groundwater level and consequently the moisture content in unbound layers resulted in larger hysteresis loops and therefore higher dissipated work. The dissipated work measured from the loading plate deflection during the study period is presented in Figure 19. As can be observed in this figure, in thin pavement structures, the moisture condition in unbound layers can significantly affect the dissipated work level.
Figure 19 Variation of the dissipated work over the study period by 50 kN FWD at Torpsbruk test section.
5.3
Stress sensitivity of the unbound materials
Most unbound pavement materials exhibit nonlinear stress-dependent resilient modulus properties. Depending on the material gradation, degree of compaction and moisture content the modulus can either increase or decrease with increasing stress level. The common practice in understanding the nonlinear behaviour of unbound materials is the use of repeated load triaxial testing. However, the triaxial testing may not necessarily be able to reproduce the in situ conditions (Karasahinet et al., 1993). Application of FWD testing to evaluate the
pavement materials may reasonably approximate the load magnitude and the state of stresses in the pavement structure even though the results are deflection basins and the backcalculated elastic modulus (Tong and Baus, 2005).
The FWD measurements at the test section during the study period were conducted with multilevel loads (30, 50 and 65 kN). The initial intention was to investigate the probable nonlinear behaviour of the pavement materials and possibly backcalculate the nonlinear parameters for unbound layers. The FWD tests conducted in Torpsbruk showed that the pavement structure exhibited nonlinear behaviour as the load-deflection curves did not follow a straight line (Figure 20). The influence of the subsurface moisture content was pronounced, as shown in this figure.
6
Layer moduli backcalculation
The analysis of the deflection basin from FWD testing was limited to static loads with linear and non-linear material characterization. The conventional linear backcalculation procedure analyses the deflection basins separately for different impact load levels. However, in nonlinear backcalculation, a set of moduli is obtained from the deflection basin for different load levels. The consideration of the stress sensitive characteristics of unbound materials is usually achieved through adjusting the layer moduli in an iterative manner by use of different constitutive stress-modulus relationships.It is to be noted that the interpretation of the
consistency of the moduli with load levels should be taken with care, even if the deflection basin fits may be very good. The limitations of the backcalculation procedures should also be considered.
The commercially used backcalculation program Evercalc, developed by the Washington State Department of Transportation (WSDOT), was used to analyse the FWD deflection data (Everseries, 2005). The Evercalc program has been widely used in the structural analysis of the flexible pavements.
6.1
Backcalculation algorithm
The backcalculation process generally consists of two main components: a forward
calculation program that calculates the response of a multi-layered system to external loading and a convergence optimization code that adjusts the input parameters to the forward
calculation program so that the measured and calculated deflections are matched with a certain accuracy.
The Evercalc (Everseries, 2005), computer program was used for the backcalculation of the deflection data. The Evercalc program implements a WESLEA layered elastic engine for forward calculation and a modified least square method for convergence optimization. The Evercalc determines the coefficient of stress sensitivity of unstabilised material using a linear regression method when multilevel FWD data are available.
For this study, when the nonlinear response of the unbound materials was determined, a set of moduli was obtained from each load level. At this point, the reliability of the backcalculated moduli was checked by fit quality measured and calculated deflection basins. Thereafter, the backcalculated moduli and the load induced stresses in unbound layers corresponding to each load level were used to determine the nonlinear parameters.
For the selected model, the nonlinear parameters were determined using the curve fitting toolbox in Matlab. A flowchart presenting the algorithm implementation is shown in Figure 21. For all the FWD test date and load level, the backcalculation algorithm produced less than 3% Root Mean Square (RMS) convergence error.
Figure 21 Implementation of backcalculation algorithm.
The pavement structure used in the backcalculation consisted of an asphalt concrete layer about 100 mm thick underlain by a granular layer of 460 mm thick (base and subbase
together). The subgrade of a silty sand material was 2.5 m thick. Under the subgrade layer, an infinite stiff bedrock layer (3500 MPa) was modelled. In the backcalculation procedure, the stiffness of the asphalt concrete layer was modified based on the HMA layer temperature that was measured when the FWD tests were conducted and the stiffness properties of the layer determined in the lab using a direct method option in Evercalc (Everseries, 2005). A fixed Poisson’s ratio of 0.35 was assigned to the asphalt concrete, granular and bedrock layers. The subgrade layer had a Poisson’s ratio of 0.4. The backcalculated stiffness of the unbound granular layer and the subgrade along with the volumetric moisture content measurements are presented in figures 22 and 23.
The deflection data used for the backcalculations are from the 60, 70, 80 and 90 m stations on both sides of the road. These stations were closest to the groundwater level and subsurface moisture sensors locations, which made more confident correlation of the pavement environmental factors to its structural condition.
Input pavement parameters FWD loads, deflection and sensor spacing Layersseed moduli WESLEA
Calculate theoretical deflections, stresses and strains using layered linear elastic theory
Compare measured to theoretical deflections Deflection difference ≤ tolerance Change moduli
Using final moduli, stresses and strains Choosing the constitutive model Curve fitting in Matlab Output nonlinear parameters Yes No E v er ca lc Cu rv e fit ting in M atlab
The backcalculation was performed using all three load levels (30 kN, 50 kN and 65 kN) conducted during the FWD tests. With the deflection measurements, the backcalculated stiffness showed a clear correspondence to the measured subsurface moisture content. The backcalculated granular layer stiffness (Figure 22) was dropped as the clogging of the drainage pipes occurred and the moisture content increased in the subbase layer. Thereafter the stiffness remained almost constant during the non-draining period (clogged drainage). The FWD frequent measurements performed after unclogging the drainage system clearly showed the impact of the moisture content on the stiffness of the base and subbase layers. The
granular layer stiffness increased right after unclogging the drainage pipes, and thereafter showed a more gradual decrease as the moisture content in the subbase layer decreased. The pre-clogging granular layer backcalculated stiffness (May 11 measurement)
corresponding to a 50 kN load pulse was 230 MPa. The backcalculation of the first FWD measurement after clogging the drainage pipes (June 13) returned a 188 MPa stiffness for the granular layer. The stiffness of the granular layer remained nearly constant during the further measurements in the “non-draining” condition (clogged drainage). The minimum stiffness for the granular layer was observed form the September 14 measurement with a magnitude of 153 MPa for 50 kN FWD load level. The granular layer gradually recovered (218 MPa on
September 26) to the pre-clogging stiffness values as the drainage was unclogged and the moisture content reduced in the subbase layer. The granular layer stiffness showed
approximately 38% reduction during the non-draining (clogged) period compared to draining period (unclogged condition).
Figure 22 Backcalculated stiffness based on FWD measurements and volumetric moisture content in the granular layer.
The backcalculated subgrade stiffness with volumetric moisture measurements at 90, 120 and 150 cm depths is presented in Figure 23. The backcalculated subgrade stiffness
structure over the study period. The stiffness of the subgrade considerably decreased as the drainage pipes were blocked and consequently the moisture content increased in the subgrade. The stiffness of the subgrade layer backcalculated from the May 11 50kN FWD test was 147 MPa. The subgrade was probably recovering from the spring-thaw weakening when the test was performed. The stiffness of the subgrade dropped along with the drainage clogging. The stiffness of the subgrade was nearly stable during the non-draining period (clogged drainage) with a minimum value of 99 MPa measured on September 14 for a 50 kN load level.
The effect of the drainage unclogging was fast, as was the reduction of the groundwater level and moisture content. Within only a day after unclogging the drainage pipes the
backcalculated stiffness rose from 99 to 157 MPa (more than 53% increase). The stiffness of the subgrade moderately increased afterwards until the maximum value of 174 MPa was obtained from the September 22 FWD test with a 50 kN load pulse. The effect of subsurface drainage on the layer stiffness during the study period is summarised in Table 3.
Figure 23 Backcalculated stiffness based on FWD measurements and volumetric moisture content in the subgrade.
Table 3 Pavement layer stiffness corresponding to 50 kN load level during the study period.
Layer Stiffness (MPa) Stiffness decrease (%) Draining (unclogged) Non-draining (clogged)
Base and Subbase 230 153 34
6.2
Nonlinear constitutive model
In recent years, a number of consecutive models have been proposed by highway engineers to describe the nonlinear stress dependency of unbound pavement materials. Resilient modulus triaxial testing is mainly used to explain and model the nonlinear behaviour. Thus, the resilient modulus tests are usually reported as a function of the stress state. The
Mechanistic-Empirical Pavement Design Guide (ARA, 2004) proposes the so-called generalized
constitutive equation for soils and unbound pavement materials as follows:
𝑀
𝑅= 𝑘
1𝑝
𝑎(
𝑝𝜃 𝑎)
𝑘2(
𝜏𝑜𝑐𝑡 𝑝𝑎+ 1)
𝑘3 [1]where 𝑀𝑅 = resilient modulus (MPa), 𝜃 = bulk stress (kPa), 𝑝𝑎 = 100 kPa (normalizing stress or atmospheric pressure), 𝜏𝑜𝑐𝑡 = octahedral shear stress =13(√(𝜎1−𝜎2)2+(𝜎1−𝜎3)2+(𝜎2−𝜎3)2, and 𝑘1, 𝑘2, 𝑘3 are regression constants obtained by fitting resilient modulus test data.
This universal model additionally considers the effect of the shear stresses which accounts for a modulus increase (unbound aggregates) or modulus decrease (fine-grained soils) with increasing stress states. In this model, the parameter 𝑘1 is directly proportional to a resilient modulus and therefore is positive. Since increase in bulk stress results in a stiffening effect in unbound materials, the 𝑘2 parameter should be positive. In contrast to bulk stress, an increase in shear stresses has a softening effect, and therefore 𝑘3 usually has a negative sign.
Typically for fine-grained subgrades, the modulus decreases proportionally to increasing stress levels (stress-softening behaviour). Thus, the vertical deviator stress on top of the subgrade by applied wheel load becomes the parameter affecting its resilient modulus. For unbound granular materials, the simpler 𝐾- 𝜃 model is used (Seed et al., 1962). This model often adequately captures the overall stress dependency (first stress invariant) of granular materials under compressive field loading conditions. A study by Rada and Witczak (1981) based on 271 tests from 10 different agencies indicated the applicability of the
simplified 𝐾- 𝜃 model. This model is proposed as follows:
𝑀
𝑅= 𝑘
1𝑝
𝑎(
𝑝𝜃𝑎
)
𝑘2
[2]
where, 𝑘1, 𝑘2 are regression parameters and 𝑝𝑎 = 100 kPa (normalizing stress or atmospheric pressure).
6.3
Nonlinear parameter backcalculation
The FWD testing is extensively used for design and evaluation of flexible pavements. Traditionally, the FWD moduli obtained from deflection data for a 50kN impact load is used in pavement design and analysis. This is based on the assumption that the load applied to the pavement by the FWD is similar to that exerted by real traffic. The obtained moduli are not adjusted for the nonlinear behaviour of the unbound material.
The mechanistic-empirical design of flexible pavements can be improved by taking into account the material nonlinearities. This section discusses the feasibility of characterizing the nonlinear parameters of the unbound granular layers and subgrade from an FWD deflection