VTI rapport 630A Published 2009
www.vti.se/publications
A winter maintenance strategy for roads based
on climatic factors
Publisher: Publication:
VTI rapport 630A
Published: 2009 Project code: 12844 Dnr: 2007/0183-28
SE-581 95 Linköping Sweden Project:
Article: When should different methods for friction control be used?
Author: Sponsor:
Harald Norem VTI (Swedish National Road and Transport
Research Institute)
Title:
A winter maintenance strategy for roads based on climatic factors
Abstract (background, aim, method, result) max 200 words:
The scope of the report is to discuss the efficiency effect of the different methods for friction control of roads on the safety and accessibility due to the climatic conditions, and to establish climatic parameters that may be helpful in selecting the strategies for winter maintenance. The report is based on the analysis of the data assembled for the VTI project “Winter Model”, and presents mainly comparisons between accident data, operational standards for winter maintenance and climatic conditions in the different regions of Sweden. In addition, recommendations for selecting strategies for winter maintenance are presented.
Keywords:
Winter service, strategy, climate, traffic safety, winter maintenance
Utgivare: Publikation:
VTI rapport 630A
Utgivningsår: 2009 Projektnummer: 12844 Dnr: 2007/0183-28 581 95 Linköping Projektnamn:
Artikel: När ska olika halkbekämpnings- metoder användas?
Författare: Uppdragsgivare:
Harald Norem VTI
Titel:
Strategi för vinterväghållning av vägar baserad på klimatfaktorer
Referat (bakgrund, syfte, metod, resultat) max 200 ord:
Ramen för denna rapport är att diskutera påverkan på trafiksäkerhet och framkomlighet av olika metoder för halkbekämpning av vägar beroende på klimatförhållanden samt att skapa klimatparametrar som kan vara till hjälp för att välja vinterväghållningsstrategier. Rapporten baseras på analyser av de data som har samlats in i VTI- projektet ”Tema Vintermodell” och presenterar till största delen jämförelser mellan olycksdata, driftstandard för vinterväghållning och klimatförhållanden i olika klimatzoner i Sverige. Dessutom presenteras rekommendationer för val av strategi för vinterväghållning av vägar.
Nyckelord:
Vinterväghållning, strategi, klimat, trafiksäkerhet
ISSN: Språk: Antal sidor:
Preface
The report is a result of collaboration between Norwegian University of Science and Technology (NTNU) and VTI, and is made possible by the stay of Professor Harald Norem as a visiting researcher at VTI during the 2006/2007 winter. The data material used for the analyses was assembled by VTI for the “Winter Model Project”.
The author wishes to thank Gudrun Öberg and her colleagues at the section of
Infrastructure Maintenance for fruitful discussions and help, and Urban Björketun for assistance in supplying available statistics on traffic and accidents on the Swedish road network. Special thanks go to Staffan Möller, who has been to a great help in supplying data, being an active collaborator in discussing ideas and preliminary results, and was my close contact during my stay at VTI.
Personally, I also want to thank all colleagues at VTI for an interesting period at VTI and for their collaboration.
Linköping May 2009
Quality review
Review seminar was carried out on June 13, 2007 where Carl-Gustaf Wallman reviewed and commented on the report. Harald Norem has made alterations to the final manu-script of the report. The research director of the author, at the time at VTI, Gudrun Öberg, examined and approved the report for publication on March 31, 2009.
Kvalitetsgranskning
Granskningsseminarium genomfört 2007-06-13 där Carl-Gustaf Wallman var lektör. Harald Norem har genomfört justeringar av slutligt rapportmanus. Författarens närmaste chef under tiden vid VTI, Gudrun Öberg, har därefter granskat och godkänt publika-tionen för publicering 2009-03-31.
Table of contents
Summary ... 5
Sammanfattning ... 7
1 Introduction ... 9
2 Abbreviations and definitions ... 10
3 Existing routines for selecting strategies for the winter maintenance of roads... 11
3.1 Scandinavian guidelines for friction control of roads ... 11
3.2 Short description of the methods for friction control of roads ... 12
4 Recorded accidents versus winter maintenance standards ... 18
4.1 Presentation of the data assembled for the “Winter Model Project” at VTI ... 18
4.2 Methodology for the analysis of the accident data ... 20
4.3 Accident rates versus maintenance standards and climatic regions ... 22
4.4 Accident rates versus road surface conditions... 27
4.5 Accident rate proportions versus summer/winter conditions ... 31
4.6 Comparisons with previously published reports... 34
5 Climatological analyses ... 36
5.1 Climatic parameters defined for the analyses ... 36
5.2 Assembling of climatic data ... 38
5.3 Geographical variations of the parameter values... 39
6 Recommendations for selecting winter service strategies ... 46
6.1 Climatic limits for salting of roads ... 46
6.2 Climatic limits for the warm wetted sand method... 46
7 Conclusions ... 51
7.1 Feasibility of the friction control methods ... 51
7.2 Effects on accessibility... 51
7.3 Effects on safety ... 52
7.4 Recommendations for selecting the strategy for winter maintenance .... 53
A winter maintenance strategy for roads based on climatic factors
by Harald Norem∗
VTI (Swedish National Road and Transport Research Institute) SE-581 95 Linköping Sweden
Summary
The scope of the report is to discuss the efficiency effect of different methods for friction control of roads on the safety and accessibility due to the climatic conditions, and to establish climatic parameters that may be helpful in selecting the strategies for winter maintenance. The report is based on the analysis of the data assembled for the VTI project “Winter Model”, and presents mainly comparisons between accident data, operational standards for winter maintenance and climatic conditions in the different regions of Sweden. In addition, recommendations for selecting strategies for winter maintenance are presented.
Salt and gritting are the main methods for friction control on winter roads. In the latest years the method of using warm wetted sand has been developed and the method represents an alternative to salting in stable cold climates. The favourable weather situation for the warm wetted sand method is assumed to be road surface temperatures below -1°C and less than 3 mm water equivalent (WE) within 6 hours. The
corresponding values for recommending salt are assumed to be above -8°C and less than 1 mm WE/hr.
The basis for the data used in the present analyses is all police recorded accidents, except wildlife accidents, on the state roads in Sweden and data of road surface
conditions recorded by the road authorities in the 1993/1994 to 1996/1997 winters. The accident data are broken down into:
o Types of accidents and severity of the accidents.
o Road conditions recorded by the police at the time of the accidents. o Vehicle mileage on the different road conditions.
o Maintenance standard for the roads.
The accident analyses include only fatalities and severe injuries and are made separately for:
o Four climatic regions; Southern, Central, Lower Northern and Upper Northern Sweden.
o Three maintenance standard classes; A1+A2 and A3+A4, which require salting and B1+B2, which is based on gritting.
o Two road conditions: bare roads and snow/ice covered roads.
The accident rates for driving on snow/ice covered roads are dependent on the propor-tion of vehicle mileage on snow and ice relative to bare roads and the rates increase for lower proportions. The accident rate for snow/ice covered roads compared to bare roads is as high as 8–10 for vehicle mileage proportions of approximately 0.05 and 2–3 for proportions exceeding 0.5. For instance, 30–40% of the accidents recorded on the A1+A2 roads in Southern and Central Sweden occurred during the 4% of the time the roads were covered by snow or ice.
∗
The calculated numbers of accidents related to driving on snow and ice are lowest for the salted roads in the three southern regions of Sweden, but the opposite for Upper Northern Sweden, where there is a significantly higher number of accidents on the salted road network.
The data material indicates that there is a maximum of accidents when the vehicle mileage ratios on snow and ice are between 0.3 and 0.4. If these indications are correct one should preferably introduce salting if the ratio of snow and ice on unsalted roads is 0.3–0.5 and the use of salt may reduce the ratio to less than 0.2. On the other hand, by introducing salt in climatic areas having ratios exceeding 0.5 and ending up with ratios close to 0.3 will probably increase the number of accidents.
The ratio of the summer/winter accident rates for fatalities and severe injuries is higher for salted than for unsalted roads in all four climatic regions. The ratio is 1.2 for salted roads in the three southern regions and 1.4 for Upper Northern Sweden. The corre-sponding ratios for unsalted roads are 0.95 and 1.05. The data material makes it further possible to calculate the accident rates for driving on bare roads in the winter and compare these rates with the corresponding summer accident rates. The calculations indicate that the accident rates for driving on bare roads in winter are on average 0.55 for the unsalted roads and 0.75 for salted roads. Probably drivers expect on unsalted roads the roads to be partly covered with snow or ice in the winter and they reduce their speed even when the roads are bare. Similarly, drivers on salted roads expect the roads to be free of snow and have thus a higher speed when the roads are bare.
The development of the warm wetted sand method and the experience with high accident rates in very cold climates should be reflected in the selection of strategies for the winter maintenance of roads. The report has introduced three climatic parameters, which are mainly recommended to be used on a monthly basis:
Winter Severity Index, Wsev; proportion of recordings < -8°C
Winter Stability Index, Wstab; proportion of days favourable for the warm wetted
sand method
Winter Instability Index, Winst; proportion of fluctuations around 0°C per day.
The high accident rates found for the salted road network in Upper Northern Sweden form the background for recommending that salt should not be used in areas with winter months having Wsev exceeding 0.2, which means that the 20% of the recordings are
below -8°C. In areas with such climate, the warm wetted sand method is usually a reliable alternative, even for relatively high traffic loads.
The warm wetted sand method is most favourable in cold stable climates, but since the increase in cost compared to traditional gritting is relatively small, one may justify using warm wetted sand even in conditions when the probability of the long lasting effect is low. Warm wetted sand is only recommended for use in periods, and on roads with AADT <2,000, when the Winter Stability and the Instability Indexes are within the area represented by the following points in the Wstab-Winst diagram:
o Wstab =1 and Winst =0
o Wstab =0.2 and Winst =0
o Wstab =0.4 and Winst =1.2
In areas and periods with lower values of Winst represented by these limits, traditional
Strategi för vinterväghållning av vägar baserad på klimatfaktorer
av Harald Norem∗ VTI
581 95 Linköping
Sammanfattning
Ramen för denna rapport är att diskutera påverkan på trafiksäkerhet och framkomlighet av olika metoder för halkbekämpning av vägar beroende på klimatförhållanden samt att skapa klimatparametrar som kan vara till hjälp för att välja vinterväghållningsstrategier. Rapporten baseras på analyser av de data som har samlats in i VTI- projektet ”Tema Vintermodell” och presenterar till största delen jämförelser mellan olycksdata, driftstan-dard för vinterväghållning och klimatförhållanden i olika klimatzoner i Sverige. Dess-utom presenteras rekommendationer för val av strategi för vinterväghållning av vägar. Saltning och sandning är de huvudsakliga metoderna för halkbekämpning på vintervä-gar. På senare år har metoden med varmbefuktad sand utvecklats och metoden är ett alternativ till saltning vid stabilt, kallt klimat. De gynnsamma vädertillfällena för varm-befuktad sand antas vara temperaturer i vägytan under -1°C och nederbördsmängder mindre än 3 mm i smält form under en 6-timmarsperiod. Motsvarande värden för att rekommendera saltning antas vara över -8°C och mindre än 1 mm/timme.
Utgångspunkten för de data som använts i de aktuella analyserna är samtliga polisrap-porterade olyckor exklusive viltolyckor på det statliga vägnätet i Sverige och väglags-data som samlats in av väghållaren under de fyra vintrarna 1993/1994 till 1996/1997. Data har brutits ned i:
o Olyckstyp och allvarlighetsföljd vid olyckan o Väglag angivet av polisen vid olyckstidpunkten o Trafikarbete vid olika väglag
o Driftstandard för vägarna.
Olycksanalysen omfattar bara olyckor med dödlig utgång och svår personskada och görs uppdelad på:
o Fyra klimatzoner; Södra, Mellersta, Nedre norra och Övre norra Sverige
o Tre par av driftstandardklasser; A1+A2 och A3+A4, som normalt åtgärdas med salt och B1+B2, som vanligen sandas
o Två väglagstyper; barmark och is-/snöväglag.
Olyckskvoten på olika typer av is-/snöväglag beror på varaktigheten av respektive is-/snöväglag (trafikarbetet på respektive is-/snöväglag i förhållande till totala trafik-arbetet) och ökar med minskad varaktighet. Olyckskvoten vid is-/snöväglag relativt barmark är så hög som 8–10 vid en varaktighet på 0,05 och 2–3 för varaktigheter över-stigande 0,5. Till exempel inträffade hela 30–40 % av de polisrapporterade olyckorna på A1+A2-vägar i Södra och Mellersta Sverige vid endast 4 % av den tid som vägarna varit täckta av is eller snö.
∗
Det framräknade antalet olyckor på is-/snöväglag är lägst på saltade vägar i de tre sydli-gaste klimatzonerna. Motsatsen gäller emellertid för Övre norra Sverige där det händer ett signifikant högre antal olyckor på det saltade vägnätet.
Datamaterialet indikerar att det finns ett maximum i olycksantal när andelen trafikarbete på is-/snöväglag är mellan 0,3 och 0,4. Om denna indikation är riktig bör man företrä-desvis införa saltning om andelen is-/snöväglag på osaltade vägar är 0,3–0,5. Då kan användning av salt reducera andelen is-/snöväglag till mindre än 0,2. Å andra sidan, om man inför saltning i klimatzoner som har en andel is-/snöväglag överstigande 0,5, och som resultat får andelar nära 0,3, kommer troligen antalet olyckor att öka.
Kvoten mellan olyckskvoter sommartid och vintertid, för olyckor med dödade och svårt skadade personer, är högre för saltade än för osaltade vägar i alla fyra klimatzonerna. Kvoten 1,2 för saltade vägar i de tre sydligaste klimatzonerna och 1,4 i Övre norra Sverige. Motsvarande kvoter för osaltade vägar är 0,95 och 1,05. Datamaterialet gör det vidare möjligt att beräkna olyckskvoter på barmark vintertid och jämföra dessa kvoter med motsvarande sommarolyckskvoter. Beräkningarna visar att barmarksolyckskvoten vintertid i genomsnitt är 0,55 för osaltade vägar och 0,75 för saltade vägar. Troligtvis väntar sig förare på osaltade vägar att dessa ibland ska vara täckta av is och snö på vin-tern och minskar sin hastighet även om vägarna har barmark. På liknande sätt väntar sig förare på saltade vägar att dessa ska vara fria från is och snö och håller således en högre hastighet när vägarna har barmark.
Utvecklingen av metoden med varmbefuktad sand och erfarenheten av höga olycks-kvoter i mycket kallt klimat borde avspeglas i valet av strategi för vinterväghållning av vägar. Rapporten har lagt fram tre klimatparametrar som huvudsakligen rekommenderas att användas på månadsbasis:
o Vinterstränghetsindex, Wsev ; andel timobservationer < -8°C
o Vinterstabilitetsindex, Wstab ; andel dygn som är gynnsamma för att använda
varmbefuktad sand
o Vinterinstabilitetsindex, Winst ; andel svängningar runt 0°C per dygn.
De höga olyckskvoter som påträffats på det saltade vägnätet i Övre norra Sverige utgör bakgrund för att rekommendera att salt inte bör användas i områden under de vintermå-nader som har Wsev över 0,2, vilket betyder att 20 % av timobservationerna är under
-8°C. I områden med sådant klimat är vanligtvis varmbefuktad sand ett pålitligt alterna-tiv, till och med på relativt högtrafikerade vägar.
Metoden med varmbefuktad sand är mest gynnsam i kallt, stabilt klimat men eftersom kostnadsökningen jämfört med konventionell sandning är relativt liten kan man moti-vera användning av varmbefuktad sand även under förhållanden då sannolikheten för långvarig effekt är låg. Varmbefuktad sand rekommenderas bara att användas under perioder, och på vägar med ÅDT <2000, när både Vinterstabilitetsindex och Vinterin-stabilitetsindex befinner sig inom den yta som representeras av följande punkter i ett Wstab /Winst - diagram.
o Wstab =1 och Winst =0
o Wstab =0,2 och Winst =0
o Wstab =0,4 och Winst =1,2.
I områden och perioder med lägre värden på Winst än de som anges av dessa gränser är
1 Introduction
Friction control of winter roads is a major task to ensure safety and accessibility to the road users in cold climates. Traditionally, there are two main methods in use today, salting and gritting of roads. Salting is mainly used on roads having high traffic volumes and gritting mainly on the secondary road network having less traffic. Both methods have their advantages and disadvantages due to improvements of friction, durability of the actions, effectiveness in different climatic conditions and impact on the environ-ment. The aim of the present presentation is to discuss the efficiency of the different methods on safety and accessibility due to the climatic conditions, to show that the climate should be an important factor in selecting the strategies for winter maintenance and to establish climatic parameters that may be helpful in making those decisions. The analyses presented are mainly based on data assembled for the “The Winter Model Project” carried out by Swedish Road and Transport Research Institute (VTI) in the years 2001–2005, Wallman (2006), Wallman et al. (2006) and Niska (2006). The aim of the Winter Model Project was to estimate and put a value on the most important impacts of the strategies and measures in winter road management for road users, road manage-ment authorities and society at large. As part of the project an extensive programme for assembling data on road conditions, accidents and need for friction control was carried out.
The present report is based on further analysis of the data assembled for the Winter Model Project and presents mainly comparisons between accident data, operational standards for winter maintenance and climatic conditions in the different regions of Sweden. An important part of the presentation is recommendations for selecting salting or gritting for the winter maintenance strategy based on traffic volumes and climatic parameters.
2 Abbreviations
and
definitions
The following abbreviations and definitions are used in this report. FSIR =Accident rate for fatalities and severe injuries
k = Ratio of winter to summer accidents for fatalities and severe injuries Q = Amount of snow to melt a unit weight of snow or ice (g NaCl) Rbare= Proportion of vehicle mileage for driving on bare roads in winter
T =Temperature (oC)
W =Amount of snow or ice to be melted (g) WE =Water equivalent of snow and ice (mm)
Wsev = Winter Severity Index; proportion of recordings < -8°C
Wstab = Winter Stability Index; proportion of days favourable for the warm wetted sand
method
3
Existing routines for selecting strategies for the winter
maintenance of roads
3.1
Scandinavian guidelines for friction control of roads
All Scandinavian countries have established guidelines for defining strategies and methods for ensuring acceptable standards for the road conditions in the winter period. An overview of the standards is presented in the report of the EU-project “Roadex,” Norem and Thordarson (2001).
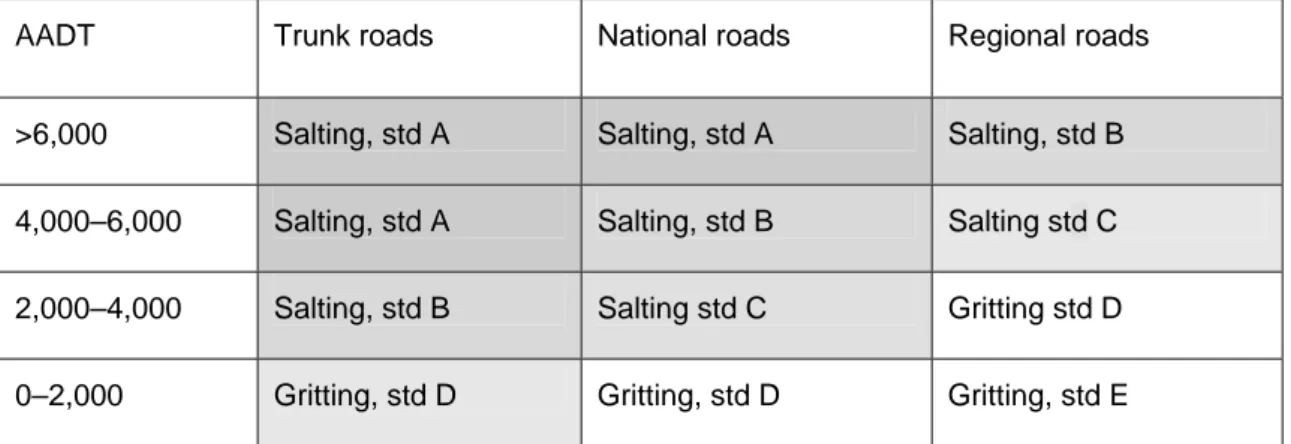
Generally, the guidelines and the routines for selecting standards for the winter opera-tions of roads are based on the traffic loads and the importance of the roads. The practice may be expressed generally as shown in Figure 1:
AADT Trunk roads National roads Regional roads
>6,000 Salting, std A Salting, std A Salting, std B
4,000–6,000 Salting, std A Salting, std B Salting std C
2,000–4,000 Salting, std B Salting std C Gritting std D
0–2,000 Gritting, std D Gritting, std D Gritting, std E
Figure 1 Schematic presentation of how guidelines on strategies for the standard of winter maintenance are practised in the Scandinavian countries.
Figure 1 describes that the highest standard is performed on the trunk roads with high traffic volumes, and the standard of winter maintenance is reduced when the importance of the road and traffic are lower. All countries practise a certain limit for the traffic load to offer regular use of salt, usually this limit is within the range of AADT 2,000–3,000. The standards for Finland and Iceland are set up in accordance with Figure 1, while in Sweden there is a limit between salting and gritting at ADDT 2,000, independently of the importance of the road. The level of service standard is, however, dependent both on the AADT and the importance of the road. In Norway there is a lower limit for salting at AADT 3,000, but the decision whether or not to offer salting is selected separately for each road.
Roads that are salted are assumed to be free of snow or ice the whole winter except for periods with heavy snowfalls. The time for establishing sufficient driving conditions after a snow event is dependent on the selected standard for road service. This lap time is an important part of the standard offered to the road users and is a main factor for the cost of winter maintenance and the consumption of salt.
None of the Scandinavian countries has defined climatic conditions for the guidelines for salting or gritting. However, there is a practice in Finland, Sweden and Norway to be careful in using salt in the coldest areas of the countries.
3.2
Short description of the methods for friction control of roads
3.2.1 Salting
Salt is used to avoid the formation of compacted snow and ice covers on the roads. The salt may be spread out either before the situation that causes slippery roads or on ice/snow surfaces. The former case is called pre-salting and for the latter case salt is used as a de-icer agent. The salt may be spread out as dry salt, dry salt pre-wetted with a salt solution, or as a solution of 23% salt and 77% water. The general rule is that salt solution is recommended at temperatures close to 0°C and no precipitation. At lower temperatures and with snow precipitation, higher concentrations of salt are needed, and in such cases pre-wetted or dry salt are recommended.
The amount of salt to keep the roads free of snow and ice is thus dependent on both temperature and snow precipitation. At temperatures below -8 to -6°C it might be difficult to keep a sufficiently high salt concentration to avoid the formation of ice on the roads; even if the salt may theoretically work down to -21.3°C. The guidelines for the Scandinavian countries usually specify -8 to -6°C as the practical, minimum tempe-ratures for using salt.
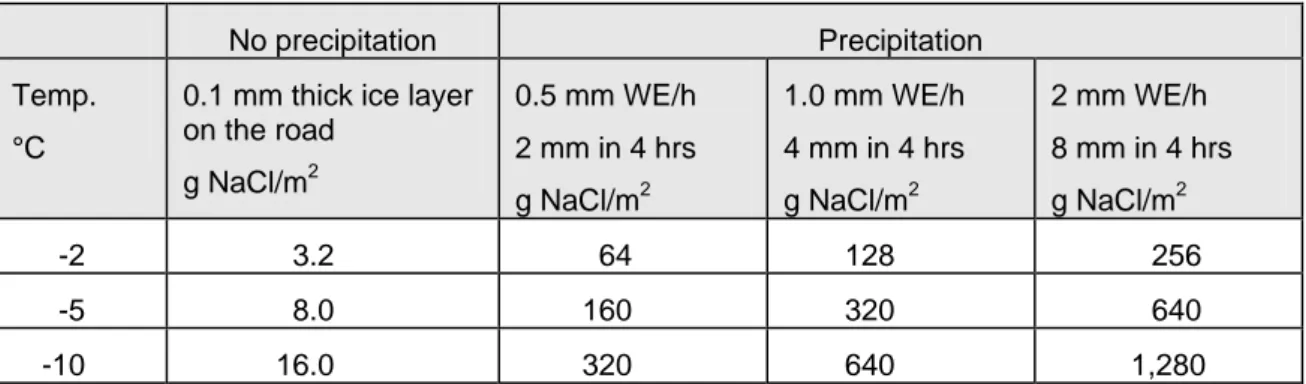
The aims of using salt are twofold; to melt snow and ice on the road to prevent moisture freezing on the roads and to take advantage of the effect of the salt to reduce the bonds between the snow grains. When these bonds are reduced by the salt, it is impossible to compact the snow and the snow hardly sticks to the road surface. The snow cover then changes to a loose snow structure, slush. Loose snow on the road should preferably be removed within a short time to improve the driving conditions in snowy weather. The amount of salt to melt snow and ice is highly dependent on the temperature and the amount of snow that has to be melted. The Danish guideline for winter service of roads operates with the following equation for temperatures down to -8°C, (DPRA, 2006):
Q=0.016 · (-T) · w (gram NaCl) (1)
where Q is the necessary amount of salt in grams, T is the temperature in °C, and w is the amount of ice/snow to be melted per gram unit. The result of eq. 1 is presented in the following table for different temperatures and amounts of snow. There are four assumptions made for the amounts of snow/ice; a 1 mm thick layer of ice, and snow falling in a 4 hour period with the following intensities, 0.5, 1.0 and 2 mm water equivalent per hour (mm WE/h).
The last cell in Table 1 has the value of 1,280 g/m2. The value is based on the assumption that 2 mm precipitation per hour gives a total snowfall of 8 mm WE in 4 hours, which equal the weight per m2; 100 cm · 100 cm · 0.8 cm WE = 8,000 cm3 WE = 8,000 g. According to eq. 1 the necessary amount of salt at T= -10o C will then be: Q=0.016 · (-(-10)) · 8,000 = 1,280 g
Table 1 Necessary salt to melt snow/ice on the road at different temperatures and precipitation rates.
No precipitation Precipitation
Temp. °C
0.1 mm thick ice layer on the road g NaCl/m2 0.5 mm WE/h 2 mm in 4 hrs g NaCl/m2 1.0 mm WE/h 4 mm in 4 hrs g NaCl/m2 2 mm WE/h 8 mm in 4 hrs g NaCl/m2 -2 3.2 64 128 256 -5 8.0 160 320 640 -10 16.0 320 640 1,280
The amounts of salt used for melting thin ice films on the roads are thus limited. However, to use salt to melt snow falling on the road requires extremely high amounts of salt. A well performed winter maintenance rather uses the salt to avoid compacted snow sticking to the road surface and then the slush is removed mechanically to keep as little snow as possible on the road. But even with this procedure, the consumption of salt during snow fall is substantial.
The amount of salt used for keeping the roads free of snow and ice is thus highly
dependent on the amount of falling snow each winter and on the winter temperatures. A study for two roads in Oslo in 2003/2004 showed that 63% of the salt consumption was used during snowfalls and 31% as preventive action and only 6% for melting ice already formed on the road, Figure 2, Vaa (2004)
6 %
31 %
63 %
Melting of ice
Preventive
salting
Salting
during
snow falls
Figure 2 The percentage of salt consumption for melting of ice, pre-salting and salting during snow periods. (Vaa, 2004).
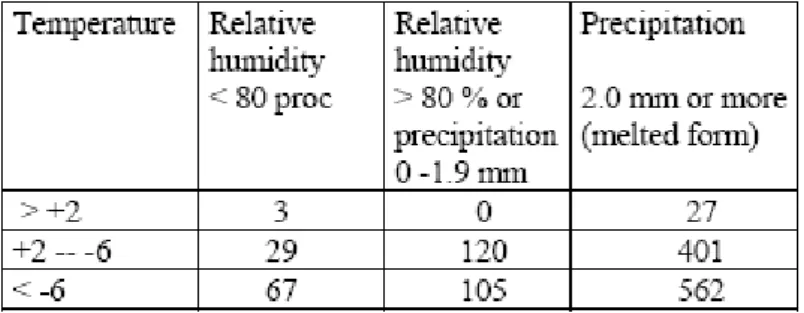
The consumption of salt in relation to the weather conditions has also been studied in Sweden, Johansson (2002). Table 2 presents the salt consumption per day and kilometre depending on the temperature, humidity and precipitation. The highest consumption is found on cold days with precipitation, approximately 4–5 times higher compared to humid days with the same temperature.
Table 2 Recorded salt consumption in kg per calendar day and km on roads in maintenance class A2. (Johansson, 2002.)
The consumption of salt during heavy snowfalls needs to be high to prevent the forma-tion of compacted snow. The kind of weather situaforma-tions where salt is favourable or has its limitations is shown graphically in Figure 3. The figure indicates that the best efficiency is found at temperatures down to -8°C and with only modest snow fall, say 1 mm water equivalent (WE) per hour. At higher intensities salt should be used with caution. The limit of snow fall intensity of 1 mm WE/hr is close to the findings of the “Winter Model” for intensities that cause salted roads to be packed with snow, Möller (2006)
0 1 2
-12 -10 -8 -6 -4 -2 0
Road surface temperature (oC)
P recip ita ti on (mm W E /h ) Salt is efficient
Salt should be used with caution
Salt should be avoided
Figure 3 Weather situations where salt is efficient, should be used with caution or avoided.
3.2.2 Gritting
Sand or crushed rock has traditionally been spread on ice and compacted snow surfaces to improve road friction. The effect of dry sand is limited, the improvement in the fric-tion coefficient is usually considered to be 0.05 to 0.1 and the improved fricfric-tion lasts for a limited time. On roads with traffic speeds of 80 km/h and a high percentage of trucks the improved friction will only last for approximately 50 cars, Vaa (2006). To facilitate the handling of sand in cold weather and to improve the durability it is common practice to blend some salt into the sand ahead of the winter season. This action prevents the
sand from freezing in cold weather, but has only minor effects on durability and on the improved friction. In some cases, however, it has been detected that the salt has melted a thin water film on the ice surface, thus resulting in a decrease in the friction
coefficient.
At the Xth PIARC Winter Road Congress in Luleå in 1998, the Swedish Road Admini-stration (SRA) presented equipment for wetting the sand with hot water, the warm wetted sand method. This method was then further developed in Norway and since then in Finland. Today, the method has proved to improve both the friction and the durability considerably, and it is in use on a regular basis for the winter maintenance of roads and airfields in Norway, Vaa (2006).
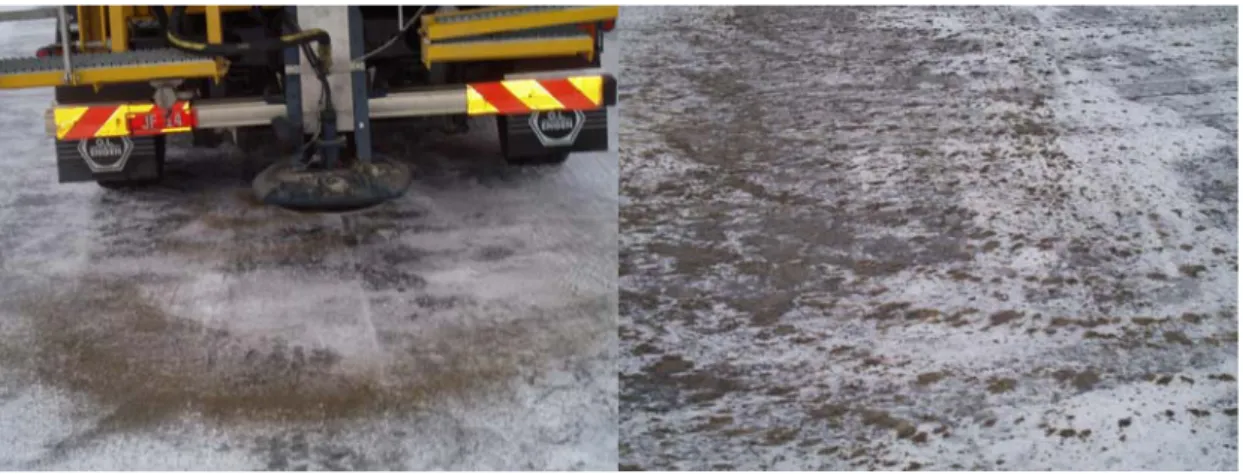
The equipment used today are spreaders that may use both salt and sand and the
spreaders are equipped with water tanks that make it possible to heat the water to 95°C, Figure 4. The hot water is mixed with the sand at the spreading disc. Best results have been documented by having water temperatures above 90°C, a water content of 30% in weight and sand having a relatively high content of fines. The main necessity to obtain high friction lasting for a long period is to have clumps of sand with high contents of fines that freeze to the snow/ice surface, Figure 4.
Figure 4 Photo showing the equipment for spraying warm wetted sand and the sand spread on the road.
The warm wetted sand method needs to have road surface temperatures below 0°C to have the sand grains freeze to the ice or the compacted snow, and thus to have the improved friction to last for longer periods. When the climatic conditions are favour-able, gritting has been recorded to have an effect up to one week with an AADT of more than 1,000, Vaa (2006). In those cases 200 g sand per m2 has been used, and there have been temperatures well below 0°C and no precipitation.
Engen (2006) made investigations with the warm wetted sand method to study if it was possible to reduce the amount of sand and to record the variation of the friction coeffi-cient with time. He also made interviews to assemble the practices and experiences obtained in Norway so far.
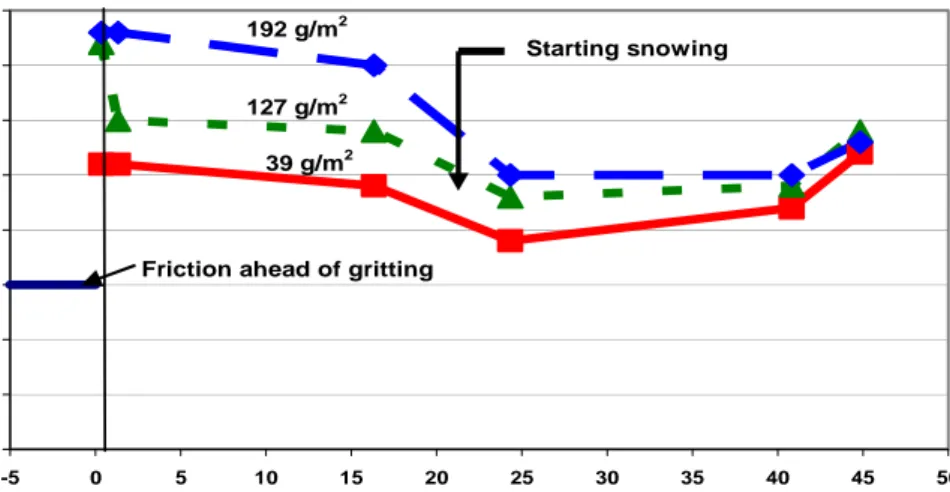
His investigation indicated that it is possible to reduce sand consumption to 100 g/m2 and still have friction coefficients above 0.3, which is the required friction on
Norwegian trunk roads. However, by using less sand the durability of the sanding measure was slightly reduced. An example of one of his recordings is shown in
Figure 5. Even by using as little sand as 39 g/m2 a substantial friction improvement was obtained for almost 24 hours. The figure also shows that the effects of gritting were lost at once when snow started to fall.
0 0,05 0,1 0,15 0,2 0,25 0,3 0,35 0,4 -5 0 5 10 15 20 25 30 35 40 45 50
Hours after spreading of warm wetted sand
F ri c ti o n co ef fi ci ent
Friction ahead of gritting
Starting snowing
39 g/m2
127 g/m2
192 g/m2
Figure 5 Recorded friction coefficients with time by the warm wetted method for varying amounts of sand, (Engen, 2006).
An interesting part of Engens study was that in the maritime climates in Norway where he made his study, the periods with preferable climatic conditions were fairly short. Within 24–48 hours there were very often changes in the weather situations, bringing either warm weather or snow. One may thus discuss how long an action needs to last. Maybe it is more economical to have cheaper actions, but to carry them out more frequently, rather than to carry out more expensive actions that may last longer, but where the effect is reduced by changes in the weather. In many cases weather variations, rather than wear of the sanding action, set the limits for whether or not it is necessary to repeat the friction control action.
Engen (2006) assembled experiences from persons employed by contractors, Norwegian Public Roads Administration (NPRA), the Norwegian Army and Avinor (The
Norwegian Aviation Administration). The best results were obtained when the ice/snow surface was below -1°C and the surface was firm with no loose snow on top. At some airports they even had the practice to brush the surface ahead of spreading warm wetted sand. Some experiments have also been made on spreading warm wetted sand on very thin ice films, and with fairly good results, Vaa (2006).
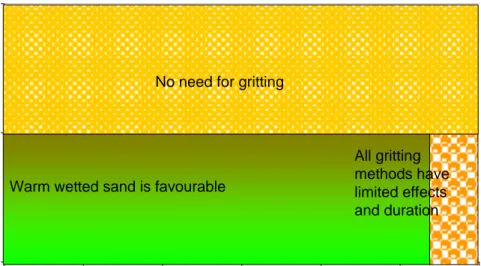
The weather situations which are favourable/unfavourable for the use of the warm wetted sand method are presented graphically in Figure 6. The Figure indicates that warm wetted sand may be used up to snow falling intensities of 0.5 mm WE/h and with road surface temperatures below -1°C. For snow fall intensities up to that level the turbulence generated by the traffic is assumed to remove most of the snow. For higher intensities a snow cover will be allowed to form and no friction control will be made during the snow fall. Special attention has to be paid to road surface temperatures between -1°C and 0°C, as the warm wetted sand method offers no better efficiency than dry sand in such weather situations. The need for friction control during light snowfalls has been demonstrated by Möller (2006), who found that thin ice films often developed after a snow fall of 1 cm, and before the snow started to be packed on the road.
0 0,5 1
-12 -10 -8 -6 -4 -2 0
Road surface temperature (oC)
Pr ecipita tion ( m m WE/h)
Warm wetted sand is favourable
All gritting methods have limited effects and duration No need for gritting
Figure 6 Weather situations where warm wetted sand is efficient or has limited efficiency.
When Figures 3 and 6 are compared, it is seen that both methods have a well docu-mented effect on the cold weather situations that are most frequent in the winters, road surface temperatures between -1 and -8°C and no or only light falling snow. Warm wetted sand is probably the only method that works well for temperatures below -8°C, and is thus most favourable in areas with very low winter temperatures. Special atten-tion has to be paid to condiatten-tions with snow/ice layers having temperatures between 0 and -1°C. Such conditions are frequent in some areas on non-salted roads and the roads are in those cases very slippery. Today there are no gritting methods that are efficient in such conditions. Salt spread out to ensure that the ice on the roads is melted, is today the only practical method to obtain the necessary friction at road surface temperatures close to 0°C.
4
Recorded accidents versus winter maintenance standards
4.1
Presentation of the data assembled for the “Winter Model
Project” at VTI
In the Winter Model Project models were established to estimate accident rates for different driving conditions during the winter periods. The severity and the economic consequences of the different types of winter related accidents were also studied. A detailed description of the assembled data and the calculated accident rates and consequences of the accidents are presented by Niska (2006).
The basis for the Accident Risk Model is data assembled for the winters 1993/1994, 1994/1995, 1995/1996 and 1996/1997 by the police and the road authorities. The accident data covers all police-recorded accidents on state roads all over Sweden and they are broken down into:
o Types and severity of the accidents.
o Road conditions recorded by the police at the time of the accidents. o Maintenance standard for the roads.
o Climate zone.
o Vehicle mileage on the road network.
Types of accidents and consequences of the accidents
The police then classified the cause of the accidents, the severity and the road conditions. In the Winter Model, the cause of accidents is divided into four groups:
o Single-vehicle accidents. o Head-on accidents. o Rear-end accidents. o Other types of accidents.
The severity is usually classified in four degrees, but the VTI-investigations only used two classes.
o Fatalities and severe injuries (FSI). o Slight injuries and property damage only.
The accuracy in the police recordings is assumed to be higher for the severe accidents than for those with smaller consequences. Especially in the north and the remote areas, the proportion of less severe accidents reported to the police is probably fairly low.
Road conditions at the time of the accident
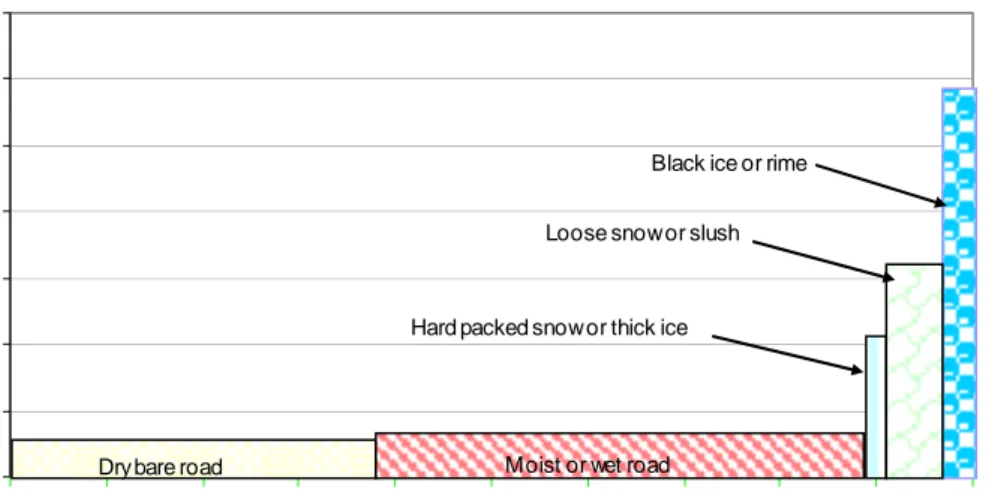
The police recorded in addition information on the road conditions at the time of the accident, and the road surface was classified into five conditions:
o Dry bare road.
o Moist or wet bare road.
o Hard-packed snow or thick ice. o Black ice or rime.
Unfortunately the recordings do not have a classification of partly bare roads, with bare surface in the wheel tracks and snow outside the tracks. This situation is frequent on winter roads, and it is unclear how such conditions have been classified. The classi-fication of the road surfaces is thus lacking in accuracy to some extent.
Maintenance standard
At the time of the investigation Sweden had six standard classes for the winter service, of which four required use of salt, named A1 to A4, and two used gritting for friction control, B1 and B2. The main differences for the A classes were the time lap the road needed to be free of snow after a snow fall event and snow allowed to remain on the centre of the road and on the road shoulders. The requirement for the friction coefficient during normal conditions was the same for all classes, 0.25. Salt was not allowed to be used below -8°C. At present, the guideline has -6°C as the lower limit for the use of salt. The standard for the gritted roads has requirements for the thickness of snow or ice on the road and how fast sufficient friction has to be obtained after a snow fall.
Climate zones
The recorded accidents were grouped in four different climatic zones, Figure 7:
o Southern Sweden (SS); situated along the coast in Southern Sweden and charac-terized by fairly mild and short winters, and temperatures often varying between +/-0°C even in midwinter. The winter is assumed to last over the period
15 November–15 Mars (4 months).
o Central Sweden (CS); consisting of the inland part of southern Sweden. The area is characterized by modest precipitation and the winter temperatures are usually below 0°C in midwinter. The winter is assumed to last the over the period 15 October–15 April (6 months).
o Lower Northern Sweden (LNS); which is found approximately between 60 and 63° northern latitude. The area has normally stable winters with modest precipi-tation and temperatures well below 0°C in midwinter. The winter is assumed to last over the period 1 October–30 April (7 months).
o Upper Northern Sweden (UNS); which covers the far northern part of Sweden. The area has usually very cold winters, and the precipitation in the winters is low. The winter is assumed to last the over the period 1 October–30 April (7 months).
Figur 7 Map of Sweden showing the subdivision of the country into four climatic regions.
Road conditions
During the four winters of assembling data the road authorities recorded the road sur-face conditions regularly at 2,000 sites selected all over Sweden. During that period the road surface conditions were grouped in classes consistent with the classification made by the police.
The recorded road surface conditions according to the road authorities and the police have been checked, and some inconsistencies have been found. That might be a result of local variations and the fact that the classification made by the road authorities were evaluated at certain intervals while the police recorded the conditions at the time of the accident. It is in addition hard to make an accurate estimate when the road is only partly covered with snow or ice. Anyway, the comprehensive work for the classification of the road conditions is impressive, and the estimate of the road surface conditions should be assumed to be as accurate as possible, and sufficient for use in calculating accident rates.
Vehicle mileage
The calculated vehicle mileages for the different maintenance standard groups and the road conditions are based on the Average Annual Daily Traffic (AADT) for each road network and adjusted by correction factors for each day in a year, Niska (2006).
4.2
Methodology for the analysis of the accident data
The aims of the present analysis are partly different from those of Niska (2006). She focused mainly on types of accidents on different road surface conditions and the consequences of each type of accident. The present analysis concentrates more on the
differences in accident rates due to the winter maintenance standards and the climatic conditions in each region.
The present analyses are only based on fatal or severe injury accidents, as the accuracy of those recordings is assumed to be high. The total number of accidents is 3,271, of which 650 are in Southern Sweden, 1,561 in Central Sweden, 487 in Lower Northern Sweden and 573 in Upper Northern Sweden. The number of accidents is assumed to be large enough to carry out statistical analyses.
The accident analyses are made separately for the four climatic regions, and the winter maintenance standards are grouped in three. Class A1 and A2 is one group, A3 and A4 is the second and the two classes based on gritting, B1 and B2 form the third group. The accident rates are then calculated for each climatic region and for the five different types of road surface conditions. The calculation for one climatic region and one standard class may generally be presented as shown in Figure 8.
Accident rates for fatalities and severe injuries (FSI). Central Sweden and maintenance classes A3 and A4
0 0,05 0,1 0,15 0,2 0,25 0,3 0,35 0 0,1 0,2 0,3 0,4 0,5 0,6 0,7 0,8 0,9 1
Cumulative distribution of vehicle mileage
A c c id e n t ra te , ( F S I/m il l v e h. k m )
Dry bare road Moist or wet road
Black ice or rime
Hard packed snow or thick ice Loose snow or slush
Figure 8 Figure presenting calculated accident rates for winter maintenance standard classes A3+A4 in Central Sweden.
Figure 8 may be considered to be representative of the calculated accident rates for the salted roads. Generally the vehicle mileage on bare road surfaces is 80–96% of the total volume, and the accident rates on bare roads are much lower than on snow or ice covered surfaces. Usually the accident rates are highest for driving on black ice and a little less for driving on loose snow or slush. Packed snow or thick ice seems to have the lowest accident rates for snow/ice surfaces. These findings are consistent with those presented by Wallman (2001), Figure 9.
Accident Rate Relative to Dry, Bare Road, Entire Sweden 0 5 10 15 20 25 30 35 40 0,01 0,02 0,03 0,04 0,05 0,06 0,07 0,08 0,09 0,1 0,11 0,12 0,13 0,14 0,15 0,16 0,17 0,18 0,19 0,2 Relative Duration Rel a ti ve Acci d e n t Rat e
Hard Packed Snow Black Ice Loose Snow
Figure 9 Calculated accident rates for hard packed snow and ice, black ice or rime and loose snow or slush as a function of the proportion of the vehicle mileage for each surface condition, (Wallman, 2001).
The accident rates shown in figures 8 and 9 represent the probability for a driver to be involved in an accident in certain conditions. One should have in mind that the number of accidents on a road is the product of the accident rate and the vehicle mileage. To reduce the number of accidents one should preferably reduce both the accident rate for the different surface conditions and the proportion of the vehicle mileage for driving on conditions having the highest accident rates.
4.3
Accident rates versus maintenance standards and climatic
regions
The calculations of the accident rates are based on the following input values presented by Niska (2006):
o Police recorded accidents with fatalities or severe injuries.
o Police recordings of the road surface conditions at the time of the accident. o Road surface classification made by the road administration during the
investigation period.
o Calculated vehicle mileage for the road surface conditions based on the recordings made by the road authorities and the AADT for the road network. The road surface conditions are grouped in only two classes, bare roads and roads covered with snow or ice. This is done to avoid operating with too small numbers for the statistical analyses and since it might sometimes be difficult to distinguish between the three different snow/ice covered road surfaces.
The calculated accident rates for the different climatic regions and maintenance
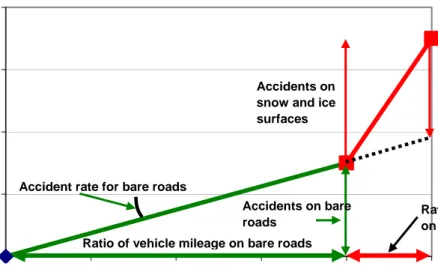
standard classes are presented as an integrated diagram of Figure 8. The principle of the integrated diagram is presented in Figure 10, and the diagrams for each climatic region in Figures 11–14.
0 0,02 0,04 0,06 0,08 0 0,2 0,4 0,6 0,8 1
Cumulative distribution of vehicle mileage
A ccum u la te d acci d e nt s ( F S I)
Accident rate for bare roads
Accidents on bare roads
Accidents related to driving on snow and ice Accidents on
snow and ice surfaces
Ratio of vehicle mileage on bare roads
Ratio of vehicle mileage on snow and ice
Figure 10 Diagram to describe the principle of presenting calculated accident rates, accumulated accidents for the two types of road surfaces and accidents related to driving on snow and ice.
The gradient of the green and red lines in Figure 10 describes the accident rates for driving on bare roads and snow/ice surfaces respectively. The increase in the ordinate for each road surface condition represents the number of accidents for that specific road condition, which is the product of each square in Figure 8. The end values at vehicle mileage ratio 1 are thus the total number of winter accidents given the vehicle mileage is one million vehicle kilometres
The diagram in Figure 10 makes it possible to estimate the number of accidents related to driving on snow and ice by introducing the following assumptions:
o If there were no snow and ice cover on the roads during the winter, the accident rates for the roads would be the same as the calculated rates for bare road condi-tions in the winter. The accumulated accidents without snow or ice would thus be the accident rate multiplied by the vehicle mileage ratio 1, which is repre-sented by the extension of the curve for accident rate for driving on bare roads, the dotted line in Figure 10.
o The accumulated accidents recorded minus those calculated for the bare road conditions are then assumed to be the number of accidents related to the adverse driving conditions due to snow and ice cover.
These assumptions take care of differences between the road standards, but the effects of any systematic differences in driving behaviour between summer and winter and regions and on driving on salted/unsalted roads are, unfortunately, not included. The calculated accident rates for the climatic regions and maintenance standard classes are presented in Table 3 and in the Figures 11–14.
Table 3 Accident rates broken down by winter maintenance standard classes and climatic regions.
Bare roads Snow and ice surfaces
Accident rates Accident rates
Climatic Region
A1+A2 A3+A4 B1+B2 A1+A2 A3+A4 B1+B2
Southern Sweden 0.030 0.030 0.034 0.269 0.186 0.108
Central Sweden 0.018 0.029 0.039 0.282 0.198 0.104
Lower Northern Sweden 0.025 0.028 0.030 0.197 0.130 0.106
Upper Northern Sweden 0.037 0.049 0.028 0.333 0.194 0.059
The calculated accumulated accidents for the four climatic regions are presented in Figures 11–14. The figures are based on the principles in Figure 10 and present both the proportion of road surfaces for bare roads and snow/ice covered roads for the three maintenance standard classes as well as the accident rates represented by the gradient of the lines. It is seen that for all figures the slope angles are less for bare road conditions than for snow/ice surfaces. The slope angles for the snow/ice conditions are in addition larger for the salted roads than for the unsalted roads. On the other hand, the proportions of the vehicle mileage for snow/ice surfaces are much less for the salted roads than for the unsalted roads.
0 0,01 0,02 0,03 0,04 0,05 0,06 0,07 0 0,1 0,2 0,3 0,4 0,5 0,6 0,7 0,8 0,9 1
Ratio of vehicle mileage
Acc umul ated a ccide nts ( F SI) A1+A2 B1+B2 A3+A4 Southern Sweden Bare roads
Snow and ice
Figure 11 Accident rates and accumulated winter accidents for fatalities and severe injuries for Southern Sweden, winters 1993/1994–1996/1997. Data based on Niska (2006).
0 0,01 0,02 0,03 0,04 0,05 0,06 0,07 0 0,1 0,2 0,3 0,4 0,5 0,6 0,7 0,8 0,9 1
Ratio of vehicle mileage
Accum u lat e d acciden ts (F SI) A1+A2 B1+B2 A3+A4 Central Sweden Bare roads
Snow and ice
Figure 12 Accident rates and accumulated winter accidents for fatalities and severe injuries for Central Sweden, winters 1993/1994–1996/1997. Data based on Niska (2006). 0 0,01 0,02 0,03 0,04 0,05 0,06 0,07 0 0,1 0,2 0,3 0,4 0,5 0,6 0,7 0,8 0,9 1
Ratio of vehicle mileage
Ac cumula te d ac ci d e nts (F S I) A1+A2 B1+B2 A3+A4 Lower Northern Sweden
Bare roads
Snow and
Figure 13 Accident rates and accumulated winter accidents for fatalities and severe injuries for Lower Northern Sweden, winters 1993/1994–1996/1997. Data based on Niska (2006).
0 0,01 0,02 0,03 0,04 0,05 0,06 0,07 0,08 0,09 0 0,2 0,4 0,6 0,8 1
Ratio of vehicle mileage
Accu mu la te d acciden ts (F S I) A1+A2 B1+B2 A3+A4 Upper Northern Sweden
Bare roads
Snow and ice
Figure 14 Accident rates and accumulated winter accidents for fatalities and severe injuries for Upper Northern Sweden, winters 1993/1994–1996/1997. Data based on Niska (2006).
Figures 11–14 show that the accumulated accidents for the three southern regions are lowest for the A1+A2 roads, slightly higher for the A3+A4 roads and significantly higher for the B1+B2 roads. In Upper Northern Sweden it is quite the opposite, the unsalted roads have the lowest accident rates and the salted roads have approximately 40% higher values for the accumulated accidents. The effects of salting to keep the roads free of snow and ice in the winters are clearly demonstrated in the figures. The proportions of vehicle mileage on bare roads are as high as 90% to 96% on the salted roads in the two southern regions. In Northern Sweden the corresponding ratios are 91% and 81% for A1+A2 and A3+A4 roads for Lower Northern Sweden and 87% and 77% for Upper Northern Sweden respectively. The proportions for bare roads on the unsalted roads are 71%, 69%, 57% and 37% respectively.
Figure 15 presents the calculated accidents, given a vehicle mileage of 106 vehicle-kilometres, that are assumed to represent the additional number of accidents due to snow and ice covered road surfaces. The accidents are calculated based on the proce-dures presented in Figure 10.
0 0,005 0,01 0,015 0,02 0,025 0,03 0,035 0,04 0,045
Southern Sweden Central Sweden Lower Northern Sweden Upper Northern Sweden Accidents relat e d t o driv ing on snow and ice (F SI) A1+A2 A3+A4 B1+B2
Figure 15 Calculated number of accidents (FSI) related to driving on snow and ice road surfaces, grouped for climatic regions and maintenance classes.
Figure 15 clearly indicates that the numbers of accidents on snow and ice surfaces is lower for salted roads than for non salted roads in the three southern regions. The roads having the highest maintenance standard classes also have the lowest number of winter related accidents. This is explained by the low proportion of the vehicle mileage that is found on snow and ice surfaces on these roads. The high number of winter related accidents on the B1+B2 roads for the three southern regions can probably be explained by a fairly high proportion of vehicle mileage on snow and ice combined with some lack of awareness of the adverse conditions on the part of the drivers.
In Upper Northern Sweden the recorded accident relationships are quite different from what are found in the southern regions. The salted roads have a fairly high number of winter related accidents, while the numbers of accidents on the unsalted roads are signi-ficantly lower than in the rest of Sweden. A further discussion on the interpretation of these findings is presented later.
4.4
Accident rates versus road surface conditions
The findings of Wallman, 2001, presented in Figure 9, that the accident rates when driving on snow and ice increase when the proportion of vehicle mileage for snow and ice is reduced is confirmed by the present investigation. Table 2 shows that the highest accident rates are found for driving on snow and ice on the A1+A2 roads in Southern and Central Sweden where the proportion of vehicle mileage on snow and ice is only 4%. During that short period with snow and ice 40% of the severe accidents occurred during the winters. In a study from Iowa, Maze et al. (2005), it was found that 21% of the accidents took place on the 5% of the time the roads were covered with snow or ice. The knowledge of higher accident rates on snow/ice surfaces was the basis for the theory of the optimist/pessimist-model, Wallman et al., 2005. The principle of this model is presented in Figure 16. The optimist model assumes that if the proportion of vehicle mileage on bare roads is increased, the total number of accidents will be reduced
as this road condition has lower accident rate than snow and ice surfaces. The gain in accident reduction is represented by the red square named “a” in figure 16a.
The pessimist model takes into account that if the proportion of vehicle mileage on snow/ice surfaces is reduced, the accident rate will increase. There will thus also be an increase in accidents represented by the increase in the accident rate for snow and ice conditions. This effect is represented by the blue square, named “b” in figure 17b. The gain in accidents is still the area of the red square. The question to be answered when evaluating the effect on accidents by increasing the maintenance standard level is which of these two areas is largest.
Vehicle mileage in winter Vehicle mileage in winter
A c cide nt rate A ccid e nt ra te Bare road Snow/ice covered roads Bare road Snow/ice covered roads
The optimist model The pessimist model
a a
b
Figure 16 The principle of the optimist/pessimist models.
The data material assembled for the “Winter Model” makes it possible to calculate the expected total numbers of accidents for a given proportion of vehicle mileage,
Figure 17. The figure presents two assumed curves for accident rates. The upper curve is the relative rate for driving on snow and ice, and the lower curve, with a constant value equal to 1, is for bare road conditions. The left figure is based on vehicle mileage proportion equal to 0.3 on snow and ice surfaces and 0.7 for bare roads. The total number of accidents will thus be the area of the two squares.
0 1 2 3 4 5 6 7 8 9 10 0 0,1 0,2 0,3 0,4 0,5 0,6 0,7 0,8 0,9 1
Ratio of vehicle mileage
R e la tive accid e nt r a te
Accident rate for driving on bare roads Accident rate for driving on snow/ice surfaces
0 1 2 3 4 5 6 7 8 9 10 0 0,1 0,2 0,3 0,4 0,5 0,6 0,7 0,8 0,9 1
Ratio of vehicle mileage
R e la tive accid e nt r a te
Accident rate for driving on bare roads Accident rate for driving on snow/ice surfaces
Figure 17 Figures describing the principle of calculating the number of accidents for a specified proportion of vehicle mileage.
For the right hand figure it is assumed that by introducing higher maintenance standards it is possible to reduce the proportion of snow and ice surfaces from 0.3 to 0.2. The total number of accidents will in this case be the sum of the two squares in the right hand figure. The example presented in Figure 17 indicates that there is only a small gain in safety by increasing the winter maintenance standard. However, by improving the
maintenance standard there is of course a substantial increase in accessibility that also has to be taken into consideration.
The calculated accident rates for bare road conditions and snow and ice conditions are plotted as a function of the proportion of vehicle mileage, Figure 18. The figure in-cludes the values presented in Table 2 for the three maintenance standard classes and the four climatic regions. In addition, the regression lines for accident rates for driving on bare roads and snow and ice surfaces are presented.
The regression curve for the accidents related to snow and ice has the same pattern as found in Figure 9. The curve is however more gentle and has higher relative values for proportions between 0.15–0.5. There are three points that have a rather high influence on the regression curve and all are from Upper Northern Sweden, and they are marked with UNS and the maintenance class. If these three points are excluded the regression curve would be more similar to the lines presented in Figure 9.
The regression line for bare road conditions varies only slightly with the vehicle mileage proportion. To some surprise the curve has a maximum at proportion 0.3, but the maximum is not very distinct. This pattern of the curve is, however, highly in-fluenced by the point representing unsalted roads in Upper Northern Sweden, proportion 0.63. y = -0,1439x2 + 0,098x + 0,0211 y = 0,2792e-2,5374x 0 0,05 0,1 0,15 0,2 0,25 0,3 0,35 0 0,1 0,2 0,3 0,4 0,5 0,6 0,7
Ratio of vehicle mileage on snow and ice
Accid e n t rat es fo r fat a lit ies an d seve re in jured (F SI/ m ill-veh-k m) FSI-snow/ice FSI-bare road Poly. (FSI-bare road) Expon. (FSI-snow/ice) UNS-A1+A2
UNS-B1+B2 UNS-A3+A4
Figure 18 Calculated regression lines for accident rates when driving on snow and ice (blue line) and on bare roads (red line).
The data presented in Figure 18 makes it possible to establish a relationship between the accumulated accidents versus the ratio of vehicle mileage on snow and ice surfaces. The data points presented in Figure 19 are the accumulated accidents presented in Figures 11–14. The regression line is based on the data points presented.
The relationship between the accumulated accidents versus the proportion of vehicle mileage on snow and ice surfaces may also be established by the regression lines presented in Figure18. The blue, broken line in Figure 19 is made by adding the two products of the proportion of vehicle mileage and accident rates for bare roads and
snow/ice covered roads respectively. The calculated line based on this procedure and the regression line are almost identical.
0 0,01 0,02 0,03 0,04 0,05 0,06 0,07 0,08 0,09 0 0,1 0,2 0,3 0,4 0,5 0,6 0,7 0,8
Ratio of vehicle mileage on snow and ice
A c c u m u la te d a c c id e n ts , (F S I UNS-A3+A4 UNS-A1+A2 UNS-B1+B2 Calculated accidents based on regression lines
Regression line based on data points
y=0.0664-0.2917(x-0,3517)2
Figure 19 Accumulated accidents, given a vehicle mileage equal to 106 veh-km, from Figures 11–14 are presented by red dots, the calculated regression line based on the data points is the red line and the calculated accidents based on the regression lines in Figure 18 and procedures presented in Figure 17 are represented by the blue, broken line.
The regression lines in Figure 19 indicate that the highest accident rates are found for vehicle mileage proportions on snow and ice surfaces in the range of 0.3–0.4. It would have been interesting to perform the same procedure with the relative accident rela-tionships presented by Wallman (2005) in Figure 9. To carry out such a calculation accurately one needs to know the percentage of vehicle mileage that occurs on the different snow/ice conditions, black ice, loose snow and hard packed snow. These proportions differ between climate zones and maintenance standard classes. It is thus not possible to make such calculations accurately on the basis of the published data. The regression lines in Figure 19 must be used with caution. One should have in mind that all recordings are lumped into one figure regardless of differences in climates and road standard. However, if the regression curve in Figure 19 is correct, one should be careful of offering winter road standards with approximately 30–40% with snow and ice. If the climate is so moderate that unsalted roads end up with that proportion, salting has probably a positive effect on the number of accidents during the winter period. On the other hand, to perform salting on roads in very cold climates and then end up with proportions with snow and ice close to 30% would rather increase the number of winter accidents. In such cases the effect of unexpected and inexperienced driving in adverse driving conditions is still there, and the amount of traffic on snow and ice is so high that it really affects the total number of accidents.
4.5
Accident rate proportions versus summer/winter conditions
It is of great interest to compare the accident rates in the winter and summer seasons. The total numbers of fatalities and severe injuries for all Swedish national roads have been assembled from the accident statistics of SRA for the period 1 June 1993 to 31 May 1997, this includes the four winters of investigations for the “Winter Model Project”. The vehicle mileage for the summer and winter seasons has been estimated based on the same average daily proportion of vehicle mileage compared to AADT for each month used by Niska (2006):
October 0.988 November 0.890 December 0.805 January 0.761 February 0.837 March 0.888 April 0.976
Based on the length of the winter for each climatic region, the following proportions of vehicle mileage for the winter and the summer compared to the total annual mileage have been calculated:
Summer Winter
Southern Sweden 4 months 0.726 0.274
Central Sweden 6 months 0.570 0.430
Lower Northern Sweden 7 months 0.488 0.512 Upper Northern Sweden 7 months 0.488 0.512
The ratio of winter accident rates to the summer accident rates is then calculated based on the recorded accidents and the vehicle mileage proportions and the results for salted and unsalted roads are presented in Figure 20.
0 0,2 0,4 0,6 0,8 1 1,2 1,4 1,6
Southern Sweden Central Sweden Lower Northern
Sweden
Upper Northern Sweden
Acc
ident rate ratio, w
inter/s um m e r B1+B2 A1+A4
Figure 20 Ratios of winter to summer accident rates, fatalities and severe injuries grouped for salted and unsalted roads and climatic regions.
Figure 20 shows that for all regions the salted roads have higher accident rates in the winter than in the summer period, the ratio varying within 1.15 and 1.40. The corre-sponding ratios for the unsalted roads are 0.84 and 1.08. There is in addition a distinct tendency for the ratios to increase from Central Sweden to the north. A first glance at Figure 20 should result in the conclusion that introducing salt as a winter maintenance strategy will increase the number of accidents in the winter. One should be careful to make such a conclusion. The roads that are salted or not salted are not comparable since the traffic volumes and probably the road standards are different. It might be that roads having high traffic volumes and generally high traffic speeds would have experienced high winter/summer accident rate ratios even if they were not salted.
The data material makes it possible to calculate the accident rates for driving on bare roads in winter relative to driving in the summer. The basic inputs for such calculations are the accident rates and the proportion of vehicle mileage for bare roads as presented in Figures 11–14 and the ratio winter/summer accidents presented in Figure 20. The equation for the winter/summer accident rate ratio may be developed from the following assumptions:
Winter accidents= k Summer accidents
FSIRbare-winter · Rbare + FSIRsnow · (1-Rbare) =k · FSIRsummer · 1
This gives the following equation for the bare road accident ratio:
) 1 ( int int bare er w bare snow bare summer er w bare R FSIR FSIR R k FSIR FSIR − + = − −
Where:
FSIRbare-winter/FSIRsummer=The ratio of winter bare road accident rates to summer
accident rates for fatalities and severe injuries
k=Ratio of winter to summer accidents for fatalities and severe injuries Rbare= Proportion of vehicle mileage for driving on bare roads in winter
FSIRsnow=Accident rate for driving on snow and ice, fatalities and severe injuries
FSIRbare-winter=Accident rate for driving on bare roads in winter, fatalities and severe
injuries A1+A4 A1+A4 A1+A4 A1+A4 B1+B2 B1+B2 B1+B2 B1+B2 0 0,1 0,2 0,3 0,4 0,5 0,6 0,7 0,8 0,9
Southern Sweden Central Sweden Lower Northern Sweden Upper Northern Sweden R a ti o o f acci d e n t ra tes f o r b a re r o ad s, w in ter /s u m m e r
Figur 21 The ratios of accident rates for fatalities and severe injuries for driving on bare roads in the winter compared to driving in the summer.
Figure 21 indicates that the accident rates for driving on bare roads in winter are significantly lower compared to the accident rates in the summer period. Generally the winter/summer accident ratios for unsalted roads are lower than the corresponding ratios for salted roads. The ratios for unsalted roads vary within 0.48 and 0.64, and for salted roads the ratios are within 0.68 and 0.80.
The probable explanation for these low numbers is that average speeds in the winters, even when driving on bare roads, are lower, and that the reduction of the general winter speed is higher for unsalted than salted roads. The explanation for this effect might be that the drivers on the unsalted roads expect snow and ice to occur frequently and thus reduce their speeds even on bare roads in the winters, which results in generally lower accident rates on bare roads in the winter than in the summer.
On the salted roads the drivers probably expect that road conditions are sufficient for keeping almost the same speed as in the summers. The road users probably take advantage of the better road conditions by increasing the driving speed rather than the safety level. When the road conditions are adverse, the drivers are not able to adjust