MANAGING PROFIT ORIENTED
KEY PERFORMANCE
INDICATORS
A case study about how profit related KPIs can be managed in order to reach
and excel profitability goals.
Mälardalen University
School of Business, Society and Engineering Bachelor Thesis in Business Administration, 15 ECTS
Course code: FOA214 Tutor: Sikander Khan Examinator: Eva Maaninen-Olsson E-post: eva.maaninen-olsson@mdh.se
Date: 2016-01-08
Abstract
Date
8th of January 2016Level
Bachelor Thesis in Business Administration, 15 ECTSInstitution
School of Business, Society and Engineering, Mälardalen UniversityAuthors
Cirkic Majda & Ökvist AliceTitle
Managing Profit Oriented Key Performance IndicatorsExaminer
Eva Maaninen-OlssonTutor
Sikander KhanKeywords
KPI, profit, benchmarking, management, KPI management, SMART- criteria, AHP-theoryResearch Question
How can the use of key performance indicators be managed in order to increase profitability? Which profit oriented key performance indicators should a company focus on? Is there any situation when benchmarking may not be appropriate to use?Purpose
The purpose of this study is to gain a deeper understanding for how the key performance indicator tool can be used in order for an organization to reach or excel in its profitability goals. Providing a way of thinking when working with and selecting key performance indicators.Method
The foundation of the research is built upon existing scientific articles about KPI, KPI management and benchmarking. A case-study was then permitted on AA Logistik and the theories gathered from the secondary data was used in order to create relevant interview questions. Besides from in person interviewing, official statistics from the company was granted. In the end the gathered theories were used in order to analyze and draw parallels to the case study. Leading to conclusions answering the above stated research questions.Conclusion
Increase in profit is not generated by simply implementing a KPI program but depends on how those KPIs are managed. In order to increase profit it is optimal to have a supportive environment. Some KPIs are more relevant than others and those that should be focused on are the ones that provide the greatest insight in improvement opportunities. Which KPIs these are should be determined for every case per se. Benchmarking of KPIs can be a useful tool but it may not be applicable to every company.Acknowledgements
First of all we would like to thank our tutor Sikander Khan for guiding us through the whole process of this bachelor thesis. He helped us to develop and refine the research approach and kept us on track with his constructive critique and input.
We would also like to thank AA Logistik for letting us conduct a case study there and give special thanks to the CEO Nils Ökvist and CFO Caroline Ekblom, Saban Delic and Åsa Granlund, who made this thesis possible by their collaboration and openness. We are grateful for the trust and the
Table of Contents
Chapter 1. Introduction ... 1
1.1 Background ... 1
1.2 Research Area... 1
1.3 Purpose ... 2
1.4 Research Questions ... 2
1.5 Delimitations ... 2
Chapter 2. Theoretical Framework ... 3
2.1 What is a Key Performance Indicator? ... 3
2.2 Why use KPIs? ... 4
2.3 Goal Setting ... 5
2.4 Prioritization of KPIs ... 6
2.4.1 Analytical Hierarchy Process ... 6
2.4.2 AHP-SMART Approach ... 7
2.5 Knowledge Management ... 8
2.5.1 Managing through Measures ... 8
2.5.1.1 KPI Management ... 9
2.5.1.2 Supportive management ... 9
2.6 Benchmarking ... 10
2.6.1 Internal versus External Benchmarking ... 10
2.6.2 Why use Benchmarking? ... 11
2.6.3 How to benchmark ... 11
Chapter 3. Methodology ... 13
3.1 Research Design ... 13
3.2 Research strategy ... 14
3.3 Choice of Research Strategy... 15
3.3.1 Choice of Case Company ... 15
3.4 Empirical Data ... 15
3.5 Reliability, Validity and Ethics ... 16
Chapter 4. Case Study ... 18
4.1 AA Logistik ... 18
4.1.2 History ... 18
4.2 The Company Today ... 18
4.2.1 Benchmarking Today ... 19
4.3.1 Occupancy per Vehicle (in time) ... 20
4.3.2 Income/Working Hour per Cost-Center ... 21
4.3.3 Errand /Customer Service per/Week/Person ... 21
4.3.4 Number of Piece Picking a Month/Worker and in Total ... 21
4.3.5 Occupancy (Income/𝑚
2) ... 22
4.4 Deviation Management ... 22
4.5 Future Vision and Budget ... 23
4.5.1 Logistic Center ... 23
4.6 Pricelist ... 23
Chapter 5. Analysis ... 24
5.1 When to use KPIs ... 24
5.2 Increasing Profit by KM of KPIs ... 24
5.3 Managing through Measures ... 25
5.4 Increasing Profit by Supportive Management ... 26
5.5 Deriving and Setting Goals for KPIs ... 26
5.6 Prioritizing KPIs ... 27
5.7 Is Benchmarking a Suitable Tool to Use for Every Company? ... 28
Chapter 6. Conclusion ... 30
6.1 How Can the Use of KPIs be Managed in Order to Increase Profitability?... 30
6.2 Which Profit Oriented KPIs Should a Company Focus on? ... 30
6.3 Is There Any Situation when Benchmarking May Not be Appropriate to Use? . 31
6.4 Future Studies ... 31
References ... 32
Appendix 1 – Interview Questions ... 34
Table of Figures
Figure 1 - SMART criteria: ... 5
Figure 2 - integration of AHP and SMART criteria:. ... 7
Figure 3 - steps in AHP/SMART integration. ... 7
Figure 4 - research design ... 13
Figure 5 - main steps of qualitative research. ... 14
Figure 6 - price list ... 23
List of Tables
Table 1 - Theoretical framework linked to interview questions ... 16
Abbreviations
AHP
Analytical hierarchy process
CEO
Chief Executive Officer
CFO
Chief Financial Officer
KM
Knowledge management
KPI
Key Performance Indicator
PM
Performance measurement
1
Chapter 1. Introduction
1.1 Background
Key performance indicators (KPIs) are a well-known concept that has been used within businesses and organizations around the world for a long time. It is used to measure and/or compare performance to see if they are meeting the strategic or operational goals that the company has set (Shahin & Mahbod, 2007). Browsing the Internet and databases such as ABI and Emerald Insight shows that KPIs still are a current subject and many articles have been written about specific KPIs. However not much was found regarding the subject of specifically working with KPIs linked to profitability and profitability goals. Feedback and goal setting has previously been shown to enhance productivity. The theory of goal setting claims that challenging and clear goals lead to better performance than compared to not having any goals or having goals that are unclear or easily attained (Shahin & Mahbod, 2007).
However, through a literature review it is understood that there is no standardized method to determine the relevance of a company's KPIs in comparison to each other (Shahin & Mahbod, 2007).
AA Logistik AB is a Swedish logistic and storing company that currently works with the KPI measuring tool within the company. They have several key performance indicators concerning different departments. One of the categories that they sort their KPIs in is their direct connection to profitability. Today they have several key performance indicators within this category and a few that they have concluded to be the more important than others. Even though these judgements have been made, it is unknown which of these top KPIs have the greatest impact on profit and there by which prioritization those KPIs should have. Since this is not known it is also unknown how the KPIs should be managed in order to efficiently increase profit. This existing problem in combination with the KPI system already in place and existence of information such as budgets and existing goals makes the company a good fit for further analysis concerning profit related KPIs.
1.2 Research Area
The following thesis concerns the area of management. More specific the management of profit oriented key performance indicators. Topics such as benchmarking and KPIs will be discussed and analyzed in relation to profit. Also the area of knowledge management will be briefly touched upon when it comes to how to make use of the information derived from KPIs.
Theoretical framework regarding benchmarking and KPIs will be collected from existing research articles. Further research will then be conducted in the form of a case study at AA Logistik AB. Data will be collected in order to permit calculations on these KPIs effect on profit. The research will also include how to manage this gained information in order to efficiently increase or maintain profit.
Here the reader
is introduced to the research area, the company the research is conducted at and the research
2
1.3 Purpose
The purpose of this study is to gain a deeper understanding for how the key performance indicator tool can be used in order for an organization to reach or excel in its profitability goals. Providing a way of thinking when working with and selecting key performance indicators.
1.4 Research Questions
● How can the use of key performance indicators be managed in order to increase profitability? ● Which profit oriented key performance indicators should a company focus on?
● Is there any situation when benchmarking may not be appropriate to use?
1.5 Delimitations
Because of the time constraint and recommended size of the thesis the following delimitations have been made:
The study only concerns KPIs linked to profitability. The study does not take into consideration KPIs derived from other company goals.
The thesis focuses mainly on measurable financial key performance indicators. It ignores other factors and KPIs that might have an indirect effect on profitability.
A case study has only been undertaken at one company and therefore does not provide a generalization of which profit related KPIs should be considered the most relevant, or how these should be managed. It works more as an example of how a company can evaluate their financial KPIs related to impact on profit.
3
Chapter 2. Theoretical Framework
2.1 What is a Key Performance Indicator?
KPI is the abbreviation for key performance indicator. Key performance indicators is as it sounds, a measurement system that measures performance. It is however not a performance in itself but solely an indicator of performance. Measurement systems are keeping the score but the improvement in performance comes from efficient practices and actions. This means that in order to improve one needs to change what they are doing or increase the efficiency in execution. Although measurement by itself does not bring value it can encourage the changes that are necessary for value creation. (Bourne, 2008). According to Kaskinen (2007, p30) “… a KPI program enables a company to measure current performance against goals and benchmarks to understand the organizations strengths and where it’s falling short.”
Shahin & Mahbod (2007) emphasise that it is also important to clarify the difference between KPIs and goals. KPIs should be derived from organizational goals but as mentioned, they are still only indicators. Shahin & Mahbod (2007) give the example of an organization which has as a goal of having the highest profitability within their industry, will have KPIs measuring profit linked to financial indicators. The indicators measure the development in achieving the goals that they are derived from.
Wolfskill (2007) writes about that using KPIs within revenue cycles since documenting ongoing performance has turned in to a standard method. Bourne, (2008) also mentions that it is common for many companies to have both extensive and large KPI reports.
This chapter contains a description of the basics of KPIs, benchmarking and management concerning
measurements and knowledge. It also contains research already conducted on the area of KPI prioritization, how
KPIs should be designed and arguments for why they should be used. Management theories for how KPIs efficiently
should be implemented will also be briefly described.
4
2.2 Why use KPIs?
“…performance management systems, KPIs etc., are organizational systems of great significance for
creating corporate performance. Glories of successful corporate transformation using these systems have been well documented and studied in depth.” Prabhu & Heade (2012. p121)
According to Kaskinen, (2007) it is common knowledge among all management accountants that running operations efficiently is fundamental in order to get the organizations fiscal departments straight. Real-time visibility, effective cash flow management and control is needed for the payments, financial commitments and cash flow in order to understand the company’s situation at any point in time.
Wolfskill (2007) mentions that even though the implement of a KPI initiative may seem difficult it can produce serious results. Kaskinen (2007) puts pressure on the point that it is hard to improve what cannot be measured. Therefore, since KPIs enable one to measure performance the system can also be a tool for continuously improving financial activities and profit. Because the KPI measurement system makes it possible to measure the performance at its source, it allows for tracking changes, review business cases and to more objectively estimate performance standards. Such a system makes it possible to discover early warning signs and thus conduct root-cause analysis on discovered problems. This contributes to lessening the risks for the organization. A KPI program in combination with a focal point on process improvement can be a resourceful tool that brings significant results. In all a KPI program enables for a greater insight, control and real-time visibility that can be of help in achieving a greater operational efficiency. Both Wolfskill (2007) and Kaskinen (2007) argue that the KPI measurement system can be used in order to identify improvement opportunities. According to Kaskinen (2007) measuring good performance also allows for positive feedback to be brought back to the right departments and individuals. This information makes it easier for those departments to maintain their achievements and even helps to motivate for improvements.
The Hackett Group (Kaskinen, 2007) also states that finance departments that are measuring their performance extensively are producing much better results when it comes to improvements in productivity and decrease in costs. They are also benefitting from improved customer service and quality. Best-in-class organizations are always committed to continuously improve their financial performance. They never stop reaching for excellence and they understand that control and knowledge of their financial position is crucial for financial health and the ability to create improved business decisions. Once an outstanding organization has reached its goals they usually advance their goals or search for new fields in which they can improve. Outstanding organizations use KPIs in order to better their low performance and enhance their positive results on a continuous basis.
5
2.3 Goal Setting
As mentioned before an organizations’ KPIs should be derived from their goals. One of the first things an organization should determine is their goals. Goal setting theory implies that challenging and clear goals gives a better performance outcome than easily attained, modest or unclear goals or lack of existing goals. It has been proven that feedback and goal setting improves productivity. Many benefits can be derived from goal setting but mainly setting clear goals secures that the work gets done and by the time that it needs to be done (Shahin & Mahbod, 2007).
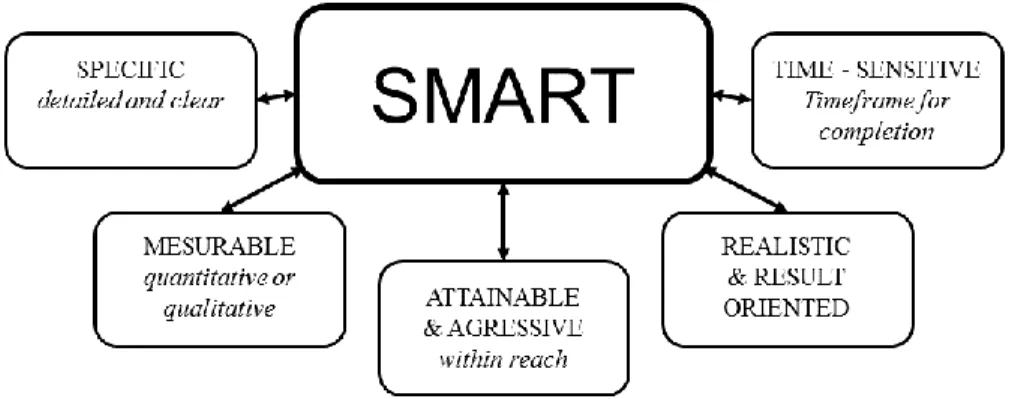
Goals can be designed in different ways and there are some characteristics that differs in what is considered as a good goal from a poorly designed goal. Typically, goals are not wanted to be loose, too broad, vague, ambiguous or unrealistic. What is estimated as good goals on the other hand, typically follows what is called the SMART-criteria (Shahin & Mahbod, 2007) which is summarized in Figure 1. The figure below provides an overview of the common criteria of qualitative and SMART goal setting.
The SMART-criteria emphasizes that good goals should be the following:
Specific and as clear and detailed as possible. This makes it easier to hold people accountable for their
actions. Each goal should also be Measurable in a qualitative or quantitative manner, set against standard performance and expectations. In this way it gets easier to determine if the targets have been reached.
Attainable and aggressive goals is also something to strive for. The goals should be within reach and be realistic and result-oriented but at the same time still challenging and not too easy. Having realistic
goals is also helpful when selecting KPIs. Last but not least, goals should be time-sensitive. They should have a limited time-span for completion. This will supply a structure and facilitates the overseeing of progress (Shahin & Mahbod, 2007).
Figure 1-SMART criteria:
6
2.4 Prioritization of KPIs
Shahin & Mahbod (2007) talk about how many organizations today have a high number of KPIs in different departments. This is a consequence of businesses having to operate in a consistently changing and heavily competitive market, with a massive price pressure and shrinking budgets. This has resulted in many scholars suggesting that there should be an improvement in the traditional methods of determining and prioritizing KPIs. The reasons for prioritizing KPIs are many and differing. For example, which type and number of KPIs that an organization chooses can depend on the complexity and size of the organization. It may not be suitable to invest in, analyze and improve all of an organizations KPIs. Doing so might be both inefficient and costly and therefore the prioritization of KPIs becomes important. Shahin & Mahbod (2007) point out that the issue of prioritizing KPIs should be looked upon as a decision making and multiple priority problem for the sake of minimizing risks related to goal settings. Despite of this, according to Shahin & Mahbod (2007) literature reviews show that there have been limited efforts in designing a standardized method for KPI prioritization. However, several ways of determining and prioritizing KPIs have been suggested.
In the following sub-section, the AHP-SMART method for prioritizing KPIs will be explained. Shahin & Mahbod (2007) mean that the approach is supposed to provide a greater picture when it comes to analyzing KPIs and benchmarking. It can aid managers in arranging and keeping a proper competitive plan for current and future improvements. What is also important to mention is that since the approach only is used for prioritization, it assumes that existing KPIs already are of importance. If the goal is to discover which KPI is the most important then the prioritization makes this possible. A relevant limitation of the approach is however that guidance in handling insufficiencies is not provided.
2.4.1 Analytical Hierarchy Process
AHP stands for Analytical Hierarchy Process and is a measurement theory for handling intangible and quantifiable criteria. It is a framework for problem-solving and can be used as a representation for the different components for any problem. The framework is built upon the principles of parallel judgement, decomposition and the organizations combined priorities (Shahin & Mahbod, 2007). According to Ishizaka, Balkenborg, & Kaplan (2011), the AHP is a very reliable tool for decision making since it determines the highest and lowest priorities and allows managers to make decisions without firmly overriding the original unsettled choice.
Shahin & Mahbod (2007) write that, when using AHP one usually starts by structuring top down. This means to start with constructing an overall goal and then specify the components that have a negative or positive impact on reaching the goal. After the top-down structure has been made a comparison
analysis should be done. This is commonly done in a bottom-up manner and a pairwise comparison is
made concerning the connected items originating from a certain node, in order to construct range priorities for every node. When enough comparisons have been conducted for one node the comparison matrix principal eigenvector is standardized and it turns into the ratio measure for the corresponding importance of every item. Since these priorities show the corresponding importance for each range node, they are referred to as local weights. The last step that needs to be executed is to “aggregate the local
weights into a composite priority” (Shahin & Mahbod 2007, p230). By this it is meant to multiply all
higher-level priorities with the local weights in order to turn the local weights into what is called global weights. The global weights measure the relevancy of every node in the whole hierarchy. They can be added up for a distinctive alternative in order to provide a combined priority that measures the fusion
7
impact of all criteria. Then the alternative that has the highest combined weight is considered to have the highest priority.
2.4.2 AHP-SMART Approach
The AHP-SMART approach is the integrated approach of the AHP-method and SMART-criteria. It is a method for prioritizing KPIs and evaluate which are “more SMART” than others, suggested by Shahin & Mahbod (2007, p237). The approach can be used in order to select KPIs on these bases so that if KPIs are managed to reach improvements, they can determine where to put the most effort.
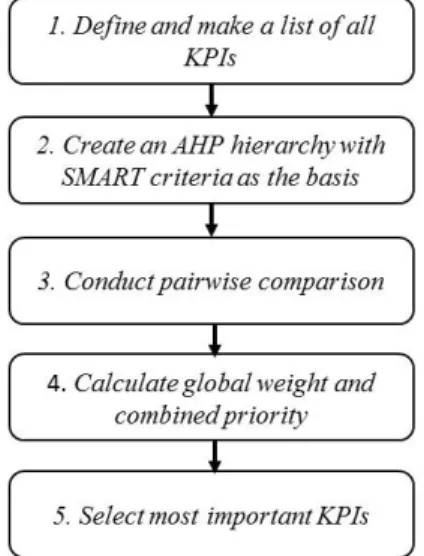
This approach is started by defining and listing all the KPIs. After that an AHP hierarchy is built where the aim is to create a prioritization of the different KPIs in respect to the SMART-criteria. Then the pairwise comparison of the different KPIs is conducted with weight on those SMART-criteria that are most relevant for the organization and its goals. The local weights and the global weights are calculated in order to estimate the combined priority. At last the KPIs which are the most relevant in reaching the organizational goals are selected (Shahin & Mahbod, 2007). In Figure 2 it is illustrated how to structure an AHP hierarchy using the SMART criteria as a basis and Figure 3 shows all the steps in the integrated AHP-SMART method used in order to determine the most relevant KPIs.
Figure 3- steps in AHP/SMART integration.
Source: Created by authors, inspired by Shahin & Mahbod (2007, p231).
Figure 2 - integration of AHP and SMART criteria
8
2.5 Knowledge Management
As mentioned earlier KPIs in themselves bring no value but only information in the form of indicators, it is the changes related to that information that can create value. Knowledge management is something that has existed for more than thousand years but not until recently been put into spotlight (Haron, 2015). Randeree, (2006) gives the explanation of KM (knowledge management) as the management of information, data and knowledge within an organization in order to achieve a competitive advantage. According to del-Rey-Chamorro, Roy, van Wegen & Steele (2003) KM makes it possible to estimate predictions and associations and conduct detailed decisions. Both Randeree (2006) and del-Rey-Chamorro et al (2003) imply that knowledge should be considered as an intangible resource and that KM-leveraging of knowledge resources help organizations to reach their goals. Del-Rey-Chamorro et al (2003) also define KM as a management tool that enables an organization to become more competitive through the increased productivity and better decisions resulting from the KM. They also emphasizes that the knowledge created in an organization should be used for future purposes to increase the performance of business processes. Knowledge management is something that should be used when designing KPIs and KPIs can in turn justify future investment projects within KM.
2.5.1 Managing through Measures
PM (performance measurement) systems are considered as key factors within businesses. They allow for managers to monitor the key issues of their organizations, provide them with the most important information and give an overview on how the organization is performing. Except from making it possible to monitor business performance in relation to the organizations objectives, it can also in combination with benchmarking show the performance in relation to other similar organizations (del-Rey-Chamorro et al, 2003). Despite this, according to Bourne (2008, p69) the following condition is often the case:
”Most organizations do not know how to manage with the measures that they have. Many measurement charts show initial improvements followed by setbacks, with no consistent direction or trend. Most companies simply focus on poor performance when it becomes apparent.”
Bourne, Kennerley & Franco-Santos, (2005) state that measures should be in alignment with strategy and organizational systems such as the budget. The burden of collecting data should also be kept low and the integrity high. When dealing with PM the number of measurable actions should try and be reduced into a manageable size related to the organizations process characteristics (del-Rey-Chamorro. et al, 2003). Even though it might be possible to measure over a hundred metrics it is not functional to put focus on so many measures at one point in time. The organizations financial goals and where the biggest strategic benefits can occur should be considered instead (Kaskinen, 2007). Researchers (del-Rey-Chamorro et al, 2003) suggest that top measurements should be selected related to their usefulness and importance. These will become the organizations KPIs.
9
2.5.1.1 KPI Management
According to Wolfskill (2007), measuring loads of information is not the way to go. He suggests starting with examining what is currently being measured and reported. Then categorize those measurements as either process or financial KPIs. A KPI program that is successful and uses both process and financial KPIs makes it possible for employees and revenue cycle leaders to target both improvement needs and results. If meaningful KPIs are selected there will be an incentive to use related results in order to drive change of performance within the revenue cycle. Also, keeping a focus on central issues holds the scope manageable.
The collection of KPIs can be edited in order to fit specific processes or degrees and to contribute relevant information in accordance with user needs (Kaskinen, 2007). A single KPI in itself does not provide thorough view of total situation. Therefore, performance management programs should put focus on several factors, of which one is strategic alignment. Various factors which have a possible impact on a KPI should also be measured. When selecting KPIs it is important to make sure it is KPIs that can be acted upon since the whole purpose of the program is improvement. It should be determined which KPIs that align best with the organizational goals and will have the greatest impact on the business. When this is determined the KPIs should be prioritized (Kaskinen, 2007).
When initiating a KPI program current processes should be measured against the KPIs to identify where the organization stands on all indicators at the present time. After the program has been implemented, considerations about how it can be further developed should be made. KPI programs should be reviewed at least once a year and when striving for continuous improvement the following should be considered: “Once you’ve achieved some of the benchmarks you’ve established, where do you go from there? Do you want to further improve the KPIs you’ve selected, or do you want to choose new or additional ones?” (Kaskinen, 2007, p33). It is also important to highlight poor performance and conduct a root– cause analyze to make sure that the poor performance does not continue. When progress has been reached for individual KPIs, considerations regarding linking together processes that are related could be a good idea (Kaskinen, 2007). According to Wolfskill (2007), in time, as processes change so will also the need for certain KPIs. Do not hesitate to add meaningful KPIs and remove or modify the reporting of those that aligns with the best practice results as processes improves.
2.5.1.2 Supportive management
From the start it needs to be explained to employees how the calculations for every KPI will be committed, what every KPI means for their segment and how they will be used in order to find improvement opportunities. If communicating KPIs on a continuous basis fails it will insinuate to employees that management does not value the KPIs (Wolfskill, 2007). Bourne (2008) also writes that it is relatively easy to engage cooperative people within an organization in measures but much harder to engage the entire organization in performance. Which is a reason for why organizations are not reaching better performance.
According to Haron (2015) the financial goals of a company are very much dependent on the accurate understanding and communication through the whole firm, related to the organizations strategic objectives. This assumes a creation of and care for a healthy organization-wide environment. If this environment does not exist the organization will not be able to aid the support system needed to turn the
10
KPIs into reality within the whole organization. Key drivers are commonly located within lower levels of an organization but constructed at the upper levels. Upper levels should want to include lower levels in decision making and discourage a, us versus them way of thinking. Haron (2015) means that only through a complete involvement of all levels within the organization in constructing the metrics and implementing the measures, performance management will be optimized. This is because everyone will possess the knowledge of what it is that is being measured and most importantly why.
2.6 Benchmarking
According to Julien (1993), benchmarking is considered to be one of the most powerful strategies for a business to use. Benchmarking can be used in any organization of any size, in any industry. So what is benchmarking? What does it mean?
In an article Murray, Zimmerman & Flaherty (1997) say that benchmarking can be seen as a course of action that companies take to target main areas to be able to improve their business in such way that they increase quality, productivity and competitiveness. There are different ways of using benchmarking as a tool in management. For instance, it can be used as “peer-group benchmarks”, which is used to compare a company with other companies that are similar. In “internal operations benchmarks”, you use it to compare different departments within the company. When it comes to” top competitor
benchmarks”, it is used to compare a company with other companies in the same industry, and last but
not least there is the “best in class benchmarks”. It is used to compare a company with the best performing companies no matter the industry.
2.6.1 Internal versus External Benchmarking
Southard & Parente (2007) think that internal benchmarking can be more beneficial than compared to external benchmarking. One advantage is that it is much easier to access information within a company. Not being able to access a target company’s information is considered to be one of the major disadvantages with external benchmarking. Since the target company may fear that if they share the information they will lose their competitive advantage, thus they can be reluctant to give it away. Another advantage with internal benchmarking could be that it is easier to transfer knowledge from one department to another department than implementing a whole new corporate culture. The drawback with doing an external benchmark and implementing a new culture is that one culture that works for one company might not work for other companies (Southard & Parente, 2007). A thing to keep in mind when implementing a new culture according to Julien (1993, p26) “– with the full understanding that it is adapting them, not adopting them. No single best practice works for everyone.” Another issue is that your employees might become resistant to change. Jones (2013) explains that resistance to change occurs when a new culture which the employees do not feel comfortable with is implemented. When this happens a restructuring process is needed. This is a process where the managers change assignments and power relationships in order to change the organizational structure and culture to improve the effectiveness of the organization.
11
2.6.2 Why use Benchmarking?
Landeghem & Persoons, (2001) write that comparing results with benchmarking data makes it easier to detect gaps within the organization, this in turn leads to action being taken. It also gives them valuable advice and a deeper understanding when it comes to which departments need to be improved and how to implement these changes. Managerial actions can be taken by looking at the audit to be able to increase performance where it is needed. It will also show you what opportunities you have. The audit suggests which of the performances are insufficient in comparison to the benchmark data. It also shows companies where best practices are used insufficiently. With this information the company can decide what kind of actions they need to take according to their budget, vision and strategy. It has also been stated in a journal by Southard & Parente (2007) that cost savings could be achieved by using internal benchmarking.
According to Murray et al (1997) in order to use internal benchmarking, companies can start by determining the best performing departments in the company. Then move on to analysing the departments’ practices and strategies to see which of them performs the best. When these approaches have been determined and assessed, the next step is then to implement the strategies that are used in the high performing departments to the departments where they are less effective in order to boost their performance.
Julien (1993) mentions that one other reason for using benchmarking is because the audit process is demanding more value. More reasons might be to improve competitiveness, profitability, helping your colleagues accomplish their best performance, and using these opportunities to improve the company as a whole on a continuing basis.
Julien (1993) states that another critical thing when it comes to auditing viability when speaking long term is that auditors benchmarking knowledge provides them with the know-how and skills needed to assist, introduce and improve relevant benchmarking efforts across the whole company. Their research abilities and better knowledge of opportunities have been heightened, thus they will be better at adapting the best practices to their organization from other companies.
In an article O’Mara (1999) states that knowing more about the competition and comparing companies can help organizations see if they are on the right path or not, in addition to that it can give ideas on how to develop the company and make it more profitable. Becoming more aware of accurate costs, benchmarking will prove to be more effective, decision making on information you have got from benchmarking will become easier once you have a long-term business plan as a guide.
2.6.3 How to benchmark
According to Murray et.al. (1997) there are four steps in the benchmarking process. The first step is to do an analysis of the organization, its performance, procedures and practices. Setting a starting point and moving forward to improve the goals. The next step is to choose a benchmark or a number of benchmarks. The chosen benchmark could be a department in the company or it could be a company that is a competitor who is performing better that the organization would like to compare itself to. This particular step is important, because if choosing the inappropriate benchmark or benchmarks the outcome of this might lead to choosing the wrong strategy and have unrealistic goals for the company.
12
The third step involves having precise information about your benchmarks, the practices and the procedures. All of this information needs to be compiled and shared. The last step involves the analysis of the information compiled in the prior step to decide what policies and which strategies your benchmark that can be implemented at the company. At this stage it is substantial to be able to evaluate the company objectives and goals in a way that it is exact enough to be suitable but not having that many goals so that it prevents your goals from being managed.
13
Chapter 3. Methodology
3.1 Research Design
The research design shows the framework for the data-gathering and analysis. There are several ways of structuring a research design (Bryman & Bell, 2015). For this paper a single organization case-study approach has been chosen. A case study can consist of a combination of elements and this design can be seen as a combination of a representative and revelatory case. It seeks to exemplify and through an inductive approach reveal how estimations and evaluations can be made concerning a common tool within businesses (Bryman & Bell, 2015). The stated case-study method was chosen because it allows the retrieving of in-depth quality information regarding the subject in order to answer the research questions. It also makes it possible to create an analysis that can work as an example for similar organizations and situations.
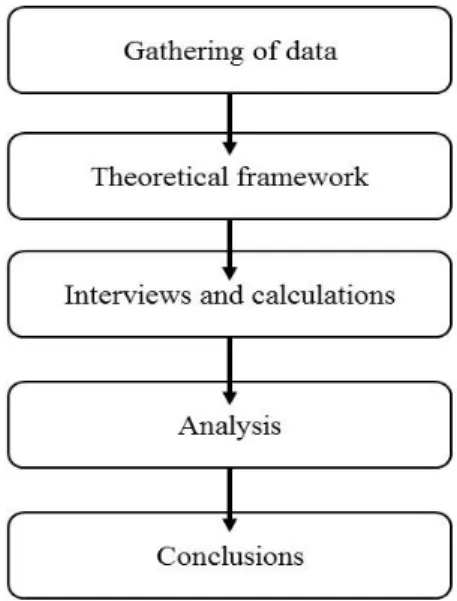
Figure 4 shows the research design and the different steps in order to reach conclusions. First an unstructured interview with AA Logistik was held to gain an understanding of existing problems and development opportunities within the company. Then a literature review and the construction of research questions was inductively created. The relevant theoretical framework was put together and information, interviews and statistics gathered from the company. After that calculations were conducted from the gathered information and finally an analysis was made connecting the findings to theories and concepts in order to reach one or several conclusions.
Figure 4 - research design
Source: Created by authors
In this chapter the methodology and methods used when gathering necessary information are explained. Other
things being discussed are the research strategy and empirical data. Also the validity, reliability and ethics.
14
3.2 Research strategy
When conducting research there are two main strategies that can be used. Those are quantitative or qualitative. Quantitative i.e. a deductive research can be seen as a relation between research and theory, in this approach the importance lies on testing the theory. When it comes to qualitative research the importance lies on words and not in the quantification of the information collected. This is often connected to an inductive approach. When it comes to an inductive approach concepts and theory are on the other hand usually used in order to organize and reflect on the collected data. (Bryman & Bell, 2015).
Cooper & Schindler (2014) break it down even further and explain the differences like this. A quantitative research approach within business normally tries to measure the “consumer behavior, knowledge opinions and attitudes” as exact as possible (Cooper & Schindler, 2014, p146). The most common way to conduct a quantitative study is by constructing a survey. When using the quantitative research approach, there are three different focuses that can be taken. These focuses can be descriptive, explanatory and/or predictive. The descriptive study answers questions like who? how? when? Explanatory study takes it even further and tries to explain why situations occur. When it comes to the last one, which is the predictive study, the purpose is to try to predict when and in which occasions something might occur. The aim of the research is commonly to describe or try to predict an outcome by building and testing theory using a large sample.
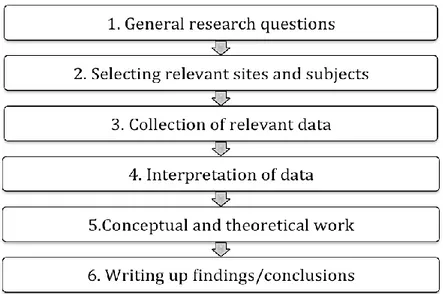
As for the qualitative research, Cooper & Schindler (2014) state that the focus lies on getting a deeper understanding of the case at hand, to understand why and how things occurred in the way that they did. They explain that the research purpose should be in-depth and understanding. That theory is built using a small sample. Qualitative research data can be drawn from multiple sources, them being: People, they might be individuals or they could be groups or you might use organizations or institutes instead of people. Published texts are also a good source of information. Other sources might even be environments and settings or the use of events and happenings. According to Bryman & Bell (2015), the following main steps should be taken in a qualitative research:
Figure 5 - main steps of qualitative research
15
3.3 Choice of Research Strategy
When conducting the research of checking which strategy that is the most appropriate to use in this case, the question whether it should be a qualitative or quantitative approach arises. The conclusion that the qualitative research strategy was the most appropriate was reached. This is because the aim of the thesis is to gain a deeper understanding of the case and shed light on the topic of profit oriented KPI management. The qualitative research strategy allows for deeper studies and firsthand information which makes it possible to answer the stated research questions. A quantitative approach on the other hand would have only contributed with statistical information and therefore made it harder, if not impossible to answer the set of research questions.
3.3.1 Choice of Case Company
The choice of case company was made due do convenience and suitability. AA Logistik already had established KPIs linked to profitability which were suitable for further investigation. Personal contacts within the company also made it possible to retrieve and take part of information that otherwise would have been hard to obtain. For example, information of the company’s communication plan and future goals were given, in trust that important details would not be exposed to competitors. The fact that AA Logistik is located in Västerås, near the MDH School for whom the thesis was written also made it possible to establish continuous contact.
3.4 Empirical Data
To get the necessary data, both primary and secondary information were used. For the primary data, interviews have been conducted with AA Logistik. The interviews were held with the CFO and CEO on a continuing basis, but also one interview with each employee that is responsible for the specific KPIs at question has been conducted. All interviews were of a qualitative in person approach. That is, a combination of structured and unstructured interviewing. In the beginning the concept of profit related KPIs was discussed and questions asked were more general. The information gained from these interviews were written down manually. As time went by the questions became somewhat more structured and focused, but never fully reached a structured form of interviewing. The last interviews conducted was the most structured ones and also worked as a summary of what had been discussed during previous interviews. This interviews was recorded, then transcribed and later translated into English. In Appendix 1 is the added questionnaire containing the more structured questions. In Table 1 below it is illustrated which questions are built upon which chapter from the theoretical framework.
Theoretical Framework Interview Questions
2.2 Why use KPIs 1, 13
2.3 Goal Setting 8, 21, 22, 23, 25
2.4 Prioritization of KPIs 1
2.5 Knowledge Management 2
2.5.1 Managing Through Measures 2, 13
2.5.1.1 KPI Management 2, 9,
2.5.1.2 Supportive Management 2, 10 11, 13, 19, 20, 22, 25
16
2.6.1 Internal vs External Benchmarking 4, 5, 6
2.6.2 How to Benchmark 4
Table 1 - Theoretical framework linked to interview questions
The CEO, CFO and employees’ comments and thoughts will be explained in the case study. Access to official statistics was also granted, such as current budget, future budget and existing KPIs related to profit. Other information such as prices and accounted costs for working hours that can be used for analyses and calculations have also been granted.
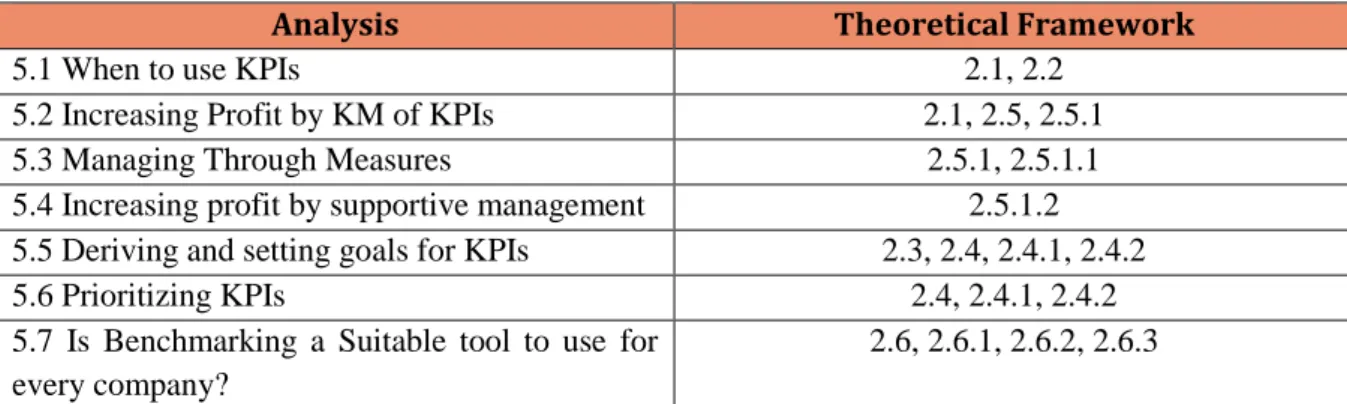
For the secondary data, a literature review was conducted and a theoretical framework gathered from the summarization of relevant business research articles. The articles were collected through searching different databases on the internet such as ABI, Emerald Insight and Google Scholar. Other websites used as a source of information are www.aalogistik.se and www.aabolagen.se. The compiled concepts and theories lay the basis for the research and were used in order to evaluate and analyze the case study. Which theoretical parts that were mainly used for each section of the analysis are illustrated in Table 2 below.
Analysis Theoretical Framework
5.1 When to use KPIs 2.1, 2.2
5.2 Increasing Profit by KM of KPIs 2.1, 2.5, 2.5.1
5.3 Managing Through Measures 2.5.1, 2.5.1.1
5.4 Increasing profit by supportive management 2.5.1.2 5.5 Deriving and setting goals for KPIs 2.3, 2.4, 2.4.1, 2.4.2
5.6 Prioritizing KPIs 2.4, 2.4.1, 2.4.2
5.7 Is Benchmarking a Suitable tool to use for every company?
2.6, 2.6.1, 2.6.2, 2.6.3 Table 2 - Theoretical framework connected to the analysis
3.5 Reliability, Validity and Ethics
For the results of a study to be repeatable they should be reliable. It is more common for reliability to be a problem concerning quantitative research than qualitative (Bryman & Bell, 2015). This study is considered to be reliable since it is committed by a third party and based on in depth observations and calculations on firsthand information connected to relevant theories and concepts. The use of the company's official statistics should also contribute to the results reliability. Research methods such as interviews will probably be affected by the interviewees’ knowledge of being studied. Unobtrusive measurements on the other hand were examined without interaction and therefore will not be affected in the same way. Arguments that official statistics can be misleading and the validity questionable exist. However, those arguments are mainly related to social science and government agencies. Official statistics gathered directly from companies are considered more valid and reliable (Bryman & Bell, 2015). To ensure the validity of the semi-structured interviews, that no misconduct regarding fabrication of results has been permitted or information gotten lost in translation. The translated version of the questionnaire and case study has been proof read by the CEO.
That the research was conducted in an ethical way was also something that needed to be considered. Questions like was there any “harm to participants”, “lack of informed consent”, “invasion of privacy” or if any “deception is involved” should be asked (Bryman & Bell, 2015, p134). Even if there was a risk
17
for harm to come to non-participants could be taken into consideration (Bryman & Bell, 2015). However, this research was mainly based upon official statistics and the interviews were not of a personal matter and there was no indication found of them resulting in a bad outcome for either the participants or non-participants. Therefore, there seems to be no ethical issues within this specific research conducted.
18
Chapter 4. Case Study
4.1 AA Logistik
AA Logistik is a logistic, packaging and storing company, located in Västerås in Sweden. Offering not only the transfer of products but also customized logistic solutions. Handling the processes from retrieving products at its starting point, until delivered at the final location. The company's goal is to be the best within the industry and by that they mean to have the highest customer satisfaction, highest
employee satisfaction and the largest profitability (www.aalogistik.se, 2015).
4.1.2 History
AA Logistik is a family owned business, owned by the family Edmark and is a part of the AA companies. The AA company is one of Sweden's largest businesses within the transport sector and was founded the year 1872 by Anders Andersson. At this point in time the company mainly dealt with transporting businessmen between different stores around a city called Vara. This was done with the use of horse and carriage. In 1900th century Anders son Alfred took over the business and gave it its current name “AB Alfred Andersson Åkeri”. He also brought the business into the era of car-use. At 2001 AA took over ABBs logistic in Västerås and thus AA Logistik was created (www.aabolagen.se, 2015).
4.2 The Company Today
Looking at www.largestcompanies.se (2015) it can be see that AA Logistik at 2014 closed their books with a turnover of 70 785 000 SEK, a profit of 3 690 000 SEK, and 55 employees. According to the CEO, Nils Ökvist the organization now has 55 permanent employees and hires more per hour at peak points. The company is one of few within the AA companies that is currently closing their books with a profit. On AA Logistiks website (www.aalogistik.se, 2015) it can be read about how they since the year 2001 when AA Logistik in Västerås was founded, have expanded their customer base from only handling the logistics for ABB to dealing with 100 customers. They have increased their sales by five times, increased their storage space by four times and systemized all transport and storage operations. AA Logistik has also developed a program to deal with deviations in order to obtain the highest customer satisfaction. The company has also obtained certifications regarding the environment, employee environment, quality and traffic safety.
AA Logistik claims themselves to deal with “complex transports for complex needs” (www.aalogistik.se, 2015). They mainly indulge in business with industries and handle both delicate and dangerous goods. CFO Caroline Ekblom explains that profitability is very important to the company
This chapter contains the gathered information regarding the company AA Logistik where the case study has been
conducted. It is the compilation of background information, data and interviews. The interview questions the case
study is mainly built on can be viewed in Appendix 1. The organizations’ budgets, current KPIs and relevant costs
are included in this chapter.
19
and that they are trying on a continuous basis to phase out any deals that are not profitable. This is why they focus on industry goods. For example they have previously handled delivery of Linas Matkasse which was not profitable and thus was phased out. On AA Logistiks’ website (www.aalogistik.se, 2015) they write that their chauffeurs and traffic management obtain long experience dealing with industry goods, maybe even the greatest within their business. It is also written that it has occurred several times that customers have chosen to leave AA Logistik for a cheaper option but soon after returned as a customer to the company. The CEO gives an example of an ABB business called CSN who switched their inventory to be stored by the cheaper company DHL. But since DHL damaged their goods more often, the switch was not profitable for CSN and the customer returned to AA Logistik. “We cost a little bit more but are a little bit better” says Mr Ökvist and explains that since the consequences of breaking something large and expensive are so high the customers will earn on choosing a careful logistic company even if they cost a little bit more. Damaged industry goods can result in the delay of whole projects and a careful logistic company makes sure that deliveries are in time and that this does not happen. The CEO also points out that customers that are under a big time pressure are not price sensitive. For example, one customer is using air transport for their goods where in the usual case shipping is used. According to the CEO, when it comes to the premise AA Logistik currently has 20 000𝑚2 and the storage space is considered to be 13 000𝑚2. They are adapting their storage plan for every package and every customer and storage a big variation of products. AA Logistik also have a system that allows for their customer to check their warehouse balance whenever they want to. They want to make it possible for their customers to optimize their point of order and minimize their costs. The company's warehouse have the possibility to work as the receiving address for their customer’s goods. As the CEO explains, the company wants to earn money by in turn providing benefits such as quality and cost minimization for their customers. AA Logistik also provides packaging of all types of industry products. Beyond this they offer guidance and safety education within handling dangerous packages.
In addition to the mentioned services AA Logistik is also Sweden's only independent logistic company dealing with airline transport operations (www.aalogistik.se, 2015). They piece pick the goods, package them, safety control them and transports them to the airport. The CEO estimates that this differentiation from traditional logistic companies provides a bigger opportunity for them to increase revenue.
4.2.1 Benchmarking Today
Today AA Logistik does some internal benchmarking. The internal benchmarking consists of comparing different departments for example overtime but not financial KPIs. The CEO has however expressed some feelings regarding that they find it hard to benchmark against other companies within their industry. He explains that this is because they see themselves as offering a unique service within the logistic business, referring to that they like more complicated business and to customize logistic solutions instead of standardization. He feels that other businesses don’t seem to offer the service of packaging of industry goods. AA Logistik also differs in the way that they focus on a customer range that has either the delivery or pick-up address within 100km from Västerås. Because of these reasons they find no match whom they feel would provide a fair view to benchmark against. Therefore, no official external benchmarking is conducted. However, the CEO does every year check the website www.largestcompanies.se to see how the company stands against other logistic companies and obtain a feeling if they are on the right track or not with their business. The CEO and CFO mean that it would be possible to officially benchmark to increase profit during one year but that this would include less investments in the company and in turn a less future result. Instead of using benchmarking the company
20
sets the goals for their KPIs recounted to where the measurement currently lies and continuously increase them by small proportions in order to improve results.
4.3 Company KPIs
The CFO and CEO of AA Logistik explain that the company is currently working with a number of KPIs. They segment their KPIs within their impact on the organizational goals regarding employee satisfaction, customer satisfaction and profit. Recently changes have been made regarding how the company works with KPIs and they are trying to improve and computerize the way of working in order to help reach their company goals. Previously this year an incident occurred where one of AA Logistiks biggest customer ABB had asked for the company's KPIs and it turned out that no one available at the company knew which they were. The employee actually had to call the CEO to ask for the company's KPIs in order to provide them for ABB.
Today the organization has estimated five main KPIs regarding profit, which they find the most relevant. Although, they still have trouble determining which KPIs they should mainly focus in order to most efficiently reach their profitability goals. These KPIs are used for heads of departments to keep track of their processes and identify development opportunities. The CEO believes that the heads of departments have a good understanding regarding these KPIs since the head of departments have to report monthly if they have reached the set goals or not. Even if the KPIs today are mainly set by the CEO and management he claims to be open for new suggestions from other people within the organization. Today no official rewards for reaching KPI goals exist. However, if a department reaches their goals the head of that department is free to reward his employees in form of activities, as for example arranging a dinner for them.
Those five profit related KPIs the company has determined to be the most relevant are described in the following sub-chapters.
4.3.1 Occupancy per Vehicle (in time)
This KPI answers how many hours of a day that a car is used in handling customer orders. The department that answers for this KPI is the transportation department and the person responsible for this department is Saban Delic. He explained that this department has three sub departments and they are called 85, 86 and 87. These departments have in total fifteen vehicles. Sub department 85 is responsible for air freight and sub department 86 handles deliveries for ICA. Over the past year it has not brought in that much revenue since this sub department only has two vehicles doing the deliveries but for 2016 they are a bit more optimistic since new agreements have been made with ICA. Sub department 87 is the largest one and brings in most of the revenue. According to Mr Delic this sub department is the main subject for performance measure. To calculate this KPI the following information is needed: What the vehicle costs per hour and how far it has rolled, earnings per hour per worker and petrol. It is noteworthy to mention that the prices differ between vehicles. The goal for the occupancy per vehicle (in time) is to be at 50%. To reach this goal AA Logistik relies on their competent and responsible workers. This measurement is calculated monthly and it is done manually for now. They are currently working on implementing a system that would facilitate this process of getting the data, since it is quite time consuming to do manually. It is also worth mentioning that this particular KPI, occupancy per vehicle (in time) was implemented very recently and thus the drivers don’t know much about it. It has previously been shown that if the drivers are aware of the KPIs and are more involved they perform better. Examples of this are eco-driving and speeding.
21
The CEO states that the vehicles today are available 24 hours a day all days a month with exceptions for holidays such as Christmas and New Year’s Eve.
In Appendix 2 it is shown that if the company reaches its goal of 50% occupancy per vehicle (in time) during a month consisting of 30days the related profit would be 964 800 SEK. If they instead have an occupancy rate of 100% during that month that profit would be 2 109 600 SEK. The occupancy rate that needs to be reached in order to cover the vehicle associated costs is 7.9% and increasing the occupancy with 1% will lead to an approximate increase in profit of 22 896 SEK a month.
4.3.2 Income/Working Hour per Cost-Center
Here the KPI is measured by the total revenue divided by total amount of worked hours within the company. In Appendix 2 it is illustrated how this KPI is calculated. The goal for this KPI is to be at 1050 SEK. Here as well the company relies on their competency and responsible workers to reach their goal. This KPI is calculated monthly by using data collected from the income statement. Head of each departments are responsible for their divisions and the CEO and CFO of the KPI as a whole. The CEO explains that this KPI is mainly used as a measuring tool for the purpose of control.
4.3.3 Errand /Customer Service per/Week/Person
Head of the customer service department is Åsa Granlund and she is therefore responsible for this KPI. The KPI answers how many errands that are managed per person per week. Besides from being linked to profitability this is also a measurement derived from the employee satisfaction goal. The aim is to reach 120 errands per week per person and this is measured by simply adding the errands up on a weekly basis. Right now there are about 2.5 full time workers within customer support and they handle about 250-280 errands in total during one week.
From Appendix 2 it can be seen that the monthly cost for customer support is currently at 167 790 SEK. If each employee reaches a number of errands of 120 per week during a month consisting of four weeks the total errands dealt with will be 1200 and the average cost per errand approximately 139.83 SEK. Currently the number of errands handled per week is between 250 and 280. Accounting for a month within these boundaries consisting of 1 060 errands the average cost per errand is approximately 158.29 SEK. The average cost per errand thereby diminishes when the amount of errands dealt with per person per week increases.
4.3.4 Number of Piece Picking a Month/Worker and in Total
This KPI is in addition also linked to employee satisfaction. It measures the amount of piece pickings done per month per worker and in total. The goal is to be at 1 450 piece pickings per employee each month. At AA Logistik they account for an average month to consist of 21.4 working days, each consisting of 8 working hours. The data is collected through a computer system and done by a program called Astro. According to the CEO this PM exists in order to be able to evaluate the workers performance in a logical manner. If for example, workers say they have a lot to do, the management will be able to check their figures against the goals set and average performance.
22
Miss Granlund is responsible for the warehouse department and she feels that the KPIs concerning her department have been decided in consensus with the management board. However, she has not herself set the goal for the KPI. Right now her workers are aware that the piece pickings will be measured but they do not seem to be very happy about this change and may not fully have understood what it means. Miss Granlund hopes this attitude will change when the measurement is used in a positive manner. At the moment she feels that the goal of 1 450 piece pickings per person may be a bit high and that they are currently at a lower level. She does consider it to be reasonable if they obtain either a higher volume of inventory or had a lower level of staff. Today there are eight people working within the warehouse department. The CEO however is of the opinion that warehouse staff probably will find the goal too high no matter where it is set. The most important thing is to start measuring so that they can evaluate over time.
One thing that the head of department points out is that it should be easy to measure the KPIs. Which this KPI is, with the help of Astro that retrieves information with the help of scanners and individual log-ins. The effort should be put on analyzing the KPIs and not measuring them. They are good indicators on what changes could be necessary and can provide a guideline for the employees on what level they should perform. She sees this leading to improved results and a possibility to develop individual goals. Some kind of reward for those that reach their goals has not yet been discussed but she thinks this sounds like a good idea.
In appendix 2 it is calculated that if the goal of 1 450 piece picks per person is met the company will currently generate a profit from this of 60 944 SEK. Corresponding to an hourly piece picking rate of about 8.47. For the costs associated with the piece picking to be covered the monthly minimum rate needs to be at 7.12 piece picks per person per hour.
4.3.5 Occupancy (Income/𝑚
2)
Occupancy (income/𝑚2) explains how much of AA Logistik’s premises that are used. Their goal for this measurement is to be at 160%. This is calculated once a month by taking inventory turnover divided by the amount of square meters of the storage area. The storage area today consists of 13 000𝑚2. The one responsible for this KPI are the relevant departments such as management of warehouse and sales personnel.
From Appendix 2 it can be seen that if the goal of 160% occupancy is reached the related revenue will be 2 121 600 SEK each month. For every 1% occupancy rate that is covered the company correspondently earns 13 260 SEK per month.
4.4 Deviation Management
According to the CFO deviations are very costly and therefore deviation management is taken seriously. The KPIs are evaluated monthly in relation to the financial statement and result analyses. In relation to this they search for big deviations. The deviations are then discussed at the board of management and categorized. After that the results are sent out to the organization through their internal webpage called
intranät. On intranät the employees can also read about existing goals and KPIs. Sometimes an
explanation to why the figures look like they do are included in the information, at other times the responsible departments are told to look into the problem further.
23
4.5 Future Vision and Budget
The CEO and CFO define that AA Logistik has the vision by 2020, to have the most satisfied customers, most profitable organization and the most satisfied and competent co-workers within their industry. Today they see themselves as competent, reliable and personal, but this is something they always strive for, even in the future. They are also striving to have revenue of 100-150 million SEK per annum and a profit of 10-15 million SEK. To become Sweden's best logistics company, they have a plan on how to reach this goal. They believe that high effectiveness of current deliveries will lead them to become more profitable which in turn will give funds to investments and other developments. Thus this will lead them to become the market leader and Sweden's best logistics company. From 2016 their mission is to work actively and consistently with the KPIs and to work with KPIs they have not worked with before. Such as customer related KPIs, for example, delivery precision.
4.5.1 Logistic Center
For the future AA Logistik plan to be a logistic center where they provide the best customer focused services to clients within a 100 km radius that are in need of any logistic solution. To be their first choice when it comes to logistical solutions because they are the best alternative that provides such a diverse form of solutions. Thus it would be cheaper to go with them than to educate your own staff within logistics. They also want their customer to pay for the service used and not, for example, fixed storage costs. To get away from manual paper management to a more computerized system so that it is more environmentally friendly.
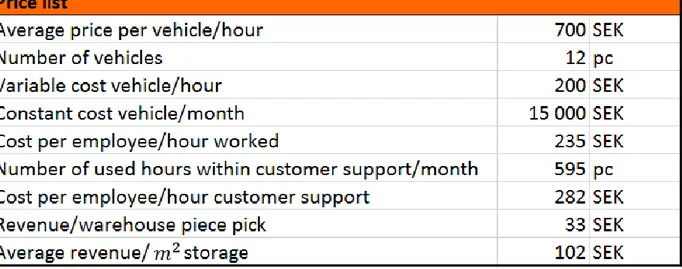
4.6 Pricelist
Figure 6 below shows the price list containing estimated revenues and cost relevant to the profit related KPIs presented by AA Logistik.
Figure 6 - price list