Subjects with high fasting insulin also have higher
postprandial GLP-1 and glucagon levels than
controls with lower insulin
Erina Albinsson-Stenholm, Johannes Bergsen, Simon Ingues, Nathalie Vilhelmsson, Hans Guldbrand and Fredrik H Nyström
The self-archived postprint version of this journal article is available at Linköping University Institutional Repository (DiVA):
http://urn.kb.se/resolve?urn=urn:nbn:se:liu:diva-163259
N.B.: When citing this work, cite the original publication.
Albinsson-Stenholm, E., Bergsen, J., Ingues, S., Vilhelmsson, N., Guldbrand, H., Nyström, F. H, (2019), Subjects with high fasting insulin also have higher postprandial GLP-1 and glucagon levels than controls with lower insulin, Nutrition Research, 72, 111-120.
https://doi.org/10.1016/j.nutres.2019.10.009
Original publication available at:
https://doi.org/10.1016/j.nutres.2019.10.009
Copyright: Elsevier (12 months)
Subjects with high fasting insulin also have higher
postprandial GLP-1 and glucagon levels than controls with
lower insulin
Erina Albinsson-Stenholm, Johannes Bergsén, Simon Ingves, Nathalie Vilhelmsson, Hans Guldbrandand Fredrik H Nystrom.
Department of Medical and Health Sciences, Faculty of Medicine and Health Sciences, Linköping University, Linköping, Sweden.
Corresponding author:
Fredrik H. Nystrom M.D., Ph.D., professor Department of Medical and Health Sciences Faculty of Medicine and Health Sciences Linköping University
SE 581 85 Linköping, Sweden Telephone; +46 101 037749 Fax; +46 13 145949
Abbreviations
area under the curve (AUC) energy expenditure (EE)
general linear mixed model (GLMM) glucagon-like peptide-1 (GLP-1) high-carbohydrate (HC)
low-carbohydrate (LC) relatively high insulin (RHI) relatively low insulin (RLI) standard error of the mean (SEM)
Abstract
Little is known about postprandial release of serum ghrelin, glucagon and glucagon-like peptide-1 (GLP-1) in relation with differing fasting insulin levels. We hypothesized that these hormones are affected by insulin resistance and hence we compared different postprandial responses of GLP-1, glucagon and ghrelin in subjects with relatively high (RHI) or relatively low (RLI) fasting insulin levels. The trial was a randomized cross-over study with four different meal conditions. Fourteen non-obese or obese, healthy, men and 14 women were randomly assigned to the order of supervised intake of a 750 kcal drink with the same protein contents but with 20 energy-percent (E%) or 55 E% from carbohydrates, and the remaining energy from fat. Participants were also randomized to consume the drinks as one large beverage or as five 150 kcal portions every 30 minutes. The 28 subjects were divided in two equally sized groups based on fasting insulin levels. Statistics was done with general linear mixed model. Fasting insulin levels were three-fold higher in the group with RHI compared with the RLI group (RHI: 1004±510 pg/ml, RLI: 324±123 pg/ml, p<0.0005). Serum GLP-1 was highest in the RHI group after both single meals and after 5 drinks and following high- and low carbohydrate meals (both p≤ 0.002) and this was the case also for glucagon levels (both p≤0.018), while ghrelin levels did not differ between groups. Thus, subjects with RHI displayed both higher postprandial serum GLP-1 and glucagon than the participants with RLI, suggesting that glucagon could play a role in the advent of dysglycemia by insulin resistance.
Keywords: carbohydrate content; ghrelin; glucagon; glucagon-like peptide-1; satiety; meal distribution.
1 Introduction
Insulin is a major orchestrator in determining hormonal and nutritional responses after meal ingestions and the levels are high in general in obesity, while the increase following a meal is leads to elevated glucose levels [1, 2] and overt diabetes. Insulin interacts with several
important hormones such as glucagon-like peptide-1 (GLP-1), ghrelin and glucagon, all of which are also regulated by food ingestion. The incretin GLP-1 is released from L-cells in the small intestine in response to nutrients [3-5]. GLP-1 induces satiety, inhibits gastric emptying and it induces glucose dependent release of insulin in humans [4-8]. The hormone ghrelin is also regulated by food intake in humans [9]. However, the release of ghrelin mainly stems from cells lining the stomach and, in contrast to GLP-1, nutrients suppress ghrelin release [10-12]. Indeed, several of ghrelin effects are opposite to those of GLP-1 as it acts to increase hunger and appetite and also reduces insulin secretion [13]. Little is known about how insulin resistance affects ghrelin levels and secretion in humans. We know of no studies that have analyzed postprandial ghrelin levels in relation to different meal frequencies or differing carbohydrate contents of the meals in subjects with different insulin sensitivity. Another important hormone in insulin resistance is glucagon [14, 15] which is produced by alpha cells in the pancreatic islets of Langerhans. The release of insulin from the adjacent islet beta cells suppress glucagon secretion [16]. Glucagon levels are usually elevated in patients with type 2 diabetes, but the specific effects of incretins on release of GLP-1, as judged by treatment with GLP-1 receptor agonists in humans, is controversial [17].
To the best of our knowledge, there are no reports from studies where the specific effects on serum GLP-1 and ghrelin of a standardized meal with high or low carbohydrate content has been tested in relation to fasting insulin levels or other measures of insulin sensitivity. Accordingly, we recruited 14 overweight or obese non-diabetic subjects to add to a
previously recruited cohort of non-obese healthy subjects [18], to study postprandial
differences between participants with high or low fasting insulin levels between groups. The recruited men and women were randomly assigned to the order of a single 750 kcal soft drink with either 20 % or 55 % of the energy content from carbohydrates (E%). Subjects were also randomized to consume the beverages as one single drink in the morning or to drink it divided into five 150 kcal drinks every 30 minutes to study influence of meal distribution. Given the importance of insulin for hormonal responses we hypothesized that postprandial responses of GLP-1, glucagon and ghrelin differ between subjects with high as compared with low fasting insulin levels.
2 Methods
2.1 Recruitment and interventions
The participants were consecutively recruited by local advertising with posters at Linköping University. Healthy subjects > 18 years of age, without diabetes, could participate. The mean age was 28.3 ± 11 years (range from 20-60 years). The subjects were informed not to change their usual dietary and exercise habits during the study. Thyroid hormone levels were
assessed, and confirmed to be normal, in all the participants ahead of participation. Results from 14 non-obese subjects have been reported [18]. For the results presented herein, 14 overweight or obese subjects were additionally recruited in order to study differences of the test meals in relation to baseline fasting insulin levels, i.e. to compare result in subjects with relatively high (RHI) or low (RLI) fasting insulin levels.
Each subject performed four test occasions in a randomized order by drawing of ballots. There were two different test beverages, one with high-carbohydrate (HC) content and another with low-carbohydrate (LC) composition. The drinks were ingested in two different
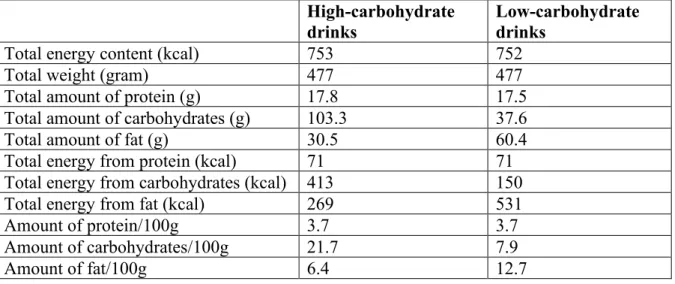
settings, either as one single meal in the morning or as five equally sized portions every 30 minutes. The test meals consisted of standard milk (3 % fat), cream (40 % fat), frozen blueberries, raw eggs and sucrose in two combinations to achieve 20 % of total energy from carbohydrates in the LC drink and 54.9 % of total energy from carbohydrates in the HC drink. The energy compositions of the drinks are shown in Table 1.
Each serving was 95.4 gram during the tests in which five small portions were consumed. All the test meals had a temperature of 18-22 °C. The total trial-period for recruitment and
follow-up for all 28 subjects was from September 1, 2015 to April 31, 2016 [18]. All four test meals for each individual subject were ingested within a six weeks period. The participants were studied at the Department of Clinical Physiology at Linköping University Hospital and each session started 08:00 AM after fasting from 10:00 PM the prior evening. Subjects were only allowed to drink water during this fasting period. Height, weight, blood pressure in the supine position and routine blood biochemistry was obtained at the start of the first test meal. A venous cannula for drawing blood was inserted at the start of each test session which lasted from about 08:00 AM to 12:00 AM in total. This time period was chosen since it was
assumed to represent a common interval between breakfast and the subsequent lunch. Figure 1 shows the flow diagram of the study. Figures 2a and 2b show the timelines of the study for the single and five meals occasions.
The postprandial and fasting energy expenditure (EE) was measured by indirect calorimetry (Quark RMR, Cosmed, Finland) as described earlier [18], the equipment was calibrated daily. The participants rested for 10 minutes before each measurement of EE, and the mean values of the last five minutes of readings were used after individual stabilization of EE.
When consuming the five small meals the participants consumed each meal during five minutes. The subjects were allowed 10 minutes to finish the large single drinks. All participants were observed when completing the drinks. EE rate was measured five times with 30-minute intervals starting 30 minutes from start of the ingestion of the meal. This left a period of 20 minutes (single drink) or 25 minutes (small drinks) before each recording of EE after finishing the beverages. The blood samples were collected after each measurement of EE.
2.2 Laboratory methods and visual-analogue scales
Serum samples for hormones were collected at one and a half hours, two and a half hours and three hours after the basal fasting samples had been drawn. The venous blood samples were centrifuged immediately before being frozen to -20C within 30 minutes. The sera were transferred to a -80C freezer within a day. Body composition was measured in light clothing with a dedicated hat to cover the hair, by air displacement plethysmography using BodPod (Life Measurement Instruments, Concord, CA, USA). Hunger sensations were measured by using visual-analogue scales (VAS). Every 30 minutes, ahead of the measurement of EE, the participant was asked to draw a vertical line on a document choosing between the statements “very hungry” and “not hungry at all”. The results were turned into percentage of the total length of the horizontal line. A high score thus corresponded to a strong suppression of the sense of hunger.
Laboratory tests were analyzed at the Department of Clinical Chemistry at the Linköping University Hospital. Levels of serum hemoglobin was determined by photometry on a
CellDyn Sappire analyzer (Abbott, Ill, USA). Levels of plasma creatinine were analyzed on a Cobas c701 (Roche Diagnostics, Basel, Switzerland) by an enzymatic colorimetric method.
Levels of plasma apolipoprotein A1 and apolipoprotein B were determined by immuno-turbidimetry on a Cobas c502 analyzer (Roche Diagnostics, Basel, Switzerland). Serum T4 was determined by competitive chemiluminescence on a Cobas e602 instrument (Roche Diagnostics, Basel, Switzerland). HbA1c was analyzed with high performance liquid
chromatography on a Tosoh G8 analyzer (Tosoh Bioscience, PA, USA). Total active GLP-1 and active ghrelin were analyzed using Milliplex®MAP Human Metabolic Hormone
Magnetic Bead Panels (Merck Millipore, Darmstadt, Germany) on a Luminex® 200 equipment (Luminex Corporation®, Austin, Texas, USA). A protease inhibitor cocktail containing aprotinin (P2714 Protease Inhibitor Cocktail, Sigma, Israel) and DPP-4 inhibitor (product number DPP4, Merck Millipore, Darmstadt, Germany) was added before
centrifugation of the samples to preserve active ghrelin and active GLP-1. Total coefficient of variation (intra + inter-assay) was 11.4% for serum GLP-1 and 5.0% for serum ghrelin.
2.3 Ethics
The study was conducted according to the guidelines laid down in the Declaration of Helsinki and all the procedures were approved by the Regional Ethics Committee of Linköping, Sweden. Written informed consent was obtained from all subjects. The trial design can be found at https://clinicaltrials.gov with accession number NCT02622490. Please observe that the accession number is identical to that for our previously published paper [18] since the recruited additional 14 obese or overweight subjects constituted an accepted amendment of the first protocol submitted to the Ethical Review Board in Linköping, Sweden.
2.4 Statistical analyses
Statistical estimates were calculated using IBM SPSS Statistics 25 software (IBM
were done as stated in the text. The areas under the curves (AUC) were calculated based on the trapezoidal rule. We used data for the mean values at each time point from the high- and low-carbohydrate tests when we compared the effects of five drinks with one.
Correspondingly, the mean values from one and five drinks, at each time point, were used when we calculated the differences between the HC and LC tests. Comparisons between the participants with RLI or RHI were done with general linear mixed model (GLMM),
probability distribution gamma, link function log, which is appropriate also for non-normally distributed variables. Since participants ate lunch and dinner at their own choice after the tests, we expected no carry-over effect from the beverages tested in the study. The study had 94% power to detect a difference of insulin levels between the two groups (two-sided T-test with α= 0.05).
3 Results
3.1 Baseline characteristics
Baseline characteristics of the participants, measured in the fasting state, are presented in Table 2. There were 50% females in both groups and insulin levels were about three-fold higher in the RHI group than in the RHI group (1004 ± 510 pg/ml versus 324 ± 123 pg/ml, p<0.0005). The glucose levels were also higher in RHI than in the RLI group, but there were no statistically significant differences with regards to BMI or blood pressure, as seen in Table 2. The women had higher fat-percentage than men (women: 36.8 ± 9.4 %, men: 25.0 ± 11%, p= 0.005). Correspondingly, the men had more fat-free mass (women: 46.6 ± 6.6 kg, men: 71.2 ± 11 kg, p< 0.0001) and higher fasting EE (women: 1421 ± 101 kcal/24h, men: 1988 ± 253 kcal/24h, p= 0.001) than the women.
Tables 3 and 4 present postprandial differences between the groups with RLI and RHI. Postprandial changes comparing the RHI and RLI groups of serum GLP-1, serum ghrelin, serum glucagon and hunger suppression are illustrated in Figures 3-6. Postprandial insulin levels were higher after both single and five drinks, in the RHI group compared with RLI and glucose levels showed a similar pattern (Tables 3 and 4). Levels of GLP-1 were higher in the RHI group than in the RLI group after both single meals and after 5 drinks, and this was the case also for glucagon levels. Ghrelin levels, and suppression of hunger sensations did not differ between the RLI and RHI groups. Postprandial energy expenditure was highest in the group with RHI insulin levels when comparing drinks with LC contents, but did not differ between the groups during any other of the conditions presented in Tables 3 and 4. In a post-hoc analysis we found no gender differences with regard to AUC for GLP-1, glucagon or ghrelin under either HC or LC meals, or when ingesting 1 large or 5 small drinks (Mann-Whitney U test, all p = n.s.).
3.3 Correlations
In an exploratory analysis of correlations of values obtained in the fasting state in the total cohort we found fasting serum GLP-1 to be correlated with fasting insulin by non-linear regression (spearman: r= 0.52, p= 0.004, n=28) while glucagon did not (fasting glucagon vs. fasting insulin, spearman: r= 0.11, p= 0.56, n=28). Levels of fasting glucagon and fasting GLP-1 were also statistically interrelated when analyzed non-linearly (spearman: r= 0.42, p= 0.025, n= 28). Fasting levels of ghrelin were negatively correlated with BMI when gender was added as an independent variable in the model (p= 0.03, standardized beta= -0.42). In a multivariate regression analysis, in which fasting insulin was set as independent variable together with age, BMI, gender and fasting glucose, we found that glucagon was statistically interrelated to fasting insulin (p= 0.011, standardized beta= 0.62) while GLP-1 (p= 0.45) was
not. Fasting levels of serum leptin were statistically related to both fasting insulin (p= 0.008, standardized beta= 0.51), and BMI (p= 0.013, standardized beta= 0.47) in this multivariate model.
4 Discussion
4.1 Hormonal changes
The two groups that were the focus of this analysis differed on average more than three-fold in fasting insulin levels and glucose levels were also generally higher postprandially in the RHI than in the RLI group. We also found postprandial GLP-1 to be higher in the RHI group than in the group with lower insulin levels. In contrast, intact GLP-1 has earlier been shown to be lower after a test meal in Korean subjects with the metabolic syndrome compared with insulin sensitive controls [19]. However, lower postprandial release of GLP-1 in Asians as compared with Caucasians, has also been shown earlier [20]. This finding renders specific comparison of different ethnic groups more complicated. Also, within Asians the results have been contradictory since Japanese patients with type 2 diabetes have been shown to have similar GLP-1 release by glucose intake as subjects without diabetes in one study [21]. Thus, our finding of enhanced release of GLP-1 in subjects with RHI adds information on this topic in Caucasians. Our data contradicts lack of GLP-1 release as a mediator of increased glucose levels in the early manifestations of insulin resistance in Caucasians. In line with this, we found that fasting levels of GLP-1 correlated positively with serum insulin in our total cohort. However, this relationship was lost when data were corrected for age, gender, fasting glucose and BMI. On the other hand, fasting ghrelin levels were negatively related to BMI in the same multivariate regression analysis. This confirms the complicated relationship between BMI and insulin when age and gender are added to the equations. This was also one of the reasons that our analyses, comparing participants with RLI and RHI, were based upon insulin
levels, and not BMI. As seen in Table 2, BMI levels were not significantly higher in the RLI group than in the RLI group.
Ghrelin responses did not differ between the two groups. This confirms earlier findings that the levels are similar in subjects with or without impaired glucose tolerance [22] and with or without obesity [9].
Levels of glucagon are generally elevated in patients with insulin resistance and type 2 diabetes [5, 14, 16, 23]. Pharmacological incretin therapy in the treatment of diabetes is acts partly by reduction of glucagon levels, as was shown in the first experiment of intravenous recombinant GLP-1 in humans [24]. However, a strong general suppression of glucagon by GLP-1 was likely not at hand in our cohort with RHI. Indeed, we found a positive correlation between basal levels of glucagon and GLP-1. Also, postprandial GLP-1, and glucagon, were higher in the RHI than in the RLI group. These findings could suggest that physiological elevations of GLP-1 do not strongly suppress glucagon release in early stages of insulin resistance, in contrast to what has been found in later stages [14, 15]. Indeed, Glucagon suppression has been shown to be affected by insulin resistance [5, 14, 23, 25]. However, it is possible that early stages of the metabolic syndrome, before overt diabetes, presents with a different incretin release pattern than in patients with overt type 2 diabetes [5, 7, 8, 15, 26]. We speculate that increased GLP-1 levels in subjects with hyperinsulinemia, can be a
compensatory mechanism in insulin resistance, that occurs before glucose levels are elevated to the extent that overt diabetes ensues following aggravated obesity and higher age [5, 6, 27, 28]. However, there might also be other genetic differences as Asians with less favorable glucose responses to an OGTT have been found to have higher GLP-1 releases than a normal control group of Caucasians [20].
4.2 Energy expenditure
Energy expenditure was higher in the group with RHI as compared with RLI during the tests of LC drinks only. This finding could indeed be of interest since many studies have shown more efficient weight loss after LC as compared to HC diets [29]. This is in line with the finding that a low carbohydrate diet was more efficient than a low fat diet to maintain a high metabolic rate after weight loss in overweight and obese subjects [30].
Limitations
We acknowledge that the trial had limitations. Although all participants were supervised when consuming the drinks, it is not certain that data from the different meals and ingestion patterns can easily be extrapolated to regular food consumption, that also take place at other times than in the morning in the fasting state. Indeed, sleep deprivation has been shown to delay GLP-1 release [31]. Also, we did not study subjects of high ages, and the study lacked power for analyzing gender differences. Such aspects could be investigated in future trials. It is important to note that all participants in our trial were Caucasians, and that this limits generalizability to other ethnic groups.
In summary the participants with RHI in our study displayed no signs of a muted postprandial GLP-1 release, rather, the postprandial levels were higher than in controls with RLI. Also increased glucagon levels were found in response to the meals in participants with RHI, and this confirms the importance of glucagon hypersecretion in the pathogenesis of insulin resistance and hyperglycemia [14, 23]. The hypothesis regarding differences in postprandial GLP-1 and glucagon responses between the groups was accepted while the corresponding hypothesis regarding effects on ghrelin was rejected.
Acknowledgement
We are grateful for statistical advices from statistician ass. prof. Mats Fredrikson, Forum Östergötland, Region Östergötland, and Linköping University, Linköping, Sweden. The County Council of Östergötland and Linköping University, Department of Medical and Health Sciences, sponsored the trial. The studies were also supported by the Swedish Heart-Lung Foundation and “Gamla Tjänarinnor”. The funders had no role in the design or completion of the trial. The authors all declare that they have no conflicts of interest in this trial.
References
[1] van Raalte DH, Verchere CB. Improving glycaemic control in type 2 diabetes: Stimulate insulin secretion or provide beta-cell rest? Diabetes Obes Metab 2017;19:1205-13. [2] Jezek P, Jaburek M, Holendova B, Plecita-Hlavata L. Fatty Acid-Stimulated Insulin Secretion vs. Lipotoxicity. Molecules 2018;23.
[3] Mandoe MJ, Hansen KB, Hartmann B, Rehfeld JF, Holst JJ, Hansen HS. The 2-monoacylglycerol moiety of dietary fat appears to be responsible for the fat-induced release of GLP-1 in humans. Am J Clin Nutr 2015;102:548-55.
[4] Temizkan S, Deyneli O, Yasar M, Arpa M, Gunes M, Yazici D, Sirikci O, Haklar G, Imeryuz N, Yavuz DG. Sucralose enhances GLP-1 release and lowers blood glucose in the presence of carbohydrate in healthy subjects but not in patients with type 2 diabetes. Eur J Clin Nutr 2015;69:162-6.
[5] Anandhakrishnan A, Korbonits M. Glucagon-like peptide 1 in the
pathophysiology and pharmacotherapy of clinical obesity. World J Diabetes 2016;7:572-98. [6] Andersen A, Lund A, Knop FK, Vilsboll T. Glucagon-like peptide 1 in health and disease. Nat Rev Endocrinol 2018;14:390-403.
[7] Tasyurek HM, Altunbas HA, Balci MK, Sanlioglu S. Incretins: their physiology and application in the treatment of diabetes mellitus. Diabetes Metab Res Rev 2014;30:354-71.
[8] Nauck MA, Meier JJ. The incretin effect in healthy individuals and those with type 2 diabetes: physiology, pathophysiology, and response to therapeutic interventions. Lancet Diabetes Endocrinol 2016;4:525-36.
[9] Prodam F, Monzani A, Ricotti R, Marolda A, Bellone S, Aimaretti G, Roccio M, Bona G. Systematic review of ghrelin response to food intake in pediatric age, from neonates to adolescents. J Clin Endocrinol Metab 2014;99:1556-68.
[10] Pinkney J. The role of ghrelin in metabolic regulation. Curr Opin Clin Nutr Metab Care 2014;17:497-502.
[11] Mihalache L, Gherasim A, Nita O, Ungureanu MC, Padureanu SS, Gavril RS, Arhire LI. Effects of ghrelin in energy balance and body weight homeostasis. Hormones (Athens) 2016;15:186-96.
[12] Koliaki C, Kokkinos A, Tentolouris N, Katsilambros N. The effect of ingested macronutrients on postprandial ghrelin response: a critical review of existing literature data. Int J Pept 2010;2010.
[13] Poher AL, Tschop MH, Muller TD. Ghrelin regulation of glucose metabolism. Peptides 2018;100:236-42.
[14] Girard J. Glucagon, a key factor in the pathophysiology of type 2 diabetes. Biochimie 2017;143:33-6.
[15] Haedersdal S, Lund A, Knop FK, Vilsboll T. The Role of Glucagon in the Pathophysiology and Treatment of Type 2 Diabetes. Mayo Clin Proc 2018;93:217-39. [16] Wewer Albrechtsen NJ. Glucagon receptor signaling in metabolic diseases. Peptides 2018;100:42-7.
[17] Ceriello A, Genovese S, Mannucci E, Gronda E. Glucagon and heart in type 2 diabetes: new perspectives. Cardiovasc Diabetol 2016;15:123.
[18] Ingves S, Vilhelmsson N, Strom E, Fredrikson M, Guldbrand H, Nystrom FH. A randomized cross-over study of the effects of macronutrient composition and meal frequency on GLP-1, ghrelin and energy expenditure in humans. Peptides 2017;93:20-6. [19] Yoo S, Yang EJ, Lee SA, Koh G. Postmeal increment in intact glucagon-like peptide 1 level, but not intact glucose-dependent insulinotropic polypeptide levels, is
inversely associated with metabolic syndrome in patients with type 2 diabetes. Endocr Res 2018;43:47-54.
[20] Seino Y, Fukushima M, Yabe D. GIP and GLP-1, the two incretin hormones: Similarities and differences. J Diabetes Investig 2010;1:8-23.
[21] Lee S, Yabe D, Nohtomi K, Takada M, Morita R, Seino Y, Hirano T. Intact glucagon-like peptide-1 levels are not decreased in Japanese patients with type 2 diabetes. Endocr J 2010;57:119-26.
[22] Bounias I, Pouliliou S, Tripsianis G, Antonoglou C, Papazoglou A, Maltezos E, Papazoglou D. Ghrelin Levels in Basal Conditions and During Glucose Tolerance Test in Prediabetic and Diabetic Patients. Horm Metab Res 2018;50:822-6.
[23] Faerch K, Vistisen D, Pacini G, Torekov SS, Johansen NB, Witte DR, Jonsson A, Pedersen O, Hansen T, Lauritzen T, et al. Insulin Resistance Is Accompanied by Increased Fasting Glucagon and Delayed Glucagon Suppression in Individuals With Normal and Impaired Glucose Regulation. Diabetes 2016;65:3473-81.
[24] Gutniak M, Orskov C, Holst JJ, Ahren B, Efendic S. Antidiabetogenic effect of glucagon-like peptide-1 (7-36)amide in normal subjects and patients with diabetes mellitus. N Engl J Med 1992;326:1316-22.
[25] Urbano F, Di Pino A, Scicali R, Filippello A, Di Mauro S, Scamporrino A, Marchisello S, Rabuazzo AM, Purrello F, Piro S. Impaired Glucagon Suppression And Reduced Insulin Sensitivity In Subjects With Prediabetes Undergoing Atorvastatin Therapy. Eur J Endocrinol 2019.
[26] Opinto G, Natalicchio A, Marchetti P. Physiology of incretins and loss of incretin effect in type 2 diabetes and obesity. Arch Physiol Biochem 2013;119:170-8. [27] Malik J, Roohi N. GLP-1, a powerful physiological incretin: an update. J Biol Regul Homeost Agents 2018;32:1171-6.
[28] Kuhre RE, Holst JJ, Kappe C. The regulation of function, growth and survival of GLP-1-producing L-cells. Clin Sci (Lond) 2016;130:79-91.
[29] Nystrom FH, Quon MJ. Man shall not live by bread alone. Nutrition 2015;31:244-7.
[30] Ebbeling CB, Feldman HA, Klein GL, Wong JMW, Bielak L, Steltz SK, Luoto PK, Wolfe RR, Wong WW, Ludwig DS. Effects of a low carbohydrate diet on energy
expenditure during weight loss maintenance: randomized trial. BMJ 2018;363:k4583.
[31] Benedict C, Barclay JL, Ott V, Oster H, Hallschmid M. Acute sleep deprivation delays the glucagon-like peptide 1 peak response to breakfast in healthy men. Nutr Diabetes 2013;3:e78.
Tables
Table 1. Energy composition of the high- and low-carbohydrate beverages. High-carbohydrate
drinks Low-carbohydrate drinks
Total energy content (kcal) 753 752
Total weight (gram) 477 477
Total amount of protein (g) 17.8 17.5
Total amount of carbohydrates (g) 103.3 37.6
Total amount of fat (g) 30.5 60.4
Total energy from protein (kcal) 71 71
Total energy from carbohydrates (kcal) 413 150
Total energy from fat (kcal) 269 531
Amount of protein/100g 3.7 3.7
Amount of carbohydrates/100g 21.7 7.9
Amount of fat/100g 6.4 12.7
Energy content of the beverages that were tested in the trial. All drinks were ingested as one large or divided into five equally sized smaller drinks.
Table 2
Baseline characteristics of participants according to levels of fasting insulin.
Variable Relatively low fasting insulin Relatively high fasting insulin P between groups Gender (males/females) 7/7 7/7 1.0 Age (years) 26.8 ± 10.0 29.9 ± 12.4 0.48 Weight (kg) 79.8 ± 22.2 93.6 ± 24.7 0.13 BMI (kg/m2) 25.2 ± 5.7 29.9 ± 6.5 0.053 Systolic BP (mmHg) 123 ± 10 124 ± 9 0.88 Diastolic BP (mmHg) 74 ± 8 75 ± 8 0.71 Hemoglobin (g/l) 136 ± 9 137 ± 10 0.78
Plasma creatinine (µmol/l) 78 ± 19 76 ± 12 0.76 Plasma Apolipoprotein A1 (g/l) 1.38 ± 0.32 1.23 ± 0.13 0.095 Plasma Apolipoprotein B (g/l) 0.85 ± 0.20 0.84 ± 0.22 0.94 Serum T4 (nmol/l) 15.9 ± 1.6 16.0 ± 2.0 0.85
HbA1c (mmol/mol) 32 ± 3 34 ± 4 0.18
Fasting EE (kcal/24h) 1815 ± 373 2082 ± 472 0.11 Fasting serum insulin (pg/ml) 324 ± 123 1004 ± 510 <0.0001 Fasting blood glucose (mmol/l) 5.1 ± 0.4 5.6 ± 0.5 0.011 Fasting serum GLP-1 (pg/ml) 3.7 ± 3.8 25.1 ± 43.1 0.075 Fasting serum glucagon (pg/ml) 24.8 ± 19.9 49.2 ± 44.8 0.074 Fasting serum ghrelin (pg/ml) 53.8 ± 25.9 47.6 ± 29.7 0.56 Fasting serum leptin (pg/ml) 6840 ± 6348 13273 ± 10686 0.064 Body fat percentage (%) 27 ± 11 35 ± 11 0.073
Fasting- glucose, insulin, GLP-1, ghrelin, leptin and EE were the mean values of the four recordings done at the start of each test meal. Fasting energy expenditure was measured by indirect calorimetry and body fat percentage was determined by air displacement
plethysmography. Data are means ± standard deviations, n=28 total cohort. Relatively low insulin, n=14; relatively high insulin, n=14. P= independent t-test. Abbreviations: BP, blood pressure; EE, energy expenditure.
Table 3
Postprandial AUC for different meal frequencies between RLI and RHI. Variable AUC for one large drink
RLI
AUC for one large drink RHI p
AUC for five small drinks RLI
AUC for five small drinks RHI p EE (kcal) 5734 ± 1114 6380 ± 1295 0.079 5473 ± 1096 6250 ± 1404 0.065
Suppression of hunger (AU)* 1.77 ± 0.37 1.70 ± 0.40 0.632 1.50 ± 0.41 1.43 ± 0.33 0.487
B-glucose (mmol/L) 15.75 ± 1.06 17.24 ± 2.59 0.051 16.14 ± 1.32 17.52 ± 2.18 0.033
Insulin (pg/ml) 2935 ± 1056 5701 ± 2896 <0.0005 2554 ± 981 5127 ± 2897 <0.0005
GLP-1 (pg/ml) 53.76 ± 22.14 97.3±123 0.002 35.49 ± 19.2 85.44 ± 116 0.002
Glucagon (pg/ml) 118.4 ± 55.5 165.6 ± 146 0.005 84.6 ± 46.2 138.7 ± 111 0.015
Ghrelin (pg/ml) 103 ± 53 103 ± 70 0.643 115 ± 59 111 ± 66 0.469
Values are means ± SD. P values between the groups were calculated by generalized linear mixed model. Total n=28. RHI group n=14, RLI group n=14. Abbreviations: RHI, relatively high fasting insulin; RLI, relatively low fasting insulin levels.
Table 4
Postprandial differences between the RLI and RHI groups when comparing beverages with high- or low carbohydrate contents.
Variable
AUC for high-carbohydrate drinks RLI AUC for high-carbohydrate drinks RHI p
AUC for low-carbohydrate drinks RLI
AUC for low-carbohydrate drinks RHI
p EE (kcal) 5734 ± 1082 6417 ± 1376 0.108 5469 ± 1079 6213 ± 1324 0.017
Suppression of hunger (AU) 1.61 ± 0.37 1.45 ± 0.38 0.238 1.66 ± 0.36 1.68 ± 0.37 0.965
B-glucose (mmol/L) 16.62 ± 1.24 18.19 ± 2.91 0.007 15.26 ± 1.19 16.58 ± 1.97 0.032
Insulin (pg/ml) 3328 ± 1201 6492 ± 3725 <0.0005 2161 ± 728 4344 ± 2075 <0.0005
GLP-1 (pg/ml) 39.27 ± 19.84 89.46 ± 120 0.002 49.99 ± 21.4 92.68 ± 118 0.001
Glucagon (pg/ml) 94.7 ± 50.1 152.3 ± 139 0.008 108.2 ± 52.0 150.2 ± 122 0.018
Ghrelin (pg/ml) 117 ± 52 112 ± 71 0.557 101 ± 52 101 ± 65 0.585
Values are means ± SD. P values between the groups were calculated by generalized linear mixed model. Total n=28. RHI group n=14, RLI group n=14. Abbreviations: AUC, area
under the curve; AU, arbitrary units; RHI, relatively high fasting insulin; RLI, relatively low fasting insulin levels.
Figure 1 Caption: Consort flow diagram of the study
Figure 2 caption: Timeline of examinations Figure 2a, timeline for the single drink test occasion. Figure 2b, timeline for five small drink test occasion.
Abbreviations: EE, Energy expenditure; Hunger, assessment of satiety with visual analogue scales.
Figure 3 caption: Postprandial changes of serum GLP-1
Postprandial changes in serum GLP-1 in the group of 14 subjects with relatively low (RLI) or 14 subjects with relatively high fasting serum insulin (RHI) levels. Figure 3a shows
differences for single large drinks, 3b shows differences for 5 small drinks. Figure 3c shows differences between the groups regarding high carbohydrate beverages, and 3d shows effects of low carbohydrate drinks. Error bars show SEM. * p< 0.05 between groups by generalized linear mixed model.
Figure 4 caption: Postprandial changes of serum ghrelin
Postprandial changes in serum ghrelin in the group of 14 subjects with relatively low (RLI) or 14 subjects with relatively high fasting serum insulin (RHI) levels. Figure 4a shows
differences for single large drinks, 4b shows differences for 5 small drinks. Figure 4c shows differences between the groups regarding high carbohydrate beverages, and 4d shows effects of low carbohydrate drinks. Error bars show SEM.
Figure 5 caption: Postprandial changes of serum glucagon
Postprandial changes in serum glucagon in the group of 14 subjects with relatively low (RLI) or 14 subjects with relatively high fasting serum insulin (RHI) levels. Figure 5a shows differences for single large drinks, 5b shows differences for 5 small drinks. Figure 5c shows differences between the groups regarding high carbohydrate beverages, and 5d shows effects of low carbohydrate drinks in both groups. Error bars show SEM. * p< 0.05 between groups by generalized linear mixed model.
Figure 6 caption: Postprandial changes in sense of satiety
Postprandial changes in sense of satiety by visual analogue scales in the group of 14 subjects with relatively low (RLI) or 14 subjects with relatively high fasting serum insulin (RHI) levels. Figure 6a shows differences for single large drinks, 6b shows differences for 5 small drinks. Figure 6c shows differences between the groups regarding high carbohydrate beverages, and 6d shows effects of low carbohydrate drinks. AU, arbitrary units. Error bars show SEM.
S e ru m G L P -1 (p g /m l) 0 0.5 1.0 1.5 2.0 2.5 3.0 0 10 20 30 40 Time (hours) RHI RLI S e ru m G L P -1 (p g /m l) 0 0.5 1.0 1.5 2.0 2.5 3.0 0 10 20 30 40 Time (hours) RHI RLI S e ru m G L P -1 (p g /m l) 0 0.5 1.0 1.5 2.0 2.5 3.0 0 10 20 30 40 50 Time (hours) RHI RLI High carbohydrate drinks
S e ru m G L P -1 (p g /m l) 0 0.5 1.0 1.5 2.0 2.5 3.0 0 10 20 30 40 50 Time (hours) RHI RLI Low carbohydrate drinks
S e ru m G h re li n (p g /m l) 0 0.5 1.0 1.5 2.0 2.5 3.0 0 20 40 60 Time (hours) RHI RLI S e ru m G h re li n (p g /m l) 0 0.5 1.0 1.5 2.0 2.5 3.0 0 20 40 60 Time (hours) RHI RLI S e ru m G h re li n (p g /m l) 0 0.5 1.0 1.5 2.0 2.5 3.0 0 20 40 60 80 Time (hours) RHI RLI High carbohydrate drinks
S e ru m G h re li n (p g /m l) 0 0.5 1.0 1.5 2.0 2.5 3.0 0 20 40 60 80 Time (hours) RHI RLI Low carbohydrate drinks
S e ru m G lu c a g o n (p g /m 0 0.5 1.0 1.5 2.0 2.5 3.0 0 10 20 30 40 50 60 Time (hours) RHI RLI S e ru m G lu c a g o n (p g /m 0 0.5 1.0 1.5 2.0 2.5 3.0 0 10 20 30 40 50 60 Time (hours) RHI RLI S e ru m G lu c a g o n (p g /m l) 0 0.5 1.0 1.5 2.0 2.5 3.0 0 10 20 30 40 50 60 70 80 Time (hours) RHI RLI High carbohydrate drinks
S e ru m G lu c a g o n (p g /m l) 0 0.5 1.0 1.5 2.0 2.5 3.0 0 10 20 30 40 50 60 70 80 Time (hours) RHI RLI Low carbohydrate drinks
S u p p re s s io n o f h u n g e r (A 0 0.5 1.0 1.5 2.0 2.5 0.0 0.2 0.4 0.6 0.8 Time (hours) RHI RLI S u p p re s s io n o f h u n g e r (A 0 0.5 1.0 1.5 2.0 2.5 0.0 0.2 0.4 0.6 Time (hours) RHI RLI S u p p re s s io n o f h u n g e r (A U ) 0 0.5 1.0 1.5 2.0 2.5 0.0 0.2 0.4 0.6 0.8 Time (hours) RHI RLI High carbohydrate drinks
S u p p re s s io n o f h u n g e r (A U ) 0 0.5 1.0 1.5 2.0 2.5 -0.2 0.0 0.2 0.4 0.6 0.8 Time (hours) RHI RLI Low carbohydrate drinks