eEl?
<;'9-70-'13
COpy
2
JU~ALYSISOF SHEAR
TEST
STRUCTURER. O.
Ford
M. D. Vanderbilt
Structural Research Report No. 4
Civil Engineering Department
Colorado State University
Fort Collins, Colorado
80521
June, 1970
roo
J'HtLL.\ KfADJtfG ROOM
List of Tables . List of Figures v vi Chapter Page 1
Z
3 4 1 INTRODUCTION. 1. 1 Object. . . • • 1.2 Scope • . • • . 1. 3 Acknowledgm.ents. 1. 4 Notation. . . , • • . CONDUCT OF TESTING.2.
1 Introductory Remarks.
·
·
·
· · ·
· ·
· ·
2.2
Description of the Test Specimens.2.3
Mounting of Each Specimen ..·
2.4
Ins trumentation..
·
· ·
· ·
2.5 Testing Sequence.·
·
·
·
·
ANALYSIS ..
.
.
.
.
.
·
· ·
3.
1 Introductory Remarks.
1 1 2 3 5· ·
·
·
5·
·
·
·
5·
·
·
• 7·
· ·
·
8·
·
·
·
·
· ·
9
·
·
· · · ·
12·
· ·
·
123.2
Comparison of Measured and Computed Strengths·
12 (a) Review of Existing Formulas·
(b) Comparison of Strengths.
· ·
·
·
·
· ·
·
SUMMARY, DISCUSSION AND CONCLUSIONS . . 4. 1 Summary. . . • • . . • • • 4. 2 Discussion • . • • • • • 4. 3 Conclus ions. BIBLIOGRAPHY. TABLES..
... . .
.
FIGURES.· ·
·
·
12·
· · ·
18 • . . • 21 21 2226
28
30 33APPENDIX A. REACTION DYNAMOMETERS. • 52
APPENDIX B. CRACK DETECTORS. . • . • • 71
Table No.
Page
z.
1 Properties and Results of the Current TestSeries • • • • • • • • • • • • • • • • • • • •
.
.
• • • • 30 3. 1 Comparisons of Vcalc/Vtest for the Current
Tests~ • • • • • . • • • • • • . • • • • • • •
• • • • 31
3. Z Comparisons of Vcalc/Vtest for the CurrentFigure No.
2. 1 Typical Test Spec irrlen. . • • • • . 2. 2 One perc.ent Steel Arrangement . 2. 3 Two Percent Steel Arrangement .
2. 4 T est Fr'anl e., ... • . • • • . · . . • . • · • • · 2. 5 Test Fram.e F!1otograph with Beams Down • . 2.
6
Diagrcun. of Specimen Ready for Test2. 7 Slab with Bag
m
Place . . . • • . • • . • 2. 8 Strain Indica.tors . . • . . • . .2. 9 Slab mstrurnemtation Locations.
2. 10 Strain Gage Placement.. . . . . • .
Z. 11 Deflection Dials . . . . 2. IZ Completed Test Setup • . • 3.1 Plot of 'Vu/bcI~with rId.
3. Z
Plot of Vcalc/Vtest with r / d .4. 1 Vertical Force Reactions for Slab 8S 1 - 6. . 4. Z Vertical Force Reactions for Slab 8C 1 - 13 .
,
.
.
4. 3 Variation in Column Reaction/Total Reaction with Pressure ... _ • • . • . . . .
4. 4 Column Stra iDS for Slab 6C 1 -
9 .
4. 5 Column Strains for Slab 2C I - I I
4. 6 Colmnn. Strains for Slab 6S2 - 14. . . .
4. 7 Variation in V1l1/bd~~ with r /d for Present and
Page . 33 34
35
36
37. . .
3839
39
40 41 41 42 43 44 4546
47 4849
50Previous Test Series . . . • • • • . • 51
A. 1 First Generat:iicn Dynamometer . . . • • • . • A.2 Calibration Carve for First Generation Dynamometer . .
A. 3 Calibration Curve for First Generation Dynamometer . . A. 4 Calibration CUJl"ve for First Generation Dynamometer . . A. 5 Calibra.t:i.on Curve for First Generation Dynamometer . .
A.6 Variation of Reaction/Load with Pressure for Three
59
60
6162 63
Tests with Generation One Dynamometers. . . 64 A. 7 Second Generation Dynamometer. . . • . . • . . 65 A.
8
Second General:ion Dynamometer Wiring Diagram. . . . 66A. 9' Calibration CWl"ve for Second Generation Dynamometer. 67 A. 10 Calibration Curve for Second Generation Dynamometer. 68 A. 11 Variation of Reaction/Load with Pressure for Three
Tests with Generation Two Dynamometers. A. 12 Horizontal Reactions for Test 6S2 - 14
B. 1 Crack Detector • . . • . . vi
69
70 73
B. 2 Crack Detector Placement. . . • . . • B.
3
Variation in Crack Detector Reading withLoad/ Failure Load for Slab 4S 2 - 8 . . " • B.4 Variation in Crack Detector Reading with
Load/Failure Load for Slab 4Cl - 12 . • • B. 5 Variation in Crack Detector Reading with
Load/Failure Load for Slab SCI - 13 . . •
vii
74 75
76
INTRODUCTION
1. 1 Object
Because of the pos sibility of shear failure in flat plate concrete
floor systems, many investigators have performed shear tests to
obtain some relationship between shear strength and the concrete and
slab characteristics. Previous test programs were performed using
specimens assum.ed to represent the region of a flat plate around the
colum.n which was located inside the lines of contraflexure for
principle moments. However, these test specimens did not correctly
model real structures in terms of deflections, shears, in-plane
forces and shape of lines of contraflexure. Therefore, the object
of this test program was to test models of a reinforced concrete
test specimen which simulate the behavior of a continuous
multi-panel flat plate structure around an interior colum.n.
1.2 Scope
This report is based on the construction and tests to failure
of 15 reinforced concrete, flat plate structures made with
is given in this report and the behavior of the specimens is given
in a report by Shilling (17)*.
The test specimens were 10 I -
6"
square with a two inchthick slab and spandrel beams nine inches deep by six inches wide.
A square or round column stub was cast in the center of each
speci-m.en. The test variables were the ratio of column size to effective
depth (rId), the ratio of reinforcement and the column shape.
A complete description of the mounting, instrumentation and
testing procedure is given in Chapter 2. An analysis of the test
structure is given in Chapter 3 by comparing the test failure loads
to ultimate loads predicted by previously developed empirical and
semi-theoretical formulas. A summary of the report, discussion
and conclusions are given in Chapter 4. Appendix A contains a
detailed description of the reaction dynamometers and Appendix B
contains a detailed description of the shear crack detectors.
1. 3 Acknowledgments
This report was written as a Master's Thesis under the
guidance of Dr. M. D. Vanderbilt, Associate Professor of Civil
Engineering. A National Defense Education Association Fellowship
and a grant from the National Science Foundation made this study
possible.
Cement for the project was provided by the Ideal Cement
Company at LaPorte, Colorado. The test was carried out at the
Structural Engineering Laboratory at the Colorado State University
Engineering Research Center.
1. 4 Notation
Below are the definitions of symbols used throughout the
report.
B
=
diameter of circular columns or for square colUIllns the diameter of a circular column of equal area.b
=
critical shear perimeter taken at the colum.n.C
=
diameter of area inside inflection linesd
=
effective depth from compressive face of concrete to centroid of tensile steel.fl
=
compressive cylinder strength of concrete.c
f
=
splitting strength of concrete. spf
=
yield strength of steel.y
p ::; reinforcing ratio.
q
=
pfIf'
=
reinforcing index. y er
=
length of side of square column or b/4 for round columns.v
=
ultimate shear load.u
v
=
V Ibd=
shear stress at critical section.u u
Veale
=
calculated shear strength.Vflex
=
shear at ultimate calculated flexural capacity of specimen.Vtest
=
failure load of test specimen.CONDUCT OF TESTING
2. 1 Introductory Remarks
Extensive preparations had to be made before the specimens
could be tested. Section 2.2 gives a description of the test
specimens used in this test series. A complete listing of all of
the variables is given in Table 2. 1. The procedure used in mounting
the test specim.ens in the test frame is presented in Section 2. 3.
Instrumentation that was employed to obtain all the data is
described in Section 2.4. Finally, the procedure used in testing
the specimens to failure is given in Section 2. 5.
2. 2 Description of the Test Specimens
The shear test specimens used in these experiments were
10' - 6" square with the actual slab being
9' -
6" square as shownin Figure 2. 1. The slab was two inches thick with an effective
depth of 1. 5 inches measured to the contact surface between the
two layers of positive or negative steel. The column stub was cast
monolithically with the slab at the test specimen center s. The r / d
ratios of these slabs varied from two to eight. The two
reinforcing ratios tested were 10/0 and 20/0 for negative reinforcement
which were one-half the negative steel ratios of the center
reinforcing mat. The ratio of negative slab steel around the slab
perimeter was 10/0 for all speci.m.ens. The di.m.ensions and locations
of the steel are shown in Fig. 2. 2 and 2. 3. The reinforcement
in the slab portion of the speci.m.ens consisted of No. 2 deformed
bars while the spandrel beams had reinforcement consisting of
No. 6 bars with No. 3 stirrups" All mats were rigidly tied before
being placed in the forInt The slabs were cast and allowed to cure
five days or longer before being removed irom the form.
One of the first trial slabs had a stub on top of the slab with
side dimensions equal to the column dimensions. Because of
difficulties in testing this slab, the top stub was deleted for the
remaining speci.m.ens.
Table 2. 1 contains a complete list of all the parameters and
test failure loads of the current test series. All the slabs that
were tested to failure were given mark nmnbers shown in the table.
The first number in the mark is the r / d ratio, the letter stands for
the shape of the colurnn either square (S) or circular (C)~ the third
digit gives the steel reinforcement ratio in percent for the negative
steel over the column and the last digit(s) shows the sequence.
Some of the slabs with circular colurnns did not have integer r /d
ratios so the m.ark shows the near es t integer for r / d. The
slab are given in Table 2. 1. Splitting tests were not perforITIed for
the first three slabs. Therefore, in order to obtain f values for sp
these specimens, a relationship between splitting strength and
cylinder strength was determined using the other test data with the
result, f = 6. 1
,.pr.
Values in the last two columns were foundsp c
using the relations V /bd and V /bd~f' , respectively.
u u c
2.3 Mounting of Each Specimen
Each test specimen was cast in a form at some distance
away from the test stand. In order to facilitate movement of each
slab to the test frame, 3/8 inch diameter bolts were cast in place
in the four corners of the speciITIen. After the slab had cured, a
strain gage was mounted on the top of the slab two inches from the
colmnn to evaluate stresses during moving.
A fork lift was used to lift the slab from the form and to
carry it to the test frame located in the north end of the lab. The
strain gage was connected to a strain indicator and the resulting
strain due to the lifting of the slab was recorded. The average
strain for all test specimens was about 60 micro-inches per inch
-6
with the peak for one slab reaching 120 x 10 . If Young's
Modulus for concrete is assumed as 3,000,000 psi then the peak
stres s during m.oving was 360 ps i. It may be concluded that no cracking of the concrete occurred during moving.
The test frame contained five concrete columns with reaction
dynamometers mounted on the tops. Steel reaction beams and
columns completed the framework as shown in Fig. 2.4 and 2.5.
The slab was carried to the tes t frame and lo,vered to the four
corner dynamometers. The center dynamometer was mounted on a
set of 1- 3/4 inch diameter bolts so that vertical rnovement was
possible. To remove the strain in the slab that was incurred
through transport, the center load cell was raised until the strain
reading in the slab gage returned to zero and then the dynarnorneter
was secured. It was assumed that stresses in the slab portion
around the column were then close to the initial state of stres s that
existed in the form.
2.4 Instrumentation
A vinyl air pressure bag was used as the loading device for
applying a uniforrn load over the surface of the slab as shown in
*
Fig. 2. 6 and 2. 7. The pressure was monitored by a pressure gage
with a double check made with a mercury or water manorneter.
Force reactions were rneasured by the use of the dynarnorneters
located at the four corners and at the central column. A complete
description of these reaction cells is given in Appendix A. The
reaction cells and the slab gage were all connected to a strain
*The air bag was rnanufactured by Richardardson Manufacturing Co. I a Fort Collins firrn which specializes in the rnanufacture
indicator through two Budd ten channel switch and balance units
as shown in Fig. 2. 8.
Two crack detectors were used to monitor the formation of
the shear crack in the slab. These crack detectors are described
in Appendix B. The strains that the crack detectors produced were
read through a Hathaway 20 channel strain indicator; see Fig. 2.8.
Electrical resistance strain gages were also mounted on the
colUIllns for several slabs starting with slab 6CI-9. The strain
gages were University Precision Type 60 with a gage factor of
2. 05, a length of • 6 inches and a resistance of 120 ohms. These were located along one side of square colUIllns and one quadrant on
round colmnns as shown in Fig. 2. 9 and 2. 10.
Deflection dials were mounted under the slabs. They were
located on center lines from the central column to the spandrel
beam on the west side and in the southwest corner. The accuracy
of most gages was 0.001 inch. See Fig. 2.9 and 2. 10 for locations.
2. 5 Testing Sequence
Each slab required extensive preparation before the testing
could be performed. Length measurements were taken to make
certain that diInensions of the slab did not vary significantly from
the
9' - 6"
desired. The column gages, where used, were thenapplied with epoxy and later were wired. Next, the slab gage was
The slightly oversized vinyl air bag was placed on the slab.
Sections of plywood were placed at the edges and center of the bag
and then two reaction panels were put in place. The plywood
sections were used to seal any gaps between the panels and spandrel
beams. The bag and panels were situated inside the upper portion
of the spandrel beams as shown in Fig. 2. 6. Essentially the
confined bag acted as an "innertube" and was able to sustain test
pressures of over 5 psi while in an unconfined condition the bag
split at the seam at a pressure of less than 2 psi. Finally, the
steel reaction beams were put in place over the reaction panels.
Fig. 2. 12 shows the completed test setup.
All data recording devices were then zeroed. To do this
correctly, the plywood reaction panels were lifted from the slab
and strapped to the reaction beams. This gave a zero load on the
test specimen.
Static loads were applied to the specimens. The air pressure,
vertical reaction at the center dynamometer and OI).e crack detector
were monitored throughout the loading. Loads were applied in
steps and complete sets of data readings were taken everyone-half
psi. Load increments near the predicted failure load were
reduced so the slab reactions could be studied more carefully. The
specimen was loaded to failure with a reading being made of the
At one6 two and three psi and at failure, the flexural cracks
that formed on the bottom of the slab were marked. An illuminated
seven-power lens was used to thoroughly examine the bottom
surface.
All of the loading equipment was then removed so that the
final set of data could be obtained. Photographs were taken of the
wedge section that punched through the slab, with and without the
shattered concrete in place. Measurements were made of the shear
crack so that a slope could be determined. The slab was then
lifted from the frame, the bottom surface was photographed and the
ANALYSIS
3. 1 Introductory Remarks
Many shear strength equations have been developed in past
years. The more recent equations and methods of analysis are
presented in section 3.2(a). The current test series is analysed
using the equations presented in section 3. 2(a) with a summary of
the results being given in section 3.2(b). The calculated values of
shear strength are given in Tables 3. land 3. 2 with a comparison
being made between Veale, the calculated shear strength, and
Vtest, the tested shear strength.
3.2 Comparison of Measured and Computed Strengths Using
Exi s ting Formulas
(a) Review of Existing Formulas
The equation developed by Moe (15) is probably the most
studied shear strength equation, having been used by many
experimentalists since its development. Moe tested forty-three
specimens that were 72 inches square by 6 inches deep. He varied
the column size, steel orientation and size and position of holes
region of negative bending around a colum.n in a medium.-sized
flat plate floor slab. The assumed span length of the prototype
would be 15 feet. The equation Moe devised is good only for the
range of rId between 0.9 and 3.1.
The equation developed by Moe is
v
V u u.JF
=
bd.JI'"=
c c 15( 1 - 0.075 rId) 1+
5. 25 bd$ IVflex c • - - - (3. 1)The term. Vflex is included in this equation as a result of a theory
of shear failure developed earlier by Hognestad (7)
which related shear strength to Vflex. The term
$f"
was usedc
because shear failure was of a splitting type somewhat like
specimens under tension. The ratio rId has an effect on shear
strength since shear stress has been observed to increase with
decrease in rId ratios. Through a statistical analysis, Moe
obtained the constants in his equation.
Moe developed two design equations taking into consideration
values of
rId
which were less than 3 and greater than 3. These equations are: v=
(9.23 - 1.12 rId) ~ rId<
3 c v=
(2. 5+
lOrI
d)$f"
c rId> 3 , - - - (3. 2) • - - - (3. 3)Hognestad, Elstner and Hanson tested six slabs corresponding
tests, the experimenters used light-'weight concrete. A plot was
made of the test results comparing Vtest/bd~ andq,
=
Vtest/Vflex,c
Moe's test results were included on the same graph, and Moe's
equation was drawn on the graph to compare it to the test data. The
equation plotted through Moe's test data but the data found by
Hognestad, Elstner and Hanson plotted 2.50/0 lower. This led the
experimenters to introduce splittillg strength into the Moe equation
in place of com.pressive strength. The relationship they obtained
between splitting strength and compressive strength was
f
=
6.
7$'.
Substituting this into Moe's equation gavesp c V 2.24(1-0.075r/d}f v
=
~= ___________
s ...P
u bd 1+
(0. 784 bd f /Vn )
sp
ex • - - - (3.4)A comparison of this equation with their test data gave a better
comparison.
MO'wrer (16) did further tests of light weight concrete slabs.
The twenty-six specimens were four feet square and three inches
thick. The colum.n size, steel reinforcement and edge conditions
were the variables. The edge conditions tested were simply
supported edges and clamped edges.
The twenty-six slabs were tested and analysed along with
twenty-five slabs tested by Janney (10). These slabs were smaller
in size than previous tests. An in-depth analysis was made using
previously determ.ined equations. The results of the analysis
v
u
9.
7 (1" 0+
d/ r )bd$
=
1+
5. 25 bd$i
/Vflexc c
• - - - (3. 5)
This is a reanalysis of the constants in Moe's equation.
Yitzhaki m.ade an analysis of slabs based on flexural
strength (20.). The equation developed was
v
=
8( 1 - q/ 2)d 2 (144. 3+
o.
164 pf )( 1. 0+
O. 5 r / d), - - (3. 6)~ Y .
which was obtained from consideration of ACI' s ultinlate strength
theory for flexure. This equation takes into account the strength of
the
steel through the pf term. The effect of concrete strength is yaccounted for by (1 - q/2). The final variable of effective depth,
rId,
completes the equation format. At a distance d from thecolmnn edge, Yitzhaki finds the nominal shear stress to be defined
as
v
u
Vu
=
(1 _ q/Z)(d)(4r+
8d)=
149.3+
0,164 pfy , - - - (3. 7)which is a function of reinforcing strength only. Previous test
data were us ed to obtain the equation cons tants.
Kinnunen and Nylander experimented with sixty-one round
slabs and developed a highly complicated scheme for the analysis
of slabs (12). Their specimens were 171 em (5.83 ft) in diameter,
15 em (5.9 in) thick and columns were 5 cm, 15 cm and 30 cm in
variables with the reinforcement being in ring, radial or two-way configur a tions.
To obtain a solution using their equations requires the
solution of many equations in an iterative technique. The variable iterated upon is the distance y from the compressive surface to an imaginary conical shell which was derived from their theoretical structure. With a chosen value of y and the slab characteristics (ff, f , p, B" C" d), the equations can be used to calculate two
c y
values of ultimate load. One value of ultimate load is found by
considering the strength of the concrete and the other by considering the steel strength. If during an iteration, the two values of
ultimate load are not equal, the value of y is changed until the two ultimate load values become equal. The details of the procedure are described elsewhere (3, 16).
Kinnunen restudied the results of the two-way reinforced slabs that were tested by Kinnunen and Nylander since their initial theory did not give satisfactory results for two-way
reinforced slabs (13). Kinnunen added to the previous theory the effects of membrane and dowel action of the reinforcement. He concluded that these effects combined result in 35% of the total ultimate load with the dowel effect being 250/0.
The technique for solving the equations developed by
and Nylander. The series of equations to be solved is about twice the number as the Kinnunen-Nylander method. The same general theoretical structure was used in the analysis.
ACI Committee 326 studied many of the equations that had been developed prior to 1962 (2). They found that Moe's equation was the most applicable to design so the committee decided to modify that equation for use by designers.
To make the equation sim.pler, Committee 326 analysed the equation and rearranged its form. Since it is desirable to have the shear strength of a slab greater than or equal to the flexural
strength, the committee put the ratio <p
=
Vtest/Vflex equal to 1.o.
The resulting equation was invalid over the full range of variables used in practical design. A new equation was then developed which wasv :;:: 4(d/r
+
1),.,fF
u c , - - - (3.8)
which is applicable at the periphery of the loaded area,
The committee felt that the basic concepts of the 1956 ACI Code should be followed in the succeeding code (1963) and suggested
that the shear strength be calculated by the following equations:
v
=
v bd, v=
4. 0$f
u u u c , - - - (3.9)
The limit on v was obtained by letting
rId
approach infinity in uequation 3.8. This latter set of equations was accepted by the ACI Committee 318 for the 1963 Building Code Requirements for
Reinforced Concrete.
(b) Comparison of Strengths
Fig. 3. 1 shows a plot of the test data in terms of V Ibd~
u c
against the rid ratios. The circle or square depicts the shape of column and the post script is the percent negative steel existing over the column. Comparing the points for each separate
rId
ratio shows that the slabs with circular columns had larger ultimate shearing strengths than did the square columns of equal steel percentage. Stress concentrations in the square columns" as explained later. appear to be the reason for this phenomenon. Also" Fig. 3. 1 shows that the slabs with higher steel ratios failed at higher stresses for constantrId
ratios. The change in steel percentage did not affect the strengths of slabs having the larger columns as much as it did for the smaller columns. Dowel and membrane actions couldexplain part of the higher stresses for the 20/0 steel slabs.
Tables 3. 1 and 3. 2 show the analysis of the test series using the formulas and methods described in section 3.2(a). The shear loads at ultimate flexural strength of the slabs were computed by Shilling (I7). Columns headed with VHHE" VIS8 and V198 in Tables 3. I and 3.2 ar6 results of equations by Hognestad" Hanson
and Elstner, Kinnunen and Nylander and Kinnunen .. respectively. VMOE was computed using equation 3. 1 and VYITZ was computed 'Q.sing equation 3. 6. Following the columns of computed strengths are columns giving the ratio of computed strength to failure
strength (Vcalc/Vtest) with the mean .. median and standard deviation given at the bottom of the columns. The upper and lower lim its of Vcalc/Vtest found by each of the equations are underlined in the tables.
Of the previously developed equations, Moe's gives the best mean-standard deviation combination of 1.003 for the mean and
• 204 for the standard deviation. Kinnunen f s method gives a
surprisingly good mean of 1. 01 considering the magnitude of difficulty that exists in applying this extremely complex method. However, the predicted strengths showed a large scatter giving a standard deviation at • 300. The other equations show poorer
predictions of failure strengths. The conservatism. of the ACI Code equation is shown by the low mean of • 618.
All of the computations shown in Tables 3. 1 and 3. Z were obtained with the use of the Colorado State University Control Data Corporation 6400 electronic computer. The Kinnunen-Nylander and Kinnunen methods proved quite difficult to program.
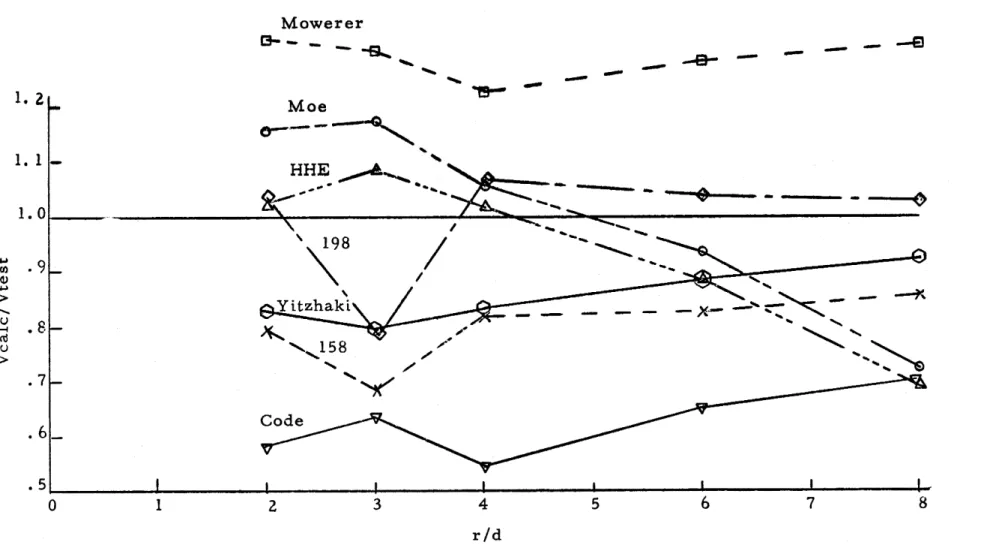
The average Vcalc/Vtest values for specific rId ratios are shown graphically in Fig. 3. 2. U sing this plot and Tables 3. I and
3. 2# it can be seen that no one particular equation appears better than the others over the full
rId
range.SUMMARY, DISCUSSION AND CONCLUSIONS
4. 1 Sum.mary
This report describes tests on 15 specimens of a new shear
test structure. The specimens were 10' -
6"
square with a twoinch slab. Spandrel beams were nine by six inches making the
actual slab
9' - 6"
square as shown in Fig. 2. 1. A square orcircular column stub was cast monolithically with the slab in the
center of the specimen. The variables were the r / d ratio,
reinforcement ratio and column shape.
The slabs were tested on a five column test frame with a
uniform static load being applied with a vinyl air bag as shown in
Fig. 2.
6.
Reactions at the five columns, deflections, load at initialshear cracking and strains near the slab of some of the colun1.ns
constituted the data taken. The test sequence consisted of loading
the specimens to failure while making data readings at every
one-half psi or smaller increment. Details of the test sequence are
given in Chapter 2.
An analysis of the ultimate load for the current test series
was made using the newer of the previously developed shear
made to show which equation best predicted strengths. The
equation developed by Moe gave the best results. Howeve:r I none of the equations were reliable throughout the range of r / d studied. Details of the analysis are given in Chapter 3.
Appendix A gives a description of the reaction dynamometers used in the test program. Appendix B gives a description of the shear crack detectors.
4. 2 Discussion
Fig. 4. I and 4. 2 show reactions for slabs 851-6 and 8CI-13 for various loads. All vertical reacUons at the four corners varied by not more than 220/0 in relation to each other. It was generally the
case that the reactions at A and C were larger than those and Band D. Because the magnitude of the reactions at the four corners were not equal, there could pos sibly have been some anti- symmetry in the loading or test specimens. The distribution of the reactions between columns for all slabs had the same general pattern as shown in Fig. 4. I and 4. 2.
The reaction at the center column varied between 27% and 430/0
of the total reaction throughout the range of loading as can be seen in Fig. 4. 3. The tests plotted in Fig. 4. 3 are the slabs which produced the upper and lower ratios of percent of column reaction to total reaction along with one of the slabs that gave intermediate values. All other slabs plot somewhel"e in between the limits
shown. The average of colwnn reaction to total reaction is about
350/0 at failure. An elastic study of the specimens made by Janowski (II) showed the columns should carry about 500/0 of the total load.
Strains in the columns of slabs 6Cl-9, 2CI-II and 652-14
are shown in Fig. 4.4, 4. 5 and 4.
6,
respectively. Fig. 4. 5 showsl:esults for only three gages because gages one and two failed to
work during the test. For the square column, 652-14, the strains
verify the findings of other researchers that a stress concentration
is present at the corners
(9,
11, 15). For circular columns, thestrains show that the stres s is fairly uniform around the column
periphery. The difference in stresses between the two columns
helps explain why the circular columns failed at higher stresses
than square columns of equal perimeter.
The crack detectors showed that the shear cracks opened at
loads greater than 500/0 of the ultimate load. The crack detectors that were on the corner of the column showed shear crack opening
before those on the side of the column on most slabs. Larger
principle moments and stress concentrations in the corner of the
columns caused the shear crack to open there first.
The current test series comes closer to representing real
structures than most of the previous test programs. Analysis of
show that there are several factors that should be contained within an equation which will accurately predict shear strengths. As can be seen by Fig. 3.2, four of the strength equations (Hognestad, Hanson and Elstner, Moe, Yitzhaki, and Kinnunen) give fairly decent plots of the average Vcalc/Vtest for specific r /d ratios. A look at the mean and standard deviations of Vcalc/Vtest for these equations shows that the equations have a large spread in the predictions of shear strengths.
Moe's. Hognestad, Hanson and Elstner's and Yitzhaki's equations are all dependent upon the flexural strength of the slabs. Yitzhaki based the flexural strength of his equation on the moment capacity of the slab while Moe and Hognestad, et aI, based flexural strength on a yield line analysis of the slab. Obtaining the Vflex terms for Moe's and Hognestad's equations through yield line analyses prove quite difficult for most continuQus structures. A sophisticated yield analysis will usually give a value for Vflex that will allow Moe's and Hognestad t s equations to predict the ultimate
loads fairly accurately. However, VMOE and VHHE are very sensitive to Vflex. The flexural strength term used by Yitzhaki is a more easily and definitely defined quantity and thus the ultimate values found using Yitzhaki's equation are not dependent upon ill defined param.eter s.
Kinnunen's method considers membrane and dowel effects of the reinforcing steel on shear capacity along with properties of
the concrete and steel. The test data plotted in Fig. 3. 1 shows
that the dowel and membrane effects may be present in the slabs.
The other factors that appear to be important are the steel
yield strength, column size and effective depth to the reinforcing
steel. These parameters are readily determined for anyone slab
and since the previously developed equations contain these variables
and give fair results using them, the parameters appear to be
important in predicting the ultimate capacity of the slab.
The main problem is that there is an excessive deviation in
the predicted strength us ing these equations. This problem could
arise because the parameters are not related <;:orrectly. A
re-analysis of the constants in Moe's, Hognestad's and Yitzhaki's
equations using the current test data could be accomplished to form
equations that would give better m.eans and standard deviations for
the current test series than do the present equations. However,
this method of finding an equation is based in part on the values of
the term. Vflex which is in itself hard to find.
ACI Corrunittee 326 has produced equation (3.9) that gives a
small standard deviation of the Vcalc/Vtest values for the current
test data. An equation similar to this with the safety factor not as
great would probably be fairly accurate at predicting the ultimate
shear capacities of slabs even though some of the previously
if the 4. 0 ~ in Equation (3. 9) is replaced by 6. 0
,.;rr
goodc c
agreem.ent between Vtest and Vcalc is obtained for all rId values.
4. 3 Conclusions
Fig. 4. 7 shows a plot of V Ibd ~ for the current test
u c
series along with those of previous test programs. By comparing
the points plotted the conclusion can be made that the test specimens
of this series produce results comparable to the other test programs.
However, the data for the current series plot somewhat higher on
the average than the data for the other test series. A possible
reason for the current test data plotting higher is that the test
specimens had the additional force and physical effects which exist
in real structures.
The results from the crack detectors showed that the shear
cracks usually opened at the column corners before opening in the
sides. The strain gages showed that stress concentrations existed
in the square columns at the corners near the joint with the slab.
The analogy which best explains the stress concentrations is that
of a flat plate (a sheet of paper) resting on four points (fingers of
the hand) which represents the corners of a column. Loading the
plate outside the four points results in the lifting of the plate portion
within the points generating a concentration of reactions at the four
way. The column strain gages also showed that round columns had
a nearly uniform stress distribution near the slab connection~
Because of the problems encountered in computing the shear
load of a colwnn at the flexural capacity of the slab, the theories
involving the Vflex term obtained through yield line analysis should
not be depended upon to give shear strengths of slabs unless a 500/0
error is tolerable. A new shear strength equation better relating
the shear strength parameters needs to be developed although
considering the scatter shown in Fig. 4. 7, it appears doubtful that
1. American Concrete Institute, HACI Standard Building Code Requirements for Reinforced Concrete, tI The Institute,
Detroit, 1963, 144 p., (ACI 318 - 63).
2. ACI-ASCE Committee 326, "Shear and Diagonal Tension, II
American Concrete Institute, Proceedings, 59:352 - 96,
March, 1962.
3. Criswell, M. E., IIStrength and Behavior of Reinforced Concrete Slab-Column Connections Subjected to Static and Dynamic Loadings, " University of illinois, Urbana, 1970,
(Doctor's Thesis).
4. Elstner, R. C. and Hognestad, E., "Shearing Strength of Reinforced Concrete Slabs, H American Concrete Institute,
J.;>urnal, 18:29 - 58, July, 1956.
5. Guralnick, S. and LaFraugh, R., "Laboratory Study of a
45 - Foot Square Flat Plate Structure, " American Concrete Institute, Journal, 60:1107 - 85, September, 1963.
7. Hognestad, E., "Shearing Strength of Reinforced Concrete Column Footings, " American Concrete Institute, Journal,
25:189 - 208 (1953).
8. Hognestad, E., Elstner, R. D., and Hanson, J. , "Shear Strength of Reinforced Structural Lightweight Aggregate Concrete Slabs, If American Concrete Institute, Journal,
61 :643 - 56, June, 1964.
9.
Ivy, C. B., "The Diagonal Tension Resistance of Structural Lightweight Concrete Slabs, II Texas A & M University,1966, 100 p., (Doctor's Thesis).
10. Janney, R., "Shear Strength of Flat Plate-Column Connection in Reinforced Concrete, " Colorado State University, Fort Collins, Colorado. 1965, 104 p., (Master's Thesis).
11. Janowski, R. H." "Elastic Analysis of Shear Test Plate, " Colorado State University, Fort Collins .. Colorado .. 1970, 91 p., (Master's Thesis).
12. Kinnunen, S. and Nylander, H... "Punching of Concrete Slabs Without Shear Reinforcem.ent, " Swedish Royal Institute of Technology, Transactions, No. 158, Stockhohn, 1960, 112 p. 13. Kinnunen, S., "Punching of Slabs With Two-Way Reinforcement
With Special Reference to Dowel Effect and Deviation of Reinforcement from Polar Symmetry, 11 Swedish Royal
Institute of Technology, Transactions, No. 198, Stockholm, 1963, 109 p.
14. Magura, D. D. II and Corley, W. G., "Test to Destruction
of a Multipanel Waffle Slab Structure, " National Academy of Sciences-National Research Council, Washington, D. C.,
1968, 118 p.
15. Moe, J., "Shearing Strength of Reinforced Concrete Slabs and Footings Under Concentrated Loads, tI Portland Cement
Association Research and Development Laboratories, Developnent Deparbnent, Bulletin D47, Skokie, nlinois, April, 1961, 135 p.
16. Mowrer, R. D. II "A Study of the Shear Strength of Lightweight
Reinforced Concrete Flat Plates, II Colorado State University,
Fort Collins, Colorado, 1963, 77 p., (Master's Thesis). 17. Shilling, R., "Behavior of Punching Shear Specimen, "
Colorado State University, Fort Collins, Colorado, 1970, (Master's Thesis).
18. Whitney, C. S. II IIUltimate Strength of Reinforced Concrete
Flat Slabs, Beatns and Frame Members Without Shear Reinforcement, n American Concrete Institute, Journal,
29:265 - 298 (1957).
19. Vanderbilt, M. D., Sozen, M. A., and Siess, C. P .. , "Deflection of Reinforced Concrete Floor Slabs, " nlinois University Deparbnent of Civil Engineering, Structural
Research Series No. 263, Urbana, nlinois, April, 1963, 287 p. 20. Yitzhaki .. D., "Punching Strength of Reinforced Concrete Slabs, " American Concrete Institute, Journal, 63:527 - 40, May, 1966.
lSI - 1 Il
3
1. 5 Z.01
.005
3997
388
43.9
9.65
536
8.49
351 - 2
18
4 .. 5
1. 53
.01
.005
3330
352
43.9
10.48
388
6.72
4S1 - 3
246
1. 5
4
.01
.005
3010
334
43.0
11,54
3Z1
5,85
3CI - 4
18
4.5
1.5
3 .01• 005
3200
335
43.013. 13
487
8.61
651 - 5
36
9
1. 5
6
.01
.005
3070
356
43.0
17.60
326
5.89
851 - 6
48
12
1. 5
8
.01
.005
2970
323
42.8
20.28
282
5.16
ZSZ -7
12
3
1.5
2
.02
.01
3370
338
46. 1
11. 13
619
10.68
452 - 8
24
6
1.5
4
.02
.01
3140
349
59.6
15.54
432
7.67
6Cl - 9
35. 3
9
1.5
5.88
.01
.005
3730
434
56c 8
21.63
409
6.68
w 08S2 - 10
48
12
1.5
8
.02
.01
3810
418
56.1
25.65
356
5.77
2C 1 - 11
12
3
1. 5
2
.01
.005
2894
295
56.0
8.77
487
9.07
4Cl - 12 24.25 6.063
1. 5
4.04 .01
.005
3215
422
56.1
16. 30
448
7.90
8CI-I346.5l1.89
1. 5
7.93 .01
.005
3478
358
56.0
22.68
318
5.40
652 - 14
36
9
1.5
6
.02
.01
2993
300
57.5
18.01
334
6, 10
4C2 - 15 24.3 6.07
1. 5
4.05
.02
.01
3117
323
55.0
21.70
595
10.65
aSI .. 1
9.fpD
Z4,4
11.66
1,Z08
10.861. las
13. 30 1. 378 7.53 .780Jl1
I;a
10.48
26.7
13.87
aLL
I~ I~
1~,90ll~al
15.43
II
~Zi
9.ao
,6S8
481 - 3 11.54
25.0
14.66
1.270
13.69
1.
186
16.93
i.46'1
11;02
.955
3el - 4 13. 13 25. 3 13.48 1.027 lZ.27.934
15.00 1.1429.23
.703 681 - 5 17.60 26,6 15.52 .882 15. 12 .859 ZI.Z9 1.210 14.72 .8368S1 -
6
20.Z8
31.4
14.22
.701*
-
13. 18
-
• 650
25.86
1.275
18.33
.904
ZSZ - 7 11. 13 43.7 11.82 1.062 10.4l.937
13.49
1.212
9.34
.839
4SZ - 8 15.54 57.7 17.90 1. lSZ 16.83 1. 083 ZO.67 1.330 IS.09 .971 6CI - 9 21.63 38.S 18.82 .870 19. 60 .906 2S.47 1.178 IS.89 .734 852 - 10 ZS.65 65.0 19.62 .765 19.78 • 771 35.69 1. 391 25.58 .997 2CI - 11 8.77 29.4 10.S3 1.200 8.86 1.010 12.01 1.370 7.84 .894 4Cl - 12 16. 30 34.3 16.39 1.005 17.74 1.088 18.97 1. 164 11.98 .735 ~ ... 8Cl - 13 22.68 39.3 16. 15 • 712 15. 14 • 668 29.00 1.279 19.81 .873 652 - 14 18.01 56.2 19. 10 1.061 16.28 .904 26.20 1.455 19.66 1.091 4C2 - 15 21.70 52.5 17.67 .814 15.6Z .7Z0 20.46 .943 14.78-
• 681 Mean 1.003 .938 1.284 .8S9 Median 1.026 .934 I.Z79 .873 Standard D-eviation .Z04 • 183 • 147 • 118*
Underline values represent high and low values within columnZSI - 1 9.65 24.4 7.00 .7Z5 8.33 .863 5.80 .601 3S1 - 2 10.58 26.7 8. 13 .775 9.49 .905 7.06 .674
481 - 3
11.54
25.0
8.83
.765
10.70
.928
8.39
.727
3el - 4 13. 1325.3
7.82.595
8.87
:J!.1.i
7.91
.603
6S1 - 5 17.60 26.6 11.04 • 627 13.Z5 .753 11.87 .674 851 - 6 ZO.Z8 31.4 13.06 .644 15.70 .774 15.01-
.740 2SZ - 7 11. 13 43.7 9.42 .846 13.50 I.Z13 5.33 .479 4SZ - 8 15.54 57 .. 7 15.84 1.019 2Z.65 1.457 8.57 .552 6Cl - 9 ZI.63 38.5 13.48 .6Z3-
15.58 .720 13.93 .644 8S2 - 10 25.65 65.0 30.96 1.207 37.48 1.461 17.00 • 663 2C1 - 11 8.77 29.4 7. 11 .810 8.89 1.014 5.88 .670 4Cl - 12 16.30 34.3 11.73 .720 13.61 .835 8.38 • 514 IN 8Cl - 13 22.68 39.3 16.52 .728 19.54 .861 15.70 .692 N 6S2 - 14 18.01 56.2 22.27 1.237 Z9.68 1.648 11. 72 • 651 4(;Z - 15 21.70 52.5 17. 15 • 791 22.58 1.040 8.27 • 381 Mean .808 1.010 .618 Median .765 .905 • 651 Standard Deviation · 199 .300 .099r
r-1~
'"
'"
-r .1 ,.. C1'-
0L_.J
...
A At
-
LJ
9' -6"
10' - 6"
Section A - ASi"
47 bars @2i"
... ;.1fI, 2 , 4' - 0" 3' - 3" 23/4" .... -1\ 18 bars @ 2-}fI--
... 2 3/4" 3 3" 1 -~..
-
---
Go)>
....
.,
~
Go)e
...
Go) Go) ~ til g-E--t ~LJ
-A G)>
....
.,
....
al 0 £l.-...
Go) Go).,
til§
.,
.,
0 !Xl -.9"
4' 8 BarspI
5 Bars5'
8 Bars,
9"
...
-
" "' @ 5" @5"
@ 5H .. ~ T9'
- 0" "' -,•
-;.
.
. .
.
.
.
.
.
.
...
. .
.
.
.
.
.
. .
.
.
.
Section A-
A•
•5l t 47 Bars @ 2~"
San
..
~ .~ 1 1 ,. ., ,. 4' - 0 ~. 2 1I a.!.
~ -2 1/8" 3' - 3 36 Bars @ 1111 A,...
3' - 3..
'" r-
,.Gi
>
....
...,
'"
~ Z-
...
G) G)...,
til g-~II
-f-~ ~.-
G)>
....
...,
....
co 0 Ilt-...
G) G)...,
tile
0...,
...,
0 ~9"
,.
2"16
Bars 2.1" 2 ~9
Bars J ... ~.111 2 16 Bars 2" ... 1\9"
... @ 2.111 2 @ 2.111 2 @21"
9' -
00
,
-N 0 I-
In 0 0 I I 0'"
~ 0 I -In 51 - 0 51 101 - 0 j=
J - t I J-
In ':;IN 0' I -('t")Fig. 2.5. Test Frame" Photograph
Hl=
-
,-I
HI'-
-
-
- 'I
Section A - A1 T -
-
-
I
-II
I
I
fI
I I
I
I
!
I
!
I
II
I
--
--I
01
,
t
I
I__ L
To Water or Mercury Manometer- ==IH
\.
\ Fig • . 2. 7. Slab_.W:ith Bag in Place
• I
f I I
...
z
o-'
~ .-I o I ;.. o-'
....
Crack Detectors Deflection Dials Strain Gages , I I 5 4 3 2 1 I I J tFig. 2. 10. Strain Gage Placem.ent
'"d
"""
J.toS
....
~~v
'"d .0"""
'"d::s
... >
J.t ~ 0..,
0 ...-4 p.. -".
('t').
bO....
~ N -" --~---~---~~---~---~~---~---~---~ o o1.2 1. 11-Moe
o---~
,
--
--
-~
---
0
-
.
---~.9
/
OJ ~ :>-... u ....-f ro u:>
I --K~,
158 ","
. /' y
.6._
• 51 r I I I Io
1 2 3 4 56
7 8 rIdFig. 3.2. Plot of Average Vcalc/Vtest with rId
.~ .~
R
o
....
..&.) U ftS Q) ~ 2015
10 5A
B
r;:::======:::::;, E Dc
~Dynarnorneter
Des ignation 4. 2 psio
~A---~B~---~C~---~D~---~E Reaction Pointzo
15 s:: o ~ 10 CJ c1S Q,) ~ 5o
A B C D E Reaction Point0 0
...
~§
R • ..-4 0 ~.,.., u~ nSu
(1) nS ~(1)s::~
§
3
.-f 0 o E-t U 45 40o
-35L
e e
8e
30 25 , I t ' I I Io
1 2 3 4 5 6 Pressure in psiFig. 4. 3. Variation in Column Reaction/Total Reaction with Pressure
•
800
700
Q,~
600
///~
5432
''I
Gage Designation500
-.D 0...
>< Q400
....
." k ~ til300
800
700
600
500'
H.S
400
ttl J.I ..to) til300
-Ozl
5L
Gage Designation o~________
~__
~____
~________________
~ 5 4 3z
1 Gage Number800 700 600 500 ~ 400 s::
....
cd k...,
CIl 300zoo
100 5 4 3 Z 1 Gage Designationo
~______
~~______
~I~ ______ ~I________
~. 5 4 3 Z 1 Gage Numberv
u bd-rf
fc
Fig. 4.7.16
14
12 10 86
4z
o
,
e 1 v "Iilz
4rId
(;) Elstner &t Hognestad
[!] Moe
V Kinnunen &: Nylander x Ford &: Schilling ~ Taylor &: Hayes
lZI Tasker &: Wyatt £ Scordelis &: Lin
*
University of nlinois • Rosenthal• Forsell &: Holmburg Richart
+
peA Flat PlateVariation in V Ibdt.{ff with
rId
for Present and Previousu
c
Test Series (from Mowrer (16) )
Dynamometers
Five dynamometers were required to obtain the reaction data for each test. These reaction cells were fabricated from aluminum tubing and plates. The structural shape of the dynamometers is shown in Fig. A.I. Located in the center of the top plates was a socket which accepted a 1-1/2 inch steel ball which formed an idealized simple support for the test specimens. The tubes were instrumented with electrical resistance strain gages. The strain gages were SR-4 Type A-3-S13 gages with a 2.05 gage factor, 1.0 inch gage length and 120 ohms resistance. The gages were applied with Duco cement.
Two generations of dynamometers were designed. The first generation had a strain gage configuration of three gages mounted at 120 degrees from each other around the tube at mid-height as shown in Fig. A. 1. It was desired to obtain the vertical reaction plus two orthogonal horizontal components. Therefore, with this configuration, a modified flexibility analysis method had to be applied to change strain reading s into load readings. The theory used is as follows.
The three reaction components were labeled vertical (V), north
(N) and east (E). With the three strain readings as knowns,
equation Al shows the conversion of load to strain.
all V + all N + a l3 E = € I all V+a 2l N+aZ3 E=€2 a
31 V
+
a32 N+
a33 E = €3• - - - A. I
The a .. coefficients were not known and so had to be determined
1J
experimentally. Equation A. I may be written in matrix form as
all a I2 al3
all all a 23 = , - - - A.2
a
31 a32 a33
or
[A]{F}
=
{D}
• - - - A. 3It was desired to calculate F for the strain values obtained from
the dynamometers, hence
{F}
=
[A]-I {D}
• - - - A.4The A matrix was obtained through loading the reaction
cells in the three different directions. To determine vertical
materials testing machine. To obtain Nand E calibrations, a
dynamometer was placed in the testing machine at a 90 degree
angle to the direction of load application. In this lateral position,
the load was applied sequentially in the north, south, east and west
directions. The calibration for the north was taken as the average
of the north and south and the calibration for the east was taken as
the average of the east and west data. The slope of each
strain-force curve was placed in the appropriate position of matrix A. The
inverse of A was then found so that equation A.4 was satisfied.
Strain readings D of the slab test could then be taken and reactions
F could be computed using A. 4. The first six slabs were tested
using these reaction dynamometers.
Fig. A. 2 through A. 5 show typical plots of the calibration
curves for the first generation dynamometers. From these plots
some problems with the dynamometers can be detected. For a
vertical load in the dynamometer, the slope of the three gages
should be identical. Because of the characteristics of the tube and
because of the quality of the gages, the slopes of the curves are not
equal. The same characteristics are present in the lateral load
calibration curves.
Another problem is the fact that the calibration curves did not
plot through zero. The gages were zeroed at the beginning of the
test so a plot through zero should have resulted since elastic
The test results obtained using these dynamometers were not satisfactory as is shown by the plot of the ratio of reaction to load (load = air pressure ti.m.es area, both correct to about l%) against pressure in Fig.
A.
6., The plot shows instability of thedyna-mometers for the different tests. The rapid change in the ratio at low pressures can be attributed to the low strain readings produced. The accuracy desired was not obtained with these dynamometers so the second gene~ation dynamometers were produced.
The second generation reactio:l dynamometers were instru-Jnented with twelve strain gages, 6 active and 6 dummy as shown
in Fig. A. 7.. The arrangement consisted of three full bridge systems with Z active and Z dummy gages per bridge as shown in Fig. A.8. One bridge was used to measure vertical loads while the other two bridges measured lateral loads. The second generation dynamometers had Micro-measurement Bakelite, foil gages with Z. 06 gage factor, 120 ohm resistance and 0.5" length. The gages were mounted with. a special adhesive which required baking to cure.
The active gages in the bridges were arranged so as to read only the effect desired. In order to read vertical reaction only, the active gages were located on opposite sides of the bridge. In this manner the brmee should cancel any bending effect. For the horizontal reactions the active gages were located on adjacent sides of the bridge. In tDis way the bridge should cancel any vertical effect.
Calibration of the second generation cells was done in the same
manner as the first generation. With this system the calibration
curves could be used directly to compute load readings.
Fig. A.9 and A. 10 show typical calibration curves for the
second generation dynamometers. Since the strains were taken on
opposite sides of the dynamometers, a better average of strain was
obtained over the cross-section than was obtained for generation one
dynamometers. The gages used were of much improved quality
than existed on the first generation load cells. With these
improvements good calibrations were obtained. The curves plotted
through zero and the east and north calibrations were nearly equal
for the individual dynamometers as should have been the case.
Better results were obtained with these dynamometers as
can be seen by the plot of the ratio of reaction to load against
pressure in Fig. A. 11. The plot shows results within the limits
desired at the ultimate failure load region. Also, the stability of
the second generation dynamometers is greater than the first
generation dynamometer s as can be seen by comparing Fig. A. 5
and A. 11.
Figure A. 12 shows the horizontal reactions of the five
reaction dynamometers for the test 652 - 14. The reactions shown are typical for all the test specimens. All reactions at the corners
that were present in the spandrel beams. The center dynamometer
shows that there was some lateral load on the column, thus the
column did not punch through with pure normal forces present.
This was typical for other test specimens also. The center
dyna-mometers for YIlost slabs showed somewhat the same maximum
lateral force of about 500 pounds. Two specimens showed a lateral
force at the column of over 1000 pounds. Test 452 - 8 showed a
maximum. lateral reaction of 1236 pounds. The resulting moment
of 7. 6 inch .... kips existed at the column connection with the slab, but
because of the magnitude of the vertical load, the resulting
eccentricity was only. 53 inches. The maximum eccentricity of
.57 inches was observed in slab 4C2 - 15. The moments in the
columns did not seem to cause any of the strength discrepencies
found in the test.
Fig. A.12 shows that the sums of the lateral reactions are
not equal to zero as was expected. The percent of the resultant
lateral reaction compared to the total vertical reactions is shown
in Fig. A. 12 to be less than one percent. None of the other slabs showed a resultant lateral reaction greater than one percent of the
total vertical reaction. Unequal load distributions by the air bag
against the spandrel beams might have been the cause of this
On the whole, the signs of the resultant lateral reactions did not change for anyone particular slab though the signs might be different for different slabs. In other words, the lateral load resultants were always in constant directions ..
j - - ' //~- ...
",
-
' / " , -II \\ Strain Gages 3"cp
Alum inurn Pipe2_~
If0 \\
\ \ I!
1/
, / ... ,.. " / ; t '----= ...
II
-':;1' 00 .qczO
15 10 5 CD DYNAMOMETER NUMBER 1 Vertical Load Gage No.1 fA -in Slope=
40. 00 k" Ip ~ o~---~---~---~~---~....
~s::
....
.gzo
cd o ....1 15 10 5o
Vertical Load Gage No. 2 fJ -in Slope=
41.16 k" Ip ~---~---__
~I---~---~o
zoo
400 Strain x 106 600 80020
.,
Pc15
10 5 Dynamometer No. 1 Vertical Load Gage#3
.
IJ.--ln Slope=
43. 25 - k ' lp ~ 0 ~ ________ ~ ________ ~ ________ ~~ ________ + -_ _ ~....
o
0 200 400 Strain x 106 North Load Gage #1 . E.L-tn Slope=
222.2 k' tp 600 800m Clt
....
~ ~....
'tS'"
0..:t
43
z
1 0 4 3 2 1 Dynamometer No. 1 North Load Gage #2 . IJ-in Slope=
120 - k-•. lp North Load Gage #3 . IJ.-in Slope .=
4 3 -kipo ______________
---~---__
~---~----~o
200 400 600 800 Strain x 1064 3 2 I
o
4 3 2 I Dynamonleter No. 1 East Load Gage#2
Slope=
182
~-in
kip ~---~---~~---~---~~----East Load Gage#3
~-in Slope -199
kipo
~O~---2~OO---40~O---6~O~O---8-040--- Strain x 106
Reaction Force
1.2
1. 1 1.0 451. 3 651 - 5 • 90 10I
2r::r: '34
~ Pressure in psi £JFig. A.6. Variation of Reaction/Load with Pressure for Three Tests
With Generation One Dynamometers
0'
Strain Gages