Master thesis
in Applied environmental Science (15 ECTS Project)
MASTER
THESIS
Wetland biomass - suitable for
biogas production?
Author: Viswa Raj Akula
Supervisor: Marie Mattsson and
Niklas Karlsson.
Main Subject: Applied Environmental Science. Total of Ects: 60
Acknowledgements
I would like to express my gratitude to my supervisor Marie Mattsson for her useful comments, guidance, encouragement, persistent help and for giving me an opportunity to work on my thesis under her supervision. I also thank Niklas
Karlsson who helped me a lot during and after the experiment.
I would also like to thank Stefan Weisner for giving his valuable suggestions.
My sincere thanks to my friends who gave me so many good memories in the AES class.
I thank my parents Surekha and Mohan Rao for their encouragement and
support, my cousin Vikram Akula for supporting and inspiring me during difficult times.
Abstract
Wetlands have long been used as natural waste water treatment systems to remove excess nutrients from agriculture or other waste waters. Common reed (Phragmites australis) is the most prominent feature of wetlands in Sweden. This wetland vegetation needs to be harvested and can be used as substrate for biofuel production. In this study, common reed and submerged vegetation from two wetlands outside Halmstad have been harvested in August and October and have been used as substrate for anaerobic digestion in a laboratory experiment. August harvested common reed produced on average 147 ml CH4/g VS, October harvested
common reed produced 150 ml CH4/g VS while August harvested free floating
vegetation produced 130 ml CH4/g VS. Similar methane production was seen from
reed harvested in August and reed harvested in October, but the dry weight of October harvested reed is much higher indicating that harvesting in October can be beneficial not only because of more biogas production but also because a late harvest reduces the amount of biomass to be harvested and transported. Apart from that harvesting in October will not affect the migratory birds which use wetlands as resting place during autumn migration.
Table of contents Page
1. Introduction 1
1.1 Wetlands 1
1.2 Biogas production by anaerobic digestion 4
1.3 Process involved 4
1.4 Limitations to biogas production 5
1.5 Types of digesters 7
1.5.1 Covered lagoons 7
1.5.2 Complete mix digester 8
1.5.3 Plug flow digesters 8
1.5.4 Fixed film digesters 9
1.5.5 Batch process dry fermentation 10
1.6 Plant biomass for biogas 10
1.6.1 Wetland plants 11 1.7 Pretreatment 12 1.7.1 Physical pretreatment 12 1.7.2 Phsyciochemical pretreatments 12 1.7.3 Chemical Pretreatments 12 1.7.4 Biological pretreatment 13
2. Method description 13
2.1 Sampling 13
2.2 Experiment design 13
2.3 Calculating methane production 15
3. Results 15
4. Discussion 20
5. Conclusion 22
1
1. Introduction
Biomass is defined as biological material from either alive or recently alive organisms. Biomass includes byproducts and residues of crop farming and processing industries such as straw, husk, cobs, stalks, leaves, bark, fruits, cutting vines, in addition to animal refuses and plant products used in agro-industrial processing such as grains, bean, flower and some special products such as cassava and seaweed (Klass, 1998). It is a clean renewable energy source which can substitute fossil fuels which are used for transportation. It is considered carbon neutral as there is no net gain of carbon into the atmosphere when it is burned or when used in other ways (Xu, 2009).
Biomass can broadly be classified into two categories (Fig. 1).
Vegetation: Includes energy crops, wood, agricultural and forest residues and floating plant waste.
Organic waste: includes animal waste, municipal waste and organic industrial waste.
Of these different kinds of biomass material this thesis focus in natural vegetation types which are found in constructed/natural wetlands.
1.1 Wetlands
Agriculture and storm water runoff have caused eutrophication and related problems in the Baltic Sea and Kattegat. The Baltic Sea is particularly sensitive to nutrient input and eutrophication because of its large catchment area associated with human activities and due to the small water body characterized by its distinct topography. Furthermore the single narrow outlet to the North Sea results in a limited exchange of sea water. Consequently, the high human induced nutrient loads and the long residence time of water lead to N accumulation and, thus, cause typical eutrophication effects (Pawlak, 2009,) (Helcom , 2009a).
During last 20 years interest in newly constructed water bodies like wetlands and ponds has increased many folds. These wetlands can be constructed for the sole purpose of nutrient retention (Herrmann, 2012).
2 Fig. 1. Classification of biomass
Apart from this there are other benefits with wetlands including increased biodiversity, ground water recharge, improved esthetic value, flood control etc. Storm water often transports heavy metals, nutrients, oil and other chemical to these water bodies (Söderqvist, 2002). These are removed from the water by different processes such as sedimentation, flocculation, attachment to phosphorous; denitrification, or that nutrients are used by the plants or other microscopic organisms (Endreny, 2004). Wetland plants are the most prominent and essential part of the wetland ecosystem. They evolved from the upland plants but are different from them in that they are much more adapted to live in low oxygen and carbon dioxide conditions ( Cronk, 2009).Vegetation in wetlands grow naturally or it is planted on purpose. Within 12-18 months after harvest wetlands are often fully covered with vegetation again. Growth of vegetation and removal of nutrients mostly occurs in summer, in countries such as Sweden where the winters are harsh and cold, growth of the plants ceases and there is a chance that part of
Biomass Natural vegetation Energy crops Agricultural and forest residues Organic wastes Municipal and animal waste. Industrial waste
3
the nutrients fixed is let back into water. For this reason it is advised that vegetation is harvested mid-autumn, though this is debatable.
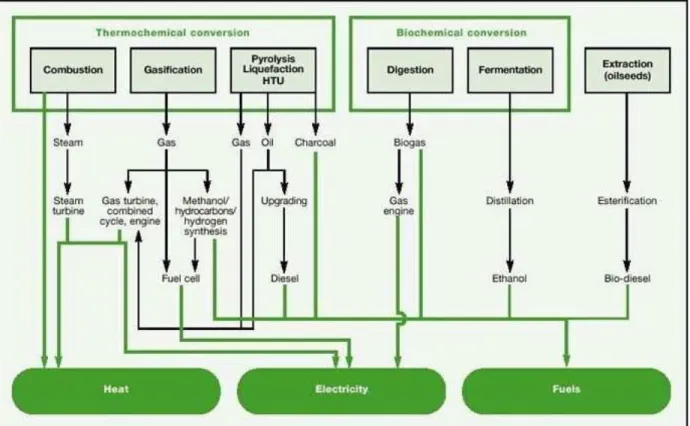
Biomass can be utilized to produce energy in different ways but the conversion routes are broadly classified into two, Thermochemical conversion (heat and pressure-based conversion) and Biochemical conversion (Biological conversion by microbes) depending upon the way in which it is utilized. Different thermo and biochemical conversion routes are shown in Fig 2.
Figure 2. Thermochemical and biochemical conversion routes of Biomass ( Barthel, 2000)
Some of the important ways in which the biomass can be used for energy production are:
1. Gasification of biomass (syngas production and H2 production)
2. Pyrolysis (Charcoal production) 3. Production of biogas
4
1.2 Biogas production by anaerobic digestion
The first use of biogas dates back 3000 years back in China ( Li, 2010). Much later a digester was made in the 1840’s in a city in New Zealand and a first digestion plant was built in Mumbai, India in 1859 Many attempts were made in New Zealand and in India to harness the energy from biomass but these were not successful. (Beginners Guide to Biogas). In 1895 in the UK biogas was used to light up the streets and this was the first instance in modern history where biogas was used (Abbasi, 2010)
590 to 800 million tons of methane are released each year into the atmosphere via natural decomposition of organic matter (ISAT/GTZ, 1999). Methane is 23 times more potent greenhouse gas than carbon dioxide; it is often overlooked greenhouse gas (Fogarty, 2007). But methane has the calorific value of 21-24 MJ/m3 (Dimpl, 2011)which makes it very good fuel source.
Biogas is made up of 50 to 70 % of methane and 30 to 50 % of carbon dioxide. Apart from this some unwanted gases are also produced including hydrogen sulphide (up to 1%) (Sasse, 1988) .
1.3 Process involved
Anthropogenic anaerobic bioreactors make use of this biochemical processes to decompose different types of biomass to produce biogas (Bond, 2011).
Production of biogas from any kind of complex biomass involves 3 steps and it is the result of 3 different classes of bacteria working in series. In the final step methanogenic bacteria convert acetate and hydrogen into methane and carbon dioxide.
Hydrolysis and acidogenesis: The first group of bacteria secretes extracellular enzymes which can hydrolyze long chain/Polymeric materials to simpler monomers like glucose and fructose. Enzymes like cellulose, amylase and protease are involved in this process. Polysaccharides such as cellulose are very hard to breakdown, only cellulose can do this. Cellulase is composed of three distinct enzymes. These 3 enzymes namely endo-3-1-4 glucanases, exo-p-1,4glucanases and p-glucosidase. These enzymes function together to convert cellulose to monomers of glucose. Later this glucose is converted to acetate, ethanol, lactate etc., via Embden-Meyerhof-Parnas Pathway.
5
Acetogenesis and dehydrogenation: The fatty acids which are formed in the end of hydrolysis and acidogenesis are converted to hydrogen and acetic acid by acetogenic bacteria. Acetogenic bacteria are H2 inhibited, so they cannot grow
without the presence of H2 consuming bacteria such as methanogenic bacteria.
Apart from that H2 production from fatty acids is energy consuming reaction which
is provided by methanogens, making it possible for the reaction to take place. Thus resulting in the formation of acetate and little CH4.
Methanogenesis: There are two groups of methanogens H2/CO2- consumers and
acetate consumers. H2/CO2- consumers use CO2 as electron acceptor and convert
it into CH4.
The Archaebacteria unlike acetate consumers cleave the acetate at the methyl group and reduce it to CH4 with the help of electrons which are derived from the
oxidation of carbonyl group to CO2. (Ferry, 1992) (FAO Coperate document
repository, 1997)
For a given organic substrate it is possible to calculate how much methane can be produced by using a formula
CnHaOb + (n-a/4-b/2)H2O (n/2-a/8)CO2 + (n/2+a/8+b/4)CH4
Example: If n=6, a=12, b=6 then
C6H12O6+ 0H2O 3CH4+3CO2 (Nijaguna, 2002)
1.4 Limitations to biogas production
But not everything that is used for anaerobic digestion can be converted to biogas, in other words there is no substrate that is digested to 100%. There are quite a few reasons for this; some of these are improper physical-chemical factors, usage of biomass to form new bacterial cells and presence of substances that are not easily biodegraded such as lignin. Carbon to Nitrogen ratio(C:N) is one of the most important physicochemical factor that effects the bio-conversion of biomass to biogas. 25-30 is the optimum C:N ratio that is ideal for biogas production. pH and temperature also effects the biogas production by interfering with microbial activity. A pH which is around 7.0 to 7.2 is the best for maximum production but anywhere between 6.6 to 7.6 is good. When pH drops to 5.0 it drastically effects
6
the biogas production, because at this pH the growth and multiplication of cellulose degrading bacteria and amylolytic organisms is hampered. It was also found that microbial population was reduced by 2 to 4 times when pH drops below 5 (Nijaguna, 2002) (Ramasamy, 2010) (Kurnani Tubagus Benito Achmad). The 3 steps mentioned before (Hydrolysis, Acetogenesis and Methanogenesis) occuring during the biogas production work best at different pH levels. Hydrolysis and Acidogenesis at optimum between 5-6 and the methanogenesis is best between 6.5-7.5 (Zhao, 2011). Temperature also plays an important role in the production of biogas. Biogas production can be done at 3 different temperature ranges 0-20oC (Psychrophilic), 20-45oC (Mesophilic) and 40-600C (Thermophilic) but generally mesophilic and thermophilic temperatures are preferred over psychrophilic temperatures because they are easy to maintain. Apart from that mesophilic and thermophilic anaerobic digestion have their own advantages. In mesophilic anaerobic digestion the material can be stabilized and sludge can be reduced. In thermophilic anaerobic digestion a lot of biogas can be produced because of the faster reaction time, more methane content can be obtained and low hydrogen sulphide content in the biogas produced etc. They also have their own set of disadvantages Mesophilic anaerobic digestion often needs a longer retention time and large digestors are required because of a slow reaction time. Thermophilic anaerobic digestion can be hard to maintain at the high temperatures, can be more sensitive to fluctuations in temperature and heavy metals. Despite of the disadvantages thermophilic anaerobic digestion is often preferred over mesophilic digestion because of higher gas production yield and higher methane content (Kardos 2011).
Toxic metals and materials also have a prominent effect on biogas production. Pesticides, antibiotics and ammonia (formed when there is low C:N ratio). The growth of methanogens is optimum and doubling time is minimum when ammonia is present at 5 mM, but increase in ammonia can effect growth negatively. Some metals when added in the right amounts can optimize the growth thus increasing the biogas yields. According to a paper by Nagamani and Ramaswamy 2010, "addition of calcium (5 mM), cobalt (50 µg g– 1 TS), iron (50 mM), magnesium (7.5 mM), molybdenum (10–20 mM), nickel (10 µg g– 1 TS) individually as well as in
7
combination enhanced the biogas production and attributed this to the increased methanogenic population in the digesters" (Ramasamy, 2010).
Lignin content of the plant biomass is another factor which determines the biogas yield. Lignin is found in association with cellulose thus the name lignocellulose. It is made of cellulose- 40%, lignin 20-30% and hemicellulose 30%. Lignocellulose is a macromolecule which is not soluble and is irregular which makes it hard to degrade/decompose. It is generally found in the plant cell walls. (ChongLing Feng, 2011) (Tuomela, 2000). While lignin is decomposed in aerobic condition it is quite resistant to anaerobic degradation. It is found that for 1% increase in lignin content the biodegradability drops by 3% (Nijaguna, 2002).
1.5 Types of digesters
There are 3 major types of anaerobic digesters, the type of digester employed can be determined according to the type of raw material used. They are
1. Covered lagoons-for liquid waste
2. Complete mix digester-for slurry waste
3. Plug flow digester-semi solid waste (ANAEROBIC DIGESTERS, 2012).
1.5.1 Covered lagoons
Covered lagoons are mostly used for liquid waste or diluted waste which contains less than 2% solid waste. They are huge lagoons into which the liquid manure or waste is pumped in (Fig. 3). Mostly seen underground, covered by air tight lining. hydrological retention time (HRT) is around 30-40 days. They are conducive for climates where the temperature is above 20oC all year round. The recovered methane is collected via pipes placed throughout the air tight lining and is pumped into combustion unit or storage unit.
8 Fig 3. Typical covered anaerobic lagoon design. (United states environmental protection agency, 2012)
Covered Anaerobic digesters are very good at reducing the pathogens, seed of weeds and odor. The effluent from the covered lagoons can be used as compost as it is high in nutrient content (Covered lagoons, plug low, 2013).
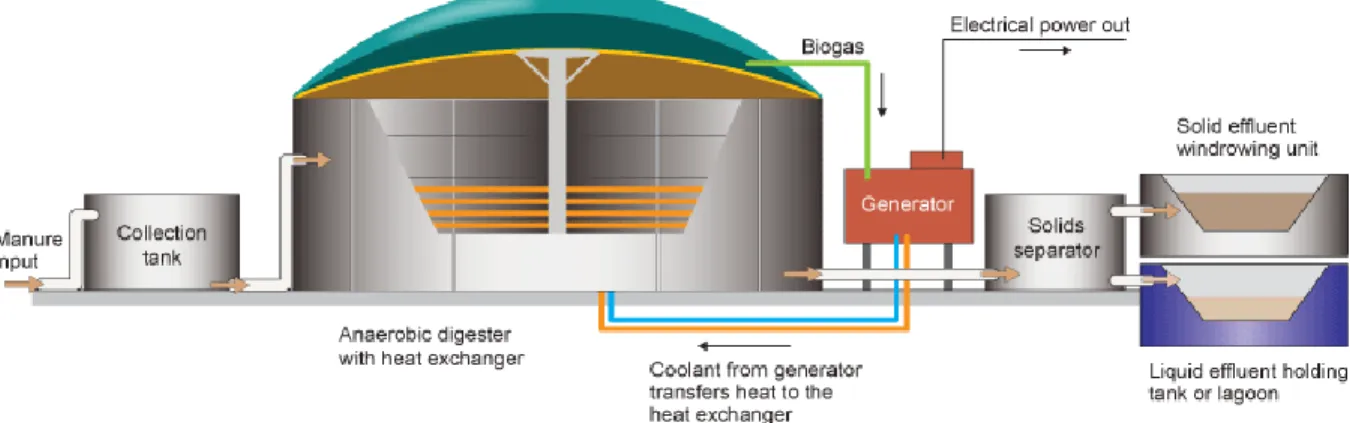
1.5.2 Complete mix digester:
These are huge tanks made of concrete and are insulated to minimize the exchange of heat and are maintained at mesophilic or thermophilic range (Fig. 4). External heating source is also present inside the digester, so is a mixing apparatus for proper mixing of a the substrate. It is best for the substrate which has 3-10% TS. HRT is low(10-20 days) when compared to covered anaerobic lagoons. The tank is covered by air tight lining and the biogas produced is collected via a pipe located at the top of the digester and is pumped into a generator where is used to heat water or produce electricity.
Fig 4. Typical Complete Mix Digester design- (Complete Mix Digesters,2009 )
This type of digester is conducive for the large scale diary waste treatment. The effluent from this kind of digester can also be used as compost (Complete Mix, 2013) (Singh, 2009).
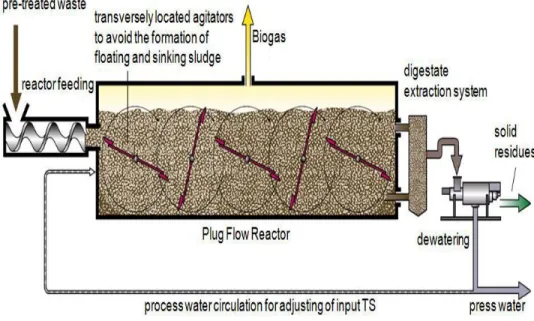
1.5.3 Plug flow digesters:
This kind of digesters are long and narrow constructed underground (to minimize the heat loss) with reinforced cement concrete (Fig. 5). It is built with air tight lining to help trap the biogas. The TS % in the substrate is high, up to 14%. Mostly used to digest manure. HRT is 15-20 days. Used both for mesophilic and
9
thermophilic digestion. Manure is put into the digester via the inlet, no agitation or mixing is done in this digester, the manure just moves longitudinally. The substrate moves forward when new substrate is added behind it until it finally flows out through the outlet. Biogas produced in the process is used to generate heat to keep the digester functionally, remaining biogas can be used to produce electricity or to make steam or heat. To avoid sinking or floating of particles because of their size the digesters can be fitted with "transversely located agitators". (Singh, 2009) (Covered lagoons, plug low, 2013)
Fig 5 Typical plug flow digester's design. (Waste Treatment by Dry Digestion)
1.5.4 Fixed film digesters
Recent advancement in digester technology have increased the biogas yields. One such technique is fixed film digester. Inert medium is added to the digester to give a large surface area for the bacteria to grow. A bio-film is formed in the inert plastic media, hence the name fixed film digesters. As the substrate moves through the media, the bacteria present on the inert media starts degrading the substrate. HRT of this kind of digesters is very low, around 3-4 days(which is way shorter than the other anaerobic digesters). Typical fixed film digesters is around 100,000
10
gallons. It is also said that fixed film digesters greatly reduce the odor which lessens the odor related problems (AgSTAR Digest, 2002) ( Singh, 2009).
1.5.5 Batch process dry fermentation
This is a single step process where all the steps of methane production occur in the same digester. Substrate is added at once to the digester together with the inoculum and it is left to digest till the end of HRT. This technique is employed when the TS of substrate is high (Bioenergy via Dry Fermentation, 2008)
1.6 Plant biomass for biogas
Animal wastes such as cattle manure, pig manure and poultry can give 65% , 67% and 60% of methane respectively. Plant material also seems to contribute to more methane percentage in total gas produced. Material such as grass, straw and elephant grass are found produce 70%, 59% and 60% of methane respectively. Total gas yields from plant material are also surprisingly high, as high as the gas yields cattle manure or pig manure. Pig manure can produce between 340-550 l/kg of VS whereas grass can produce 550 l/kg of VS and elephant grass can produce 430-560 l/kg VS. (ISAT/GTZ, 1999).
Though animal waste is often used as substrate for biogas production, availability of animal waste is limited and there is not much to sustain large populations. For example, even if all the animal waste in India is collected and used for biogas production it cannot even supply cooking gas to one third of the rural population (Jagadish, 1998). Hence the need to look for some other substrate for anaerobic digestion. One such biomass is plant biomass, it is found that if 10% of all the leafy biomass is collected (after fodder requirements are met) and used for biogas production it can supply cooking gas for 67% of rural population in India (Jagadish, 1998).
Though a variety of plant biomass can be used for biogas production, grasses are good option because of fast growth after harvest and high biogas yields (Tanka, 2013). Common reed is one such grass.
11
1.6.1 Wetland plants
The most prominent part of any wetland is its vegetation. Wetland's flora can be classified into 4 kinds
Submerged vegetation, ex: Seagrass
Free floating plants, ex: Duckweed, Water hyacinth, Broad-leafed pondweed
Trees (surrounding the wetlands), ex: Taxodium
Emergent vegetation ex: Reed canarygrass, Cattail, Common reed.
Common reed (Phragmites australis) is found in both temperate and tropical climates, it is a perennial monocot plant which dominates wetlands throughout the world. Often considered as an invasive species it can grow very well in both brackish and freshwaters within a pH range between 4.8 to 8.4 (Robinson, 2002). However, these species are very important for proper functioning of a wetland ecosystem. They provide shade, act as substrate for periphytic algae, they provide surface for the bacteria to attach, they keep the water temperature at constant level by reducing the direct exposure to sunlight, stop soil erosion and they also use the nutrients from the soil, but when they decay they let back all the nutrients fixed back into the water. For this reason the plant biomass can be harvested once in a while to prevent nutrient leaching via decomposition of dead plants.
Apart from that the biomass from this species can be used for energy production (incineration or biogas production). Litter and digestate(after anaerobic digestion) can be used as fertilizer or compost in both conventional and organic farming (Hansson, 2004). According to a recent report by Trelleborg municipality biomass from common reed harvested in May have the potential to produce 374 Ndm3 CH4/kg VS (Eriksson, 2009).
Though the potential for biogas production using common reed has been studied not much has been done to know which harvest times would be best suited for maximum production. According to Tanka's (2013) study "Chemical composition and methane yield of reed canary grass as influenced by harvesting time and harvest frequency" the harvest time played an important role in determining the biogas production. Biogas yields decreased quite much when the reed canary grass was mature.
12
Studies have shown that harvesting wetlands will increase the efficiency of the wetlands in removing nitrates and total phosphorous (Supiah Shamsudin, 2004). After the harvest, emergent species such as reed canary and common reed tend to grow really fast. Reed canarygrass being much faster-takes around 2 growing seasons to reach its full size, common reed takes around 3-4 growing seasons to reach its full size (Vymazala, 2005). Another study by Hosoi et al (1998) suggests that it takes 500 hours of sunlight for common reed to reach its average maximum height.
According to an oral report by Halmstad municipality (Ohlsson, 2012), there are about 250 hectares of constructed wetlands and 5-10 hectares of storm water ponds in Halmstad and Laholm municipality. It is said that around 10 tons (dry weight) of wetland biomass can be harvested from one hectare of wetland (Lin, 2012). Two thirds of the biomass would typically be common reed and one third would be free floating or submerged vegetation (Ohlsson; 2013). If harvested once in two or three years, all the biomass from the wetlands in Halmstad could produce huge amounts of energy in the form of biogas.
1.7 Pretreatment
To improve the biogas yield from lignocellulose biomass, pretreatment is necessary. A good pretreatment technique should not have effect on cellulose and hemicellulose, should not result in the formation of enzyme inhibitors, should result in the formation of cellulosic fibers which are easily digested and should be economically viable. Pretreatment methods are broadly classified into four types, Physical, chemical, physicochemical and biological.
1.7.1 Physical pretreatment: This increases the surface area of substrate where the enzymes can act on. It also decreases the crystallinity of the cellulose. Examples of physical pretreatment include milling and irradiation.
1.7.2 Phsyciochemical pretreatments: Treatment techniques which combine both physical and chemical methods are known as Physciochemical pretreatments. Examples includes steam explosion, steam explosion with SO2 Ammonia fiber
explosion, liquid hot water pretreatment, etc.
1.7.3 Chemical Pretreatments: As the name suggests these techniques use chemicals for pretreatment, chemicals such as NaOH, ammonia, ammonium sulphate (alkali pretreatment), H2SO4, HCl (acid pretreatment), H2O2, ozone
13
1.7.4 Biological pretreatment: Microbes such as White rot fungi are used to decompose lignin in this pretreatment techniques. These microbes only degrade lignin and hemicellulose but have no effect on cellulose (Taherzadeh, 2008).
1.8 Aim of the study
The primary goal of this paper is to look at feasibility of wetland biomass (mainly Common reed) in production of biogas by anaerobic digestion and to see which harvest time is best for maximum methane yield, to suggest any pretreatment methods if necessary.
2. Method description
2.1 Sampling
Three sets of fresh plant materials were collected from two wetlands located right next to each other, both receiving runoff water from Halmstad Airport. The first two samples were collected in August 2012, one with just common reed
(Phragmites australis) and one with floating/submerged vegetation, mainly broad-leafed pondweed (Potamogeton natans) and hornwort (Ceratophyllum demersum). The third sample was collected in October and it contained only common reed. Fresh digestate from Laholms biogas AB was used to provide the necessary anaerobic bacteria to carry out the digestion.
2.2 Experiment design
All plant material was cut into small pieces for easy digestion of the substrate. Small amounts from all 3 samples sets and digestate were put onto small aluminum cups and where dried at 105oC to measure the total solids (TS) content and later the same samples were transferred to another oven to heat the sample to 550oC to measure the volatile solids (VS).
After the TS and VS of the samples were determined, freshly cut samples were transferred to bottle according to their VS content (because VS is the part of the substrate which is converted to methane, VS present in each sample was calculated and was added to the bottles). Later inoculum was added to these bottles. 3 bottles of each sample set was kept for digestion. Bottles 1,2 and 3 were filled with Common reed from august, bottles 4,5 and 6 with Reed from October and bottles 7,8 and 9 were filled with free floating vegetation collected in august. Bottle 10 was filled with just the inoculum and was used as reference.
14
Figure 6. Wetland from which vegetation was harvested.
The amount of material and digestate used are shown in the table below (Tab. 1). The amount of substrate used in each bottle is determined by its TS and VS (as VS is the part of the substrate which is converted to methane). For optimum production, TS of the inoculum should be twice as much as the TS of the substrate but due to lack for space inside the bottles only 615 grams of inoculum was used. Table 1. Amount of substrate used.
Bottles Type Substrate in
grams Inoculum in grams Total 1-3 Reed august 48 615 664 4-6 Reed October 27 615 643 7-9 Free-floating August 108 615 723
15
This experiment was conducted on a laboratory scale with one liter bottles batch digesters with 700ml working volume. The temperature was maintained at 37oC all throughout the experiment. Bottles were sealed with gas-tight rubber stoppers with septum equipped outlets for collecting biogas samples. Each digester was, through a plastic hose, connected to a water filled U-tube. An IR-photo electrode was placed on each U-tube and biogas production was measured through the elevation of the water level inside the U-tube. Calibration of the U-tubes was done by injecting air through a plastic syringe to make the water level rise until the IR-photo electrode recorded an event. The volume of air added was noted and the procedure was repeated 6 times after which the mean value was calculated.
Produced volume of biogas was registered and measured daily in a computer based hardware and were compiled and analyzed after digestion had been terminated. Methane yield was calculated by subtracting the mean methane production from the reference digester. Biogas composition (CH4 and CO2) was measured three times a week by taking 20 µl gas samples using a Hamilton 50 µl syringe, after which they were run in a Varian 3800 GC using a TCD and CP-Porabond Q capillary column. Bottles were Shaken everytime methane content was measured.
After the experiment the samples were taken of the digestate and put in small aluminum cups, TS and VS of the digested residue and reference (inoculum) were measured.
2.3 Calculating methane production:
The amount of methane produced can be calculated by the following equation CH4 (ml/g) / VS=(V total gas production/M substrate*TS*VS)*Methane content
Vtotal gas production= Total gas liberated in the experiment
Methane content= Average % of methane present in gas produced. Msubstrate= Weight of the biomass added.
3. Results
TS and VS of the samples showed a lot of difference (Tab. 2) TS of common reed changed a lot in just three months, while the common reed from august had just 45% TS, reed from October had 77%. Free floating plants had the TS (19.5%) and VS (65%).
16
Table 2. TS and VS in percent and g VS/kg.
Substrate TS [%] VS [%] g VS/kg
Red Aug 45.0% 92% 414.0
Reed Oct 77.1% 95% 735.4
Free floating plants Aug 19.5% 95% 185.2
Inoculum Laholm 2.5% 65% 16.3
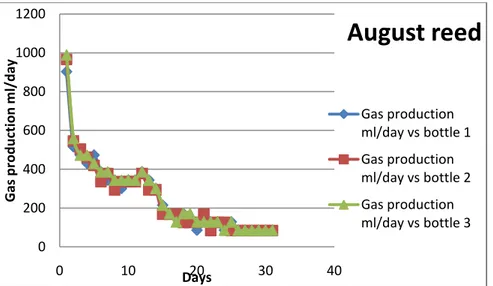
All the bottles showed gas production as early as day 1. For reed harvested in August the biogas production continued for 25 days. Surprisingly the peak production was on day 1 after that it decreased (Fig 7). Bottles 1,2 and 3 (reed August) had similar production all throughout the experiment. For reed harvested in October the bottles 4,5 and 6 showed difference in production (Fig. 8). While gas production in bottles 4 and 5 was similar the production in bottle 6 was very low (as low as the reference), so this bottle can be considered reaction failure. For free floating plants harvested in August the bottles 7,8 and 9 showed different biogas production. While bottles 8 and 9 started off on a high production and then the production rapidly fell to a very low level after day 20. Bottle 7 showed low production from the start similar to bottle 10 (reference) and did hardly show any production after day 9. Just like bottle 6, bottle 7 can also be considered as reaction failure. Bottle 10 (reference bottle, not shown) with just the digestate also showed some production but was very low.
Figure 7. Gas production curve with reed from august as substrate.
0 200 400 600 800 1000 1200 0 10 20 30 40 Gas p ro d u ction m l/ d ay Days
August reed
Gas production ml/day vs bottle 1 Gas production ml/day vs bottle 2 Gas production ml/day vs bottle 317
Figure 8. Showing gas production curve-bottles with reed from October as substrate.
Figure 9. Showing gas production curve with free floating vegetation from august as substrate.
Methane percentage in the gas produced from bottles 1,2 and 3 (reed harvested in August) did not show much difference (Fig 10). It started out at 55% but soon went up to 60% and remained the same all throughout the experiment. Bottle 1 took a longer time to reach 60% methane. Methane percentage in bottles 4,5 and 6 (reed harvested in October) showed almost similar trends (Fig. 11). It remained at an average of 59-60% from day 11 and throughout the experiment. Methane percentage of the gas produced in bottle 7,8 and 9 (free floating vegetation) took a bit longer time to reach maximum. The average production was about 61% from day 14. The bottles showing reaction failure did not have less methane percentage in the gas. 0 200 400 600 800 1000 1200 0 10 20 30 40 Gas p ro d u ction m l/ d ay Days
October reed
Gas production ml/day vs bottle 4 gas production vs bottle 5 Gas production vs bottle 6 -200 0 200 400 600 800 1000 1200 0 10 20 30 40 Gas p ro d u ction m l/ d ay DaysFree floating
plants August
Gas production vs bottle 7 Gas production vs bottle 8 gas production vs bottle 918
Figure 11. Methane % in gas produced in bottle 4,5 and 6
Figure 12. Methane content in gas produced from bottle 7,8 and 9.
Reference bottle 10 showed a methane percentage of ca 65% (not shown). Methane production calculated from grams of VS showed some difference between different substrate (Fig.13) While bottles with reed vegetation from August and October showed similar production per gram VS the free floating vegetation showed lower methane production. Since bottles 6 and 7 as mentioned earlier were considered reaction failure these are not included in the calculation.
0
20
40
60
80
Da
y
6
Da
y
11
Da
y
14
Da
y
18
Da
y
20
Da
y
22
Da
y
25
Da
y
27
Da
y
28
Da
y
31
Me
than
e
%
No. of days
Methane % vs day
Bottle 4
Bottle 5
Bottle 6
0
20
40
60
80
Day 6 Day
14
Day
20
Day
25
Day
28
Me
tha
ne
%
No. of days
Methane % vs day
Bottle 7
Bottle 8
Bottle 9
19
One of the October reed bottles showed a methane production of 172 ml/g VS which was the highest CH4 production/gram VS. One of the free floating vegetation
bottles showed a methane production of 129 ml/g VS which was the lowest CH4
production.
Figure 13. Methane production from different vegetation. Mean values and standard deviation of three parallel bottles
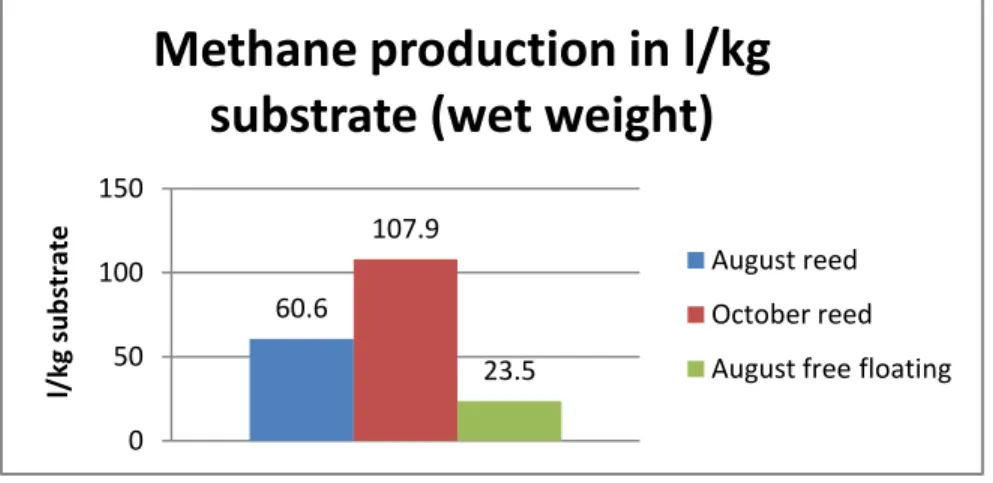
When the amount of methane produced per kg (wet weight) of substrate was calculated it showed a big difference between different substrates (Fig. 14). Reed harvested in October produced the highest amount of gas(107.9 l/kg wet weight), reed harvested in August produced 60.6 l/kg wet weight and free floating vegetation from August produced the least methane (23.5 l/kg wet weight).
Figure 14. Methane production/kg substrate from different vegetation. Mean values of parallel bottles
147.3 150.8 130.5 0 50 100 150 200
August reed October reed August free floating
ml /g V S
Methane production
60.6 107.9 23.5 0 50 100 150 l/ kg su b str ateMethane production in l/kg
substrate (wet weight)
August reed October reed August free floating
20
After the experiment TS was about 4% in the bottles with reed harvested in August and October while in the bottles with free floating vegetation TS was about 6% after digestion (Tab 3). There were still high amounts of VS (57-65%) left in the bottles after digestion.
Table 3. TS and VS after the experiment.
Bottle number Average TS% Average VS%
Bottle 1-3 3.59 63.06
Bottle 4-5 4.0 57.4
Bottle 7-9 5.87 65.13
4. Discussion
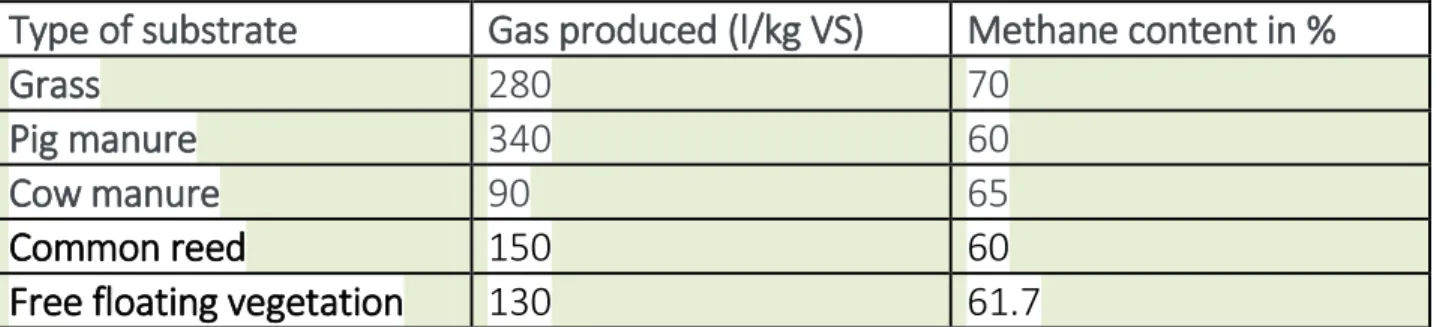
As the concept of common reed for biogas production is new, it is important to make a system analysis. Aspects such as harvest time, harvesting frequency, impact on the wetland's function, impact on the fauna, esthetic value and economic aspects should be taken into consideration. Wetland plants especially common reed can very well serve as substrate for biogas production. Methane content in the gas produced is also high. Co-digestion with manure is probably a good idea. Substrates such as grass can produce 280 l of gas/kg of VS with 70% methane content(ISAT/GTZ, 1999), cow manure- 90 l of gas/Kg of VS with 65% methane content(ISAT/GTZ, 1999) and Pig manure can produce 340 l of gas/kg VS with 60% methane content(ISAT/GTZ, 1999). Although common reed did not produce as much gas as the pig manure or grass, it is still worthwhile to use the former mentioned substrates as amount that can be harvested is big.
Type of substrate Gas produced (l/kg VS) Methane content in %
Grass 280 70
Pig manure 340 60
Cow manure 90 65
Commonreed 150 60
Freefloatingvegetation 130 61.7
Table 4. Gas produced from different substrates and methane percentage.
Even though the free floating vegetation did not produce as much methane as Common reed (both according to VS and wet weight) but still the amount of gas produced is good. According to the Halmstad municipality official Lars Ohlsson, the free floating vegetation will account for one third of the total biomass if the
21
wetlands are harvested. Thus making free floating vegetation an important part harvested material.
Harvest time of common reed also showed little impact (when calculated according to VS) on the gas production of reed. This was a bit surprising since later harvesting may lead to increased lignin content (Larter, 2001) which has a negative effect on gas production. Also the C/N ratio probably increased from August to October since the plants remobilize nitrogen to the roots in the autumn (Marschner, 1993). When compared to the study conducted by Lin (2012) in which the biomass was harvested in March from two different wetlands showed methane productions of 106 and 143 ml CH4/g VS, the production from October
and August harvested reed in this study was a bit higher.
Growth of common reed occurs in spring and summer, in fall and winter plant remains dormant. Biomass is highest between July-September. Rhizome growth occurs mostly in summer (June and July) and the roots growth occurs mostly in spring and autumn. Accumulation of reserve material in rhizome occurs in July and August. If harvested before the reserve minerals and carbohydrates are translocated to rhizomes, growth next year can be effected (Wilhelm et al, 1992). According to a study conducted by Kevyn (2013) rhizomes of fall/autumn had a survival rate of 77% and rhizomes of summer only had 15.6% chances of survival. This implies that harvest of above ground parts of common reed should be done in fall (after the translocation of nutrients from the shoots to rhizomes) for better propagation next year. But due to the translocation of carbohydrates to the rhizome, small part of the biomass is lost.
A study conducted by Hosoi et al (1998) suggests that it takes 500 hours of sunlight for common reed to reach its average maximum height, suggesting that reed can be harvested every year. Studies have also shown that young reed shoots tend to remove more nutrients from the waters than mature ones (Supiah, 2004) so in the spring when the reed grows back again there might even be better removal of nutrients compared to an unharvested wetland.
Harvesting the reed in August may not be good for the wetland's nutrient removal capability in an agricultural wetland but an October harvest will not have so much effect on the nutrient removal capability.
Common reed harvested in October and August did not show much difference in gas production (according to VS). The production was low compared to other substrates which might indicate that a pretreatment could improve biogas
22
production (Eriksson, 2009). But when the amount of substrate used (wet weight) is taken into account there's huge difference in biogas production ability of the three substrate. Reed collected in October had the least weight but produced the highest amount of gas. The production per kg wet weight from October harvested reed was nearly twice as much as August harvested reed and four times the August harvested free floating species. TS of the October harvested reed is higher than the other two. This difference is because of the reduced water content in the October harvested reed. Implying that October harvest is more beneficial since it reduces the amount of biomass to be harvested and transported and thus more biomass can produce biogas to the same cost.
Substrates which have high TS values and which are dry are often difficult to use in wet fermenters. They are hard to pump and often cause blockage of the fermenter/digester. Dry fermenter/digesters Plug flow reactors could therefore be considered for this kind of substrates.
After the experiment the measured TS and VS values showed that there was still much organic material in the substrate for digestion indicating further potential for gas production. Before the start of the experiment total VS in the bottles was around 20 grams plus inoculum ca 10 grams of VS. After digestion the total VS had only decreased slightly and there was also a big difference (high standard deviation) between bottles with the same treatment. This illustrates that it can be very difficult to take representative samples for the VS measurements.
System analysis suggests that although October reed and August reed produced similar amount of gas, there's a lot of different in the wet weight of the two. Wet weight of October reed is very much less than August reed. This make it easier and cost effective to harvest in October. Harvest in October is also good for growth consecutive year as rhizomes by September starts to accumulate required nutrients to survive the winter. October harvest is also good for the wetland nutrient removal ability, for migratory birds which use wetlands as resting places during migration season (Feuerbach,2010) and for esthetic value.
5. Conclusion
Common reed from wetlands showed very good potential for biogas production, similar to other studies. October harvest is more advantageous for its increased biogas yield, less weight to transport, reduced impact on the wetland functions/fauna. Pretreatment methods can improve the gas production and
23
reduce the retention time. Cost benefit assessment of pretreatment methods should be done. Further research is needed regarding the factors responsible for biogas reaction failure.
6. References
1. Abbasi. T, Abbasi. S.A, 2010, Production of clean energy by anaerobic digestion of
phytomass—new prospects for a global warming amelioration technology Renewable and Sustainable Energy Reviews, 14, pp. 1653–1659.
2. AgSTAR Digest, United States Office of Air and Radiation, Environmental Protection Agency Washington, DC 20460. http://www.epa.gov/agstar/news-events/digest/2003digest.pdf 3. Anna Schnürer andÅsa Jarvis, 2010, Microbiological Handbook for Biogas Plants,
Swedish Waste Management U2009:03 Swedish Gas Centre Report 207.
http://www.bcfarmbiogas.ca/files/pdf/Microbiological%20handbook%20for%20biogas.pdf
4. Anaerobic digesters, 2013-United States-Environmental protection agency. http://www.epa.gov/agstar/anaerobic/ad101/anaerobic-digesters.html 5. Bioenergy via Dry Fermentation, 2008, BEKON Energy Technologies.
http://archive.cityofpaloalto.org/civica/filebank/blobdload.asp?BlobID=19875
6. Chengyuan Zhao, 2011, Effect of Temperature on Biogas Production in Anaerobic Treatment of Domestic Wastewater UASB System in Hammarby Sjöstadsverk.
http://sjostad.ivl.se/download/18.488d9cec137bbdebf94800055137/1340123261703/LW R_EX_11_35.pdf
7. ChongLing Feng, GuangMing Zenga , DanLian Huanga, Shuang Hua, MeiHua Zhaoa, Cui Laia, Chao Huanga, Zhen Weia, NingJie Lia, July 2011, Effect of ligninolytic enzymes on lignin degradation and carbon utilization during lignocellulosic waste composting. Process Biochemistry Volume 46, Issue 7, Pages 1515–1520.
8. Center for climate and energy solutions- Anaerobic digesters- http://www.c2es.org/technology/factsheet/anaerobic-digesters
9. Covered anaerobic digester-Penn state college of agricultural college-2013.
http://extension.psu.edu/natural-resources/energy/waste-to-energy/biogas/types-of-anaerobic-digesters/covered-lagoon
10. Complete Mix, 2013, Penn state college of agricultural college
http://extension.psu.edu/natural-resources/energy/waste-to-energy/biogas/types-of-anaerobic-digesters/complete-mix
11. Cronk J.K., M.S. Fennessy, 2009, Encyclopedia of Inland Waters., Pages 590–598 12. David FogartyPotent methane is an overlooked greenhouse gas, 2007.
24 13. Emma Risén, Erik Gregeby, Olena Tatarchenko, Eva Blidberg, Maria E. Malmström, Ulrika
Welander, Fredrik Gröndahl, March 2013, Assessment of biomethane production from maritime common reed, Journal of Cleaner Production.
14. Endreny T.A, 2004. Storm water management for society and nature via service learning, ecological engineering and ecohydrologyWater Resour. Dev., 20, pp. 445–462
15. Ferry. J G, 1992, Methane from acetate, Journal of Bacteriology, 174(17):5489. http://jb.asm.org/content/174/17/5489.full.
16. Fritz Barthel , Maritess Cabrera, Andre Faaij, 2000, World Energy Assessment - Energy and the Challenge of Sustainability, (UNDESA - UNDP - WEA - WEC, , 517 p.)
http://www.nzdl.org/gsdlmod?e=d-00000-00---off-0cdl--00-0----0-10-0---0---0direct-10---4-
---0-1l--11-en-50---20-about---00-0-1-00-0-0-11-1-0utfZz-8-00&cl=CL1.207&d=HASHd61695cbdbc1bc78f8e16e.9>=2
17. håkan eriksson, 2009, rojektrapport nr 13, baltic sea revival, Trelleborg.
http://www.kretsloppetitrelleborg.se/Images/Projektrapport%2013%20Kretsloppet%20-%20T%C3%A5ng%20och%20alger%20som%20en%20naturresurs%20och%20f%C3%B6rnye lsebar%20energik%C3%A4lla,%20Detox-Eon,%20svensk%20version.pdf
18. HELCOM, 2009. Eutrophication in the Baltic Sea – an integrated thematic assessment of the effects of nutrient enrichment and eutrophication in the Baltic Sea region. In: Baltic Sea Environ. Proc. No. 115B.
19. Hosoi, Y. Kido, M. Miki, M. Sumida, 1998, Field examination on reed growth, harvest and regeneration for nutrient removal, Water Science and Technology Volume 38, Issue 1, 1998, Pages 351–359.
20. ISAT/GTZ, 1999a ISAT/GTZ Biogas Digest Volume I Biogas Basics, Information and Advisory Service on Appropriate Technology (ISAT), Deutsche
GesellschaftfürTechnischeZusammenarbeit (GTZ)
21. Jan Herrmann, 2012, Chemical and biological benefits in a stormwater wetland in Kalmar, SE Sweden, School of Natural Sciences, Linnaeus University, SE-391 82 Kalmar, Sweden. 22. Jagadish. K.S, Chanakya H.N, Rajabapaiah. P, Anand. V, May–June 1998, Plug flow digestors
for biogas generation from leaf biomass, Biomass and Bioenergy, Volume 14, Issues 5–6, , Pages 415–423.
23. Vymazala Jan, Lenka Krőpfelováb, December 2005, Growth of Phragmites australis and Phalaris arundinacea in constructed wetlands for wastewater treatment in the Czech Republic, Ecological Engineering, Volume 25, Issue 5, Pages 606–621.
24. KARDOS. L, JUHÁSZ. Á ,PALKÓ. Gy , OLÁH. J , BARKÁCS. K. ZÁRAY. GY, 2011 COMPARING OF MESOPHILIC AND THERMOPHILIC ANAEROBIC FERMENTED SEWAGE SLUDGE BASED ON CHEMICAL AND BIOCHEMICAL TESTS,. http://www.ecology.kee.hu/pdf/0903_293302.pdf
25
25. Kevyn J. Juneau and Catherine S. Tarasoff, 2013, The Seasonality of Survival and
Subsequent Growth of Common Reed (Phragmites australis) Rhizome Fragments, Invasive Plant Science and Management / January-March / pg(s) 79-86
26. Klass D.L., 1998, Biomass for renewable energy, fuel and chemicals, Academic Press An imprint of Elsevier, USA.
27. Kristina Göranssona, Ulf Söderlinda, JieHea, Wennan Zhang, January 2011, Review of syngas production via biomass DFBGs, Renewable and Sustainable Energy Reviews Volume 15, Issue 1, Pages 482–492.
28. Kurnani Tubagus Benito Achmad, Yuli Astuti Hidayati, Dimas Fitriani, Oki Imanudin, THE EFFECT OF C/N RATIOS OF A MIXTURE OF BEEF CATTLE FECES AND WATER HYACINTH (Eichornia crassipes) ON THE QUALITY OF BIOGAS AND SLUDGE, http://www.univagro-iasi.ro/revista_zoo/ro/documente/Pdf_Vol_55/Kurnani_Tubagus.pdf
29. Larter. Nicholas C. & Nagy. John A , 2001, Seasonal and annual variability in the quality of important forage plants on Banks Island, Canadian High Arctic.
http://www.enr.gov.nt.ca/_live/documents/content/Journal_Publications48.pdf
30. Li. J, Dong. J, Shangguan, Hook .M, 2010, Forecasting the growth of China's natural gas consumption Energy, vol 36, pp. 1380–1385.
31. Ludwig Sasse, 1988, Biogas Plants Deutsche GesellschaftfürTechnischeZusammenarbeit (GTZ) GmbH, Eschborn, Germany.
32. Michael R. Templeton, December 2011, History and future of domestic biogas plants in the developing world, Energy for Sustainable DevelopmentVolume 15, Issue 4, , Pages 347–354 33. Michelle Robinson,2002, Common Reed: An Invasive Wetland Plant, Commonwealth of
Massachusetts Department of Conservation and Recreation, Office of Water Resources, Lakes and Ponds Program.
http://www.mass.gov/dcr/watersupply/lakepond/factsheet/Phragmites.pdf 34. Nagamani .B, Ramaswamy K, Biogas production technology: An Indian perspective
,Fermentation Laboratory, Department of Environmental Sciences, Tamil Nadu Agricultural University, Coimbatore 641 003, India.
http://www.iisc.ernet.in/currsci/jul10/articles13.htm 35. Nijaguna.B.T, Biogas Technology,
36. http://books.google.se/books?id=QfLDbf3qbcEC&pg=PA23&lpg=PA23&dq=lignin+and+bio
gas&source=bl&ots=rX0Z8nPu5-&sig=cI1BNs60GAZr4ycJn4XiToP9iZ4&hl=en&sa=X&ei=VFphUY0gtJ3iBNTdgdgF&ved=0CDM Q6AEwAA#v=onepage&q=lignin%20and%20biogas&f=false
37. Per-Anders Hansson, , Hans Fredriksson, May 2004, Use of summer harvested common reed (Phragmites australis) as nutrient source for organic crop production in Sweden. Agriculture, Ecosystems & Environment Volume 102, Issue 3, Pages 365–375
26 39. Renewable biological systems for alternative sustainable energy production. Methane
production, 1997. http://www.fao.org/docrep/W7241E/W7241E00.htm
40. Shaojie Lin, 2012, Wetland biomass - Chemical benefits and problems with biogas usage. 41. Simple technologies for charcoal making, 1987, Food and Agriculture Organization of the
UN. http://www.fao.org/docrep/X5328E/X5328E00.htm
42. Singh. S.P, Pandey Prerna, August–September 2009 Review of recent advances in
anaerobic packed-bed biogas reactors, Renewable and Sustainable Energy Reviews Volume 13, Issues 6–7, Pages 1569–1575.
43. Stassen.H, Knoef. H , 1993, Small-scale gasification system,Biomass Technology Group, University of Twente, Enschede,
(http://www.iafbc.ca/funding_available/programs/livestock/documents/LWTI-1_FR_App3.pdf ..
44. Supiah Shamsudin, Mohd Azraai Kassim, Johan Sohaili, 2004, REDUCTION OF NUTRIENT CONTENTS BY HARVESTING NATURAL WETLAND VEGETATIONS.
http://www.academia.edu/2674034/Reduction_of_Nutrient_Contents_by_Harvesting_Nat ural_Wetland_Vegetations.
45. Tore Söderqvist, August 2002 Constructed wetlands as nitrogen sinks in southern Sweden: An empirical analysis of cost determinants, Ecological Engineering,Volume 19, Issue 2, Pages 161–173.
46. Tuomela. M, Vikman. M , Hatakka. A , Itavaara. M, 2000, Biodegradation of lignin in a compost environment: a review, Bioresource Technology 72, 169-183.
47. Taherzadeh Mohammad J. and Keikhosro Karimi, 2008, Pretreatment of Lignocellulosic Wastes to Improve Ethanol and Biogas Production: A Review, International Journal of Molecular Sciences, 1621–1651.
48. University of Adelaide Brief History of Biogas Retrieved 19th December 2010,from http://www.adelaide.edu.au/biogas/history/
49. Waste water treatment by dry digestion. http://enermac.com/Strabab-SEHL.htm 50. Wilhelm Granrli, Stefan E.B. Weisner and Mark D. Sytsma, 1992, Rhizome dynamics and
resource storage in Phragmites australis, Wetlands Ecology and Management vol. 1 no. 4 pp. 239-24.
51. Xu R., L. Ferrante, C. Briens, F. Berruti, 2009, Flash pyrolysis of grape residues into biofuel in a bubbling fluid bed,J Anal ApplPyrol, 86, pp. 58–65.
52. YunhuaZhua, Susanne B. Jonesa, Mary J. Biddyb, Robert A. Daglea, Daniel R. Paloa, 2012, Single-step syngas-to-distillates (S2D) process based on biomass-derived syngas – A techno-economic analysis, Bioresource Technology, Pages 341–351.
27
Presentation of the author
Viswa Raj Akula,
visaku10@mail.student.hh.se, vish_oucs@yahoo.com,+46767069333. Master student in Applied environmental science, Halmstad university.
Master of Science, Environmental science, Osmania university, Hyderabad, India. Area of interest: Biogas, Water treatment, Wetland technology.