Development of design guidelines for underground platinum mine regional support pillars
47
0
0
Full text
(2)
(3) PREFACE This thesis is part of the requirement to fulfill a Master’s of Science (M.Sc.) degree in the field of Rock Mechanics at Luleå University of Technology (LTU). The project work presented here was conducted in the Republic of South Africa at Anglo Platinum Rustenburg Platinum Mines (RPM) Frank2 Shaft from the beginning of November 2006 to the end of February 2007. I would like to express my gratitude to Mike Rogers for giving me the opportunity to do this study. Special thanks to Roger Johnson, Graham Priest, and Karl Akermann for their support and help with my work. I really appreciated the great help, friendship, patience and excellent guidance from Alan Olivier and Geoffrey Potgieter, thank you very much. I would also like to thank the staff of the RPM rock engineering division, and the Frank2 shaft people for their kindness and hospitality. Dr. John Ryder from Groundwork Consulting is acknowledged for reviewing the study and giving guidelines. Prof. Matthew Handley from the University of Pretoria and Hakan Urcan from TWP Consulting are also acknowledged for their comments and help with the literature. Finally, I would also like to give thanks to my supervisor Tech. Lic. Kristina Larsson for reviewing and checking the language, and Prof Erling Nordlund and Dr. Jonny Sjöberg for their comments on the data analysis.. Luleå, May 2007. Sait Fatih Alagöz. i.
(4) ii.
(5) ABSTRACT “Assessment of pillar stability is one of the most crucial steps in mine design.” (Sjöberg, 1992). South African platinum mines has reached a point where layouts made for shallow operations are insufficient due to increased depth, creating a necessity for new design layouts for medium depth mines (>1000 m). In this thesis, a design criterion for medium depth platinum mines’ regional support pillars is presented. Frank2 Shaft was chosen because it is the deepest and most seismically active mine in the region. The design methodology is refining the actual mine plan with the designed regional support pillars. Average pillar stress was designed to be 1000 MPa during shallow operations. Increased levels of seismicity and signs of failure in regional support pillars showed the necessity for reducing the stress levels on these pillars. It was assumed to reduce the 1000 MPa value by half, i.e. 500 MPa, as an empirical approach based on experience. Future regional support pillars will therefore be designed according to this criterion; however it was not supported by the theory. This thesis project aims to support this design with theory, or refine it if the theory proposes a different design criterion. The primary source of information for the refining process was literature review and observations of failed pillars. It was unfortunate that none of the newly designed regional pillars were cut by the time this study was conducted. However, old design regional pillars were observed for back analysis. Crush pillars as well as potholes were also visited. As a starting point, the current design of 108 regional support pillars at Frank2 shaft was taken into consideration. Average pillar stress (APS) levels calculated for different dimensions of pillars using Tributary Area Method and Coates Method. Numerical modeling was done using Besol/MS, a linear elastic modeling program. However, only 30 of these pillars were modeled due to the limitations of the program. These results were used for comparison with foundation strength, which appeared to be a more limiting parameter than pillar strength itself. As a result of comparisons of. iii.
(6) these results combined with back analysis of old type regional support pillars with estimated APS levels; a design criterion has been developed. The design criterion is: Design APS ≤ 2.0 x UCS of the weakest foundation strata As stated, new design regional support pillars have not yet been cut, this result and hence the criterion has not been verified completely. Nevertheless, literature review and observations along with numerical modeling justified the design criterion as an applicable one for the time being. Keywords: Regional support pillars, average pillar stress (APS), foundation strength, design criterion. iv.
(7) LIST OF SYMBOLS AND ABBREVIATIONS σv. = vertical Stress, MPa. σh. = horizontal Stress, MPa. c. = cohesion, MPa. k. = design rock mass strength, MPa. ρ. = rock density, kg/m3. g. = gravity acceleration, m/s2. γ. = unit (specific) weight, MN/m3. z. = depth below ground surface, m. k. = σh / σv. ν. = Poisson’s ratio for abutments. νp. = Poisson’s ratio for pillars. E. = Young’s Modulus for abutments. Ep. = Young’s Modulus for pillars. Bo. = room width, m. Bp. = pillar width, m. Bh. = half the pillar width, m. L. = width of excavation span, m. Le. = excavation length, m. Lp. = pillar length, m. A. = pillar area, m2. C. = pillar perimeter, m. V. = pillar volume, m3. H. = height of stope, m. u. = over-stoping, m. Φ. = internal friction angle. R. = extraction ratio. w. =. wp. =. weff. = effective width, m. υ 1−υ. for the abutments. υp 1 − υp. for the pillars. v.
(8) w eff = 4. n. =. b. =. A C. (. E 1−υ p. E p (1 − υ. 2 2. ). ). Bp. Ω. L H = L = design rock mass strength, MPa. Ps. = pillar strength, MPa. qu. = foundation strength, MPa. h. DRMS = Design Rock Mass Strength, MPa APS. = Average Pillar Stress, MPa. UCS. = Uniaxial Compressive Strength, MPa. 100 oz = 3.11 kg. vi.
(9) TABLE OF CONTENTS PREFACE .............................................................................................................................. I ABSTRACT......................................................................................................................... III LIST OF SYMBOLS AND ABBREVIATIONS .................................................................. V TABLE OF CONTENTS .................................................................................................... VII 1. 2. 3. 4. 5. INTRODUCTION........................................................................................................ 1 1.1.. Background.......................................................................................................... 1. 1.2.. Aim and Objective................................................................................................ 1. 1.3.. Limitations ........................................................................................................... 2. LITERATURE REVIEW ............................................................................................. 3 2.1.. Pillar Design Theory ........................................................................................... 3. 2.2.. Determination of Pillar Load .............................................................................. 4. 2.2.1.. Tributary Area Method ........................................................................................ 4. 2.2.2.. Coates Method ..................................................................................................... 4. 2.2.3.. Numerical Modeling – Besol/MS......................................................................... 5. 2.3.. Determination of Pillar Strength ......................................................................... 5. 2.4.. Determination of Foundation Strength................................................................ 6. 2.4.1.. Terzaghi’s Formula ............................................................................................. 7. 2.4.2.. Hansen’s Formulae ............................................................................................. 8. FRANK2 SHAFT ......................................................................................................... 9 3.1.. Geology................................................................................................................ 9. 3.2.. Current Practice ................................................................................................ 11. DESIGN OF REGIONAL SUPPORT PILLARS ....................................................... 13 4.1.. Rock Mass Properties Determination................................................................ 13. 4.1.1.. Lab Testing ........................................................................................................ 13. 4.1.2.. Point Load Testing............................................................................................. 13. 4.2.. Design Guidelines.............................................................................................. 14. 4.2.1.. Pillar Load Calculation..................................................................................... 15. 4.2.2.. Foundation Strength Calculation ...................................................................... 16. 4.2.3.. Back Analysis of Pillars..................................................................................... 16. ANALYSIS AND RESULTS..................................................................................... 19 5.1.. Regional Support Pillar Design......................................................................... 20. 6. CONCLUSIONS AND RECOMMENDATIONS ..................................................... 27. 7. REFERENCES........................................................................................................... 29. 8. APPENDICES............................................................................................................ 31. vii.
(10) 1 INTRODUCTION 1.1.. Background. This study was carried out because stability problems and seismic events occurred in deep level underground platinum mines of Anglo Platinum. It was believed that the seismic events were mainly a result of poor design of regional support pillars. The study was conducted at Frank2 shaft of Rustenburg Platinum Mines, one of the deepest and most seismically active shafts of the company. The design used for shallow operations evidently did not satisfy the deeper operations. The old design regional support pillars were designed as big square squat pillars with average pillar stress levels equal to 1000 MPa. These design pillars started to create stability problems as the mining reached medium depths (~1000 m). Problems with pillar strength and seismic events showed the necessity for a new regional pillar design. The new design was based on reducing the APS levels by half of the previous design and changing the geometry of the pillars. As a result, rectangular regional pillars with APS levels of 500 MPa were introduced as a design criterion. However, this design was preliminary and based on experience without technical analysis. Hence, technical analysis for refining the new design became a necessity. In order to fulfill this, a literature review of similar cases as well as general pillar design guidelines was done. Rock properties for the mining site were determined for determining pillar stress and foundation strength. Back analysis on pillars was done at the shaft, with ten pillars cut according to the old design. The current design was evaluated using this information, and a new pillar design criteria was proposed.. 1.2.. Aim and Objective. The objective of this study was to analyze the current design using available literature, as well as conducting back analysis to check the validity of the information. This process involves ¾ conducting tests for determining rock properties, ¾ estimating the pillar stress, ¾ determining the strength of the pillar and its foundation, and. 1.
(11) ¾ conducting back area analysis of pillars.. The aim of the thesis is to refine the design and develop a criterion for regional support pillar design.. 1.3.. Limitations. The first limitation is that the thesis is conducted as a part of M.Sc. program which sets limitations on time and depth of study. It is planned as an equivalent of twenty weeks of study, which includes literature review, data collection, analysis of the collected data, and writing the thesis. Rock properties have to be determined for different haulage levels with multiple sampling points in order to understand the nature of the design material. However, these data were only available in the form of average values for the whole shaft. Determination of these properties is a necessity for better analysis, but time limitation did not allow this to be done. The final limitation is about the back analysis of pillars. As the design is a newly proposed one, there are no pillars cut according to the new criterion available yet Moreover, back areas at underground platinum mines are not easily accessible. Lack of ventilation, safety issues, high temperatures, and the mining method used makes back analysis of pillars difficult.. 2.
(12) 2 LITERATURE REVIEW 2.1.. Pillar Design Theory. As Coates (1981) defines it, rock pillars are in situ rock between two or more underground openings (quoted in Sjöberg, 1992). “In mining, it is more practical to define a pillar as a portion of rock left only to carry load or reduce deformations, in order to maintain stability in the mine” (Sjöberg, 1992). Pillars can be cut in less ore bearing zones of an underground stope; however, the fundamental dilemma of leaving ore behind and maintaining the stability exists in every mining operation involving them. Pillars cut during operations vary in size due to different functions. Salamon’s functional classification of pillars is as follows: (i) support pillars, (ii) protective pillars, and (iii) control pillars. Support pillars include all cases where the main support to the undermined hangingwall is provided by a system of pillars, usually laid out systematically, as is the case with regional pillars. The purpose of protective pillars is to protect either surface structures or underground mining excavations or to separate one mine from its neighbor. Shaft pillars, boundary pillars, and crown pillars can be classified as protective pillars. Control pillars are laid out systematically and are cut in deep level mines in order to decrease energy release rates to avoid rockbursts (Salamon, 1983). Pillar designs are made by using empirical formulas for load determination on the pillar, strength determination of the pillar and determination of the foundation’s bearing capacity. Load on a pillar can be calculated by the “tributary area method”, as exemplified by Brady and Brown (1985) (quoted in Sjöberg, 1992); or by “Coates method”, which is used for big rectangular pillars such as rib or regional pillars; or by numerical modeling using different programs. Pillar and foundation strength can be determined by empirical formulas derived from different mining operations. Although these formulas are in use, they are mainly derived for coal mines. Research on hard rock pillars is conducted less frequently due to these pillars being competent at the current mining depths or geometries being so irregular that establishing load on the pillars is difficult. As the mining depth increases, mining operations begin to face rock pillar failure problems (Martin and Maybee, 2000).. 3.
(13) The main input for pillar strength calculations is width of the pillar to height of the room ratio (W/H). Comparison of extensive data collected from back analysis shows that W/H<1.5 is where most of the pillar failures occur while W/H>2 suggests a significant increase in pillar strength due to confinement (Martin and Maybee, 2000). For higher ratios such as W/H>10, pillars are considered to be indestructible. Moreover, provided that the pillar and foundation material are the same, foundation failures rather than pillar failure may be expected when W/H>7 (Stacey and Page, 1986).. 2.2.. Determination of Pillar Load. 2.2.1. Tributary Area Method. As its name implies, the tributary area theory assumes that a pillar carries the full load of overburden above the pillar itself and half of the surrounding roadway (Roberts et al., 2002). Average pillar stress according to the tributary area method is calculated as: APS =. R =. σv 1− R. (L e x (B o + B P )) − (L p × B P ) (L e x (B o + B P )). (1). as given in Figure 1. σv = ρ × g × z. (2). (3). According to van der Merwe (1998), the tributary area method is valid when the panel width is more than or equal to the depth provided that the pillars are of the same size (quoted in Roberts et al., 2002). There are other limitations such as stiffness of overburden and percent extraction ratio. Roberts et al. (2002) suggests that the tributary area theory becomes less accurate as W/H ratio becomes less than 1.25 while extraction ratio exceeds 65%. The error is 10% for 75% extraction and it increases rapidly for higher extraction ratios. Nonetheless, for practical design purposes, this method can be used as long as the designer accepts the limitations for calculating average pillar stress levels (Roberts et al., 2002). 2.2.2. Coates Method. Coates (1981) argues that the tributary area theory is usable but is unsatisfactory as it does not take geometrical properties and rock properties into account. Pillar stress. 4.
(14) calculation with the formula proposed by Coates on the other hand takes these properties into account (Coates, 1981), such as; ¾ the span of the mining zone with respect to its depth, ¾ height of the pillars, ¾ pillar locations within the mining zone, ¾ horizontal stress, and ¾ modulus of deformation of the pillar and wall rock materials.. According to Coates, the average pillar stress in deep and long mining zones is calculated according to the following formula: ⎡ ⎤ 2 R (1 + h ) − kh (1 − w + w p n ) ⎥ ⎢ APS = σ v × ⎢1 + ⎥ ⎢ hn + 2(1 − R )(1 + h ) + 2 Rb(1 − w ) ⎥ π ⎣ ⎦ R=. Bo Bo + B p. (4). (5). Coates method, however, is only valid in the center of the mining area with undisturbed long rib pillars, and where the mine span does not exceed half of the depth. 2.2.3.. Numerical Modeling – Besol/MS. Besol/MS stands for Boundary Element Solutions Multiple Seam, and is capable of computing stresses, strains and displacements around three dimensional excavations in tabular orebodies. The Besol/MS system uses the displacement discontinuity modeling method (a special form of boundary element method) to replace actual excavation geometries by thin slits of irregular shape modeling the rock mass as a homogenous, isotropic, linearly elastic body (Besol/MS Manual, 1997).. 2.3.. Determination of Pillar Strength. Stacey and Page (1986) argues that the pillar strength will depend on three factors; the rock mass strength of the pillar material, the shape and size of the pillar defined by its width and height, and gross structural features such as clay bands, faults, and joints.. 5.
(15) There are various empirical strength formulas derived from site observations. All of these formulas use the width to height ratio (W/H) with different constants either in linear or power form. However, Martin and Maybee (2000) suggests that these empirical pillar strength formulas should be limited to width to height ratios less than two (W/H<2). This means they are not applicable for determination of the strength of regional pillars as the W/H>>2. Therefore, these formulas are not taken into consideration in this study. As it is stated by Stacey and Page (1986), the strength of pillars with W/H>5 increases rapidly due to confinement in the core of the pillar. These pillars are defined as squat pillars, and strength is calculated according to the squat pillar formula. However, the squat pillar formula is not a strength formula but is rather a description of a “kink” in the load-deformation curve according to Madden (Ryder, 2007). Squat pillars are virtually indestructible; hence pillar strength is not taken as a design criterion. Nonetheless, the following section shows the formula and strength calculation. The pillar strength is calculated as:. ⎫⎪ ⎡⎛ R ⎞ 4.5 ⎤ 2.5 ⎧⎪ Ps = Ω 0.07 × ⎨0.13 × ⎢⎜ ⎟ − 1⎥ + 1⎬ V ⎪⎩ ⎥⎦ ⎪⎭ ⎣⎢⎝ 4.5 ⎠ 2. (6). V = Weff × H. (7). Weff H. (8). R =. Weff = 4. A C. (9). Ω is the Design Rock Mass Strength in MPa and it is assumed to be 35% of the UCS of the pillar material based on practice at Frank2 shaft. Effective width, Weff, is defined according to Salomon’s definition of pillar width for squat pillars where A the is pillar area and C is the perimeter of the pillar.. 2.4.. Determination of Foundation Strength. As Jager and Ryder (1999) suggests, regional pillars are generally squat pillars defined as W/H>>10, and will not fail by crushing in their own right; rather they fail by punching, i.e. foundation failure. Their proposed criterion is:. 6.
(16) Design APS ≤ fa x UCS of the weakest foundation strata. (10). The UCS value can be of the footwall or hangingwall material, whichever is weaker. The coefficient fa, is an empirical factor which is typically taken as 2.5 (COMRO, 1988). However, this criterion does not take friction, dilation properties and presence of weak layers into account (Jager and Ryder, 1999). Besides, operational experience shows that 2.5 is a rather optimistic value and as it was found by Hedley et al. (1997), significant back area pillar seismicity starts at fa values as low as 1.2 (Ryder and Jager, 2002). There are several formulas for determination of the foundation strength. The criterion proposed by Terzaghi, which is based on soil bearing strength, is given in the following section. Hansen’s formula, which is based on Terzaghi’s formula, considers different shapes of pillars for determination of foundation strength, and is also presented in the following section. After determination of the foundation strength from either Terzaghi’s or Hansen’s formulae, the bearing capacity is determined by dividing the result with a safety factor (SF). The value of SF is usually not less than 3 for relatively unimportant structures and can be as high as 5 for important structures (Smith and Smith, 1998). SF for regional support pillars foundations can therefore be taken as 4.5 due to the importance of the structures (Handley, 2007). 2.4.1. Terzaghi’s Formula. According to Stacey and Page (1986), “Terzaghi’s formula is the most widely used formula for determining the bearing capacity of foundations. The foundation strength is given by: qu. = cN c + qN q + γB p N γ. (11). Nγ. = 1.5(N q − 1)tanφ. (12). Nc. = (N q − 1)cotφ. (13). Nq. = e πtanφ tan 2 (. π φ + ) 4 2. (14). q (MPa) is a parameter which is normally zero unless the failure is likely to take place in a weak bed some distance below or above the floor or roof contact. Nc, Nq and N γ 7.
(17) are bearing capacity factors which depend on the angle of friction of the foundation material.. 2.4.2. Hansen’s Formulae. Hansen based his work on Terzaghi’s formula with some changes, aiming to determine the bearing capacity of pillar foundations (Lecture notes, LTU). Hansen’s formulas for rib and rectangular pillars are considered in this thesis. Rib Pillar. : q u = cN c + 0.5γB p N γ. (15). Rectangular Pillar. : q u = cN q S q cotφ + 0.5γB p N γ S γ − ccotφ. (16). Square Pillar. : q u = cN q (1 + sinφ)cotφ + 0.3γ. p N γ S γ − ccotφ. (17). Bp. Sγ. = 1 − 0.4. Sq. ⎛ Bp ⎞ ⎟ = 1 + ⎜ sinφ × ⎟ ⎜ L p ⎠ ⎝. Lp. (18). (19). Pillar width can be taken as Salamon’s effective width (weff) for Terzaghi’s formula while Bp can taken as pillar width and Lp as pillar length for Hansen’s formulas. Weight, γ (MN/m3) has a positive sign for floor rock and a negative sign for roof rock. S γ and Sq are factors depending on the shape of the pillar.. 8.
(18) 3 FRANK2 SHAFT Rustenburg Platinum Mines (RPM) is one of the Anglo Platinum mining operations in the Northwest Province of South Africa. RPM consists of seven vertical shafts (Bleskop, Brakspruit, Frank1, Frank2, Paardekraal, Townlands, Turffontein) and two declines (Boschfontein, Waterfall). Rustenburg Platinum Mines generates around one third of Anglo Platinum’s Platinum Group Minerals (PGMs) production (Annual Report, 2004). The amount of PGMs produced in Rustenburg Platinum Mines is approximately 1.5 million ounces (oz) (of which Platinum: 820,000 oz; Palladium: 400,000 oz; Rhodium: 114,000 oz) (100 oz = 3.11 kg) There are also production of gold, nickel and copper in smaller quantities, as by-products (Annual Report, 2004). RPM is located on the Bushveld Complex which consists of crystallized ore minerals from a magmatic melt together with other magmatic minerals (Lecture Notes, LTU). There are two reefs where PGMs are mined, Merensky and UG2. The Merensky reef is the main production orebody, while production in UG2 started later as the grades are lower. There are several horizons in between Merensky and the underlying UG2 (Ryder and Jager, 2002). Production at medium depth (~1000 m) is mainly done from Merensky reef, as is the case at Frank2 shaft. Haulages at Frank 2 shaft extends along the East – West strike direction. The eastern boundary is Turffontein shaft while the western boundary is Paardekraal shaft. The ore body roughly dips towards the north with a dip angle of 9 degrees. Previous design for shallow operations used square regional pillars for stope stability associated with dip mining. The panel stability is maintained by crush pillars (2.5 m x 4 m), grout packs and timber elongates. Dip mining has been gradually replaced by breast mining, where the stopes are developed along the strike.. 3.1.. Geology. The Merensky reef in its most common form is a coarse-grained feldspathic pyroxenite generally bounded by thin (20 mm) chromitite layers. The immediate hangingwall is pyroxenite 1-5 m thick which grades upwards through norites to anorthosites. The footwall generally comprises various types of norite and anorthosite, and less commonly feldspathic pyroxenite or harzburgite (Ryder and Jager, 2002).. 9.
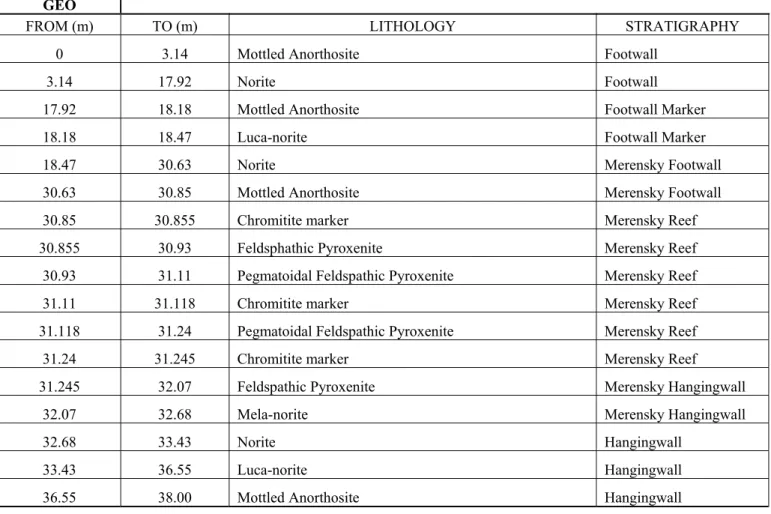
(19) Merensky reef at Frank2 shaft has an average thickness of 1 m, while the mining operation takes place in 1.1 m stopes for operation convenience. The immediate footwall is comprised of lucanorite, mottled anorthosite, and norite. The immediate hangingwall is feldspathic pyroxenite, mela-norite and luca norite. The data in table 1 is taken from a borehole and it represents the stratigraphy of hangingwall, orebody and footwall. Samples from this borehole were used for determination of rock properties at the laboratory and at the shaft.. Table 1. Stratigraphy and Lithology from Borehole Logging Sheet Borehole Number: Level 35 West Prospect/Mine: Frank 2 Shaft, Rustenburg GEO FROM (m). TO (m). 0. 3.14. Mottled Anorthosite. Footwall. 3.14. 17.92. Norite. Footwall. 17.92. 18.18. Mottled Anorthosite. Footwall Marker. 18.18. 18.47. Luca-norite. Footwall Marker. 18.47. 30.63. Norite. Merensky Footwall. 30.63. 30.85. Mottled Anorthosite. Merensky Footwall. 30.85. 30.855. Chromitite marker. Merensky Reef. 30.855. 30.93. Feldsphathic Pyroxenite. Merensky Reef. 30.93. 31.11. Pegmatoidal Feldspathic Pyroxenite. Merensky Reef. 31.11. 31.118. Chromitite marker. Merensky Reef. 31.118. 31.24. Pegmatoidal Feldspathic Pyroxenite. Merensky Reef. 31.24. 31.245. Chromitite marker. Merensky Reef. 31.245. 32.07. Feldspathic Pyroxenite. Merensky Hangingwall. 32.07. 32.68. Mela-norite. Merensky Hangingwall. 32.68. 33.43. Norite. Hangingwall. 33.43. 36.55. Luca-norite. Hangingwall. 36.55. 38.00. Mottled Anorthosite. Hangingwall. LITHOLOGY. STRATIGRAPHY. 10.
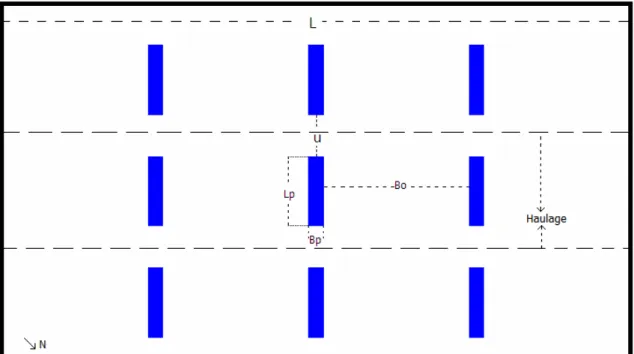
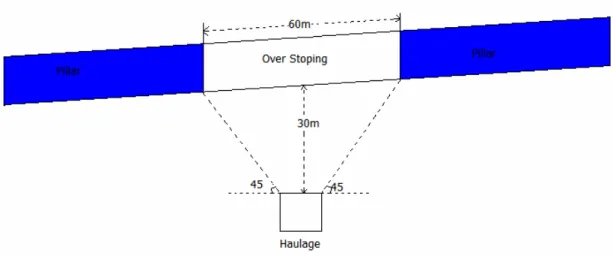
(20) 3.2.. Current Practice. Current practice at the Frank2 shaft is that the new regional support pillars are designed in a rectangular shape with average pillar stress level of 500 MPa. The current layout plan has pillar widths of 18 m to 20 m for all of the sections deeper than 900 m. Frank2 shaft plan shows pillar lengths varying from 20 m to 280 m. Regional pillars are planned along the dip direction, and each regional pillar has a strike span of 200 m. A general illustration of regional support pillar lay out is given in Figure 1.. L: Width of excavation span. Bo: Room Width. u: Overstoping. Bp: Pillar Width. Lp: Pillar Length. Le: Length of excavation (= Lp+u). Figure 1. Regional Pillar Layout Regional pillars are planned to be cut 30m away from the haulages which lie 30 m beneath the tabular reef horizon, based on the 45 degree rule (see Figure 2). This is done in order to avoid high concentrations of stress on the haulages, which are along the strike.. 11.
(21) Figure 2. Location of pillars with respect to haulages (45 degree rule) The current design pillars (given in Table 8 in Appendix 1 of stress calculation) gives extraction ratios ranging from 92.50 % to almost 98 % (97.67 %) with corresponding APS values of 470 MPa to 1510 MPa using the tributary area method. These values suggest a wide range of safety factors for pillars according to the squat pillar strength formula, the lowest being 1.41, which can be considered to be safe. However, short pillars (20 m long) have very high stress values reaching 50 times the virgin stress. In the deep gold mines the experience is that the foundation failure rather than pillar failure is more likely in case of big pillars such as regional pillars. Considering this, it is possible to expect foundation failures rather than pillar failures for regional pillars with dimensions of 20 m by 100 m in a 1.1 m high stope. W/H ratio for these pillars, with using Salamon’s “Effective Width” definition, will become: Weff = 4. A 20 × 100 =4 = 33.33 2(20 + 100) C. (20). then, the ratio W/H becomes as: W/H =. 33.33 = 30.3 1.1. (21). As it can be seen, this ratio is greater than 10, stating the designed regional pillars to be indestructible (Ryder, 2007).. 12.
(22) 4 DESIGN OF REGIONAL SUPPORT PILLARS 4.1.. Rock Mass Properties Determination. Rock mass properties are main input data for calculating the strength of both pillars and their foundations. In order to obtain a realistic design criterion, these properties at different locations have to be determined, using laboratory testing. Extensive testing was not possible because of time limitation, nonetheless some testing on samples were conducted to have representative data for developing a design criterion. Due to availability issues, core samples with diameters of 32 mm were taken from 35 level East and West. Rock mass properties used for calculations were determined using two methods: ¾ Uniaxial and Triaxial Compression Tests at RockLab Laboratory, Pretoria ¾ Point Load Testing at the site. 4.1.1. Lab Testing Samples sent to the laboratory were taken +5 m above reef horizon (hanging wall), reef horizon, and -5 m below reef horizon (foot wall) from 35 level West. Uniaxial and triaxial tests were conducted on these samples to determine UCS, Young’s modulus, Poisson’s ratio and friction angle. Test results are given in Tables 9 and 10 in the appendices. Uniaxial compressive strength, Poisson’s ratio, and Young’s modulus results determined by the uniaxial testing were close to the available average values obtained from the shaft. However, friction angle values obtained from the triaxial testing showed inconclusive results, raising questions about the validity of tests conducted. In order to simplify the analysis, available friction angle value at the shaft was taken for the calculations.. 4.1.2. Point Load Testing Point load testing was initially done using core samples from 35 level East. More than 300 axial tests were conducted according to ISRM suggested method on samples from this borehole for hangingwall, footwall and reef horizons.. 13.
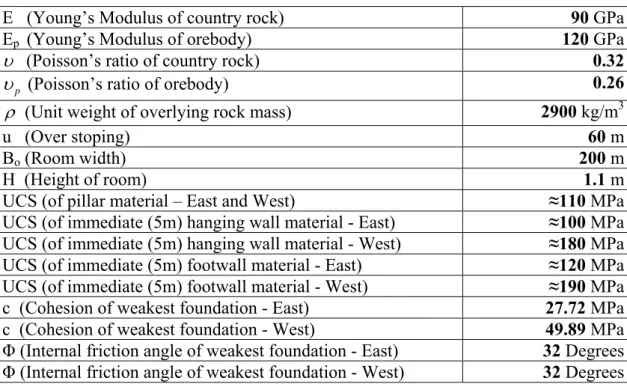
(23) In order to control the accuracy of these tests, 100 axial tests were conducted on samples from 35 level West, which were also used for laboratory testing. The point load test results obtained from 35 level West were then compared to the laboratory test results and it was found that the point load test results were roughly 10 % lower than the laboratory results. Hence a correction factor of 1.1 was used for UCS values determined by point load testing. Comparison of the UCS results obtained from 35 level East and West showed a substantial difference, 100 MPa and 180 MPa respectively, for the weakest foundations. Table 11 in the appendices shows these results.. 4.2.. Design Guidelines. In order to create a design criterion, spreadsheets were created for calculating pillar stress and foundation strength values for different geometries. The results of these calculations are shown in Tables 5 and 6. The pillar stress calculations are based on Tributary Area Method, Coates Method and results obtained from Besol/MS numerical modeling program. For determining foundation strength, formulas from Terzaghi, Hansen, Chamber of Mines Research Organization (COMRO), and Hedley et al. were used. Pillar strength values were not calculated, as the squat pillar formula states these pillars to be virtually indestructible. Details of these calculations with assumptions made are given in the following sections. Figure 1 shows the sample regional pillar design; however, dimensions differ according to different haulage levels and layouts as given in Table 8. A small scale mine plan is provided in Appendix 5. The following parameters in Table 2 are assumed to be the same for calculation of pillar load and foundation strength of different pillars.. 14.
(24) Table 2. Rock Properties Used for Regional Support Pillar Design E (Young’s Modulus of country rock) Ep (Young’s Modulus of orebody) υ (Poisson’s ratio of country rock) υ p (Poisson’s ratio of orebody). ρ (Unit weight of overlying rock mass) u (Over stoping) Bo (Room width) H (Height of room) UCS (of pillar material – East and West) UCS (of immediate (5m) hanging wall material - East) UCS (of immediate (5m) hanging wall material - West) UCS (of immediate (5m) footwall material - East) UCS (of immediate (5m) footwall material - West) c (Cohesion of weakest foundation - East) c (Cohesion of weakest foundation - West) Φ (Internal friction angle of weakest foundation - East) Φ (Internal friction angle of weakest foundation - West). 90 GPa 120 GPa 0.32 0.26 2900 kg/m3 60 m 200 m 1.1 m ≈110 MPa ≈100 MPa ≈180 MPa ≈120 MPa ≈190 MPa 27.72 MPa 49.89 MPa 32 Degrees 32 Degrees. 4.2.1. Pillar Load Calculation Pillar loads are calculated with tributary area method and Coates method for all of the 108 pillars. Due to the limitations of Coates method, some assumptions were made to increase the accuracy of results. The mining span was assumed to be half the depth, although the actual mining span is more than this value. Besides this, the presence of over stoping caused pillars not to be a solid line of pillars, hence affecting the extraction ratio calculation. For simplification purposes, extraction ratio was assumed to be the same for both tributary area method and the Coates method. Numerical modeling provided APS values for 30 pillars out of 108 designed. This was mainly due to the location of the pillars with respect to each other and difficulty of modeling these geometries with Besol/MS. In order to simplify the numerical analysis, the orebody was assumed to be horizontal ignoring the dip angle. Additionally, selecting grid sizes equal to 5 m made it difficult to model pillars such as 18 m in width or 272 m in length accurately. In these cases, the pillars modeled to the closest multiple of 5, such as 20 m and 270 m for these cases. However, a correction factor was used for the dip angle and dimension differences in order to increase the accuracy of the analysis. Table 12 shows these results.. 15.
(25) 4.2.2. Foundation Strength Calculation Foundation strength calculation is based on methods described in the literature review. Empirical formulas are proposed by COMRO and Hedley et al., which assume the factor of fa as 2.5 and 1.2 respectively according to equation 10. Foundation bearing capacity calculation as defined by Terzaghi was also considered. However, Hansen’s formula for rib pillars (equation 15) was considered because of the geometry of the pillars. However, determination of friction angle is crucial for using this formula. The friction angle was assumed to be 32 degrees, but further testing is required in order to get more realistic results.. 4.2.3. Back Analysis of Pillars Back analysis of pillars is accepted as a crucial point for pillar design but it a very difficult task to carry out in underground platinum mines. Moreover, the designed pillars have not been cut yet, contributing further to the difficulty of the task. Back analysis was done by visiting back areas in the eastern part of the shaft on 25, 29 and 30 levels. These pillars were old type regional pillars, therefore having different geometries than the proposed design pillars. However, they were decided to be representative provided that the average pillar stress is determined and combined with site observations for analysis (Ryder, 2007). Among the twelve pillars visited, two showed signs of foundation failure while the rest of the pillars and their foundations were intact. Average pillar stress values were estimated using the tributary area method for all of the visited pillars, while numerical modeling was used as well for estimating APS values for the pillars showing signs of foundation failure. Numerical modeling results were in close approximation to results obtained by the tributary area method, and all of the visited pillars were calculated to have approximately the same extraction ratios, thus making the tributary area results acceptable for the whole analysis. Average pillar stress values were around 200 MPa for intact pillars while it was estimated to be more than 230 MPa for the pillars having foundation failure. Uniaxial 16.
(26) compressive strength and friction angle values were not available for these levels, however the UCS was assumed to be 100 MPa for the weakest foundation while the friction angle was assumed to be 32 degrees for the analysis. Specific weight, γ , for this analysis were taken negative, as the weakest foundations were the hangingwall.. 17.
(27) 18.
(28) 5 ANALYSIS AND RESULTS. Tables 3 and 4 show the input data of the back analysis tabulating the average pillar stress and foundation strength calculations. COMRO and Hedley et al. columns are the proposed APS level in MPa, while Hansen formula column gives the foundation strength value. As it was discussed earlier, good practice for regional support pillars design would be assuming a safety factor of 4.5 (Handley, 2007), so this value is also provided as a different column. Table 3. APS values of the pillars used for back analysis. Pillar Number 1 2 3 4 5 6 7 8 9 10 11 12. Level 25E 25E 25E 25E 25E 25E 25E 25E 25E 25E 29E 30E. Length of pillar (Lp) [m] 23 35 41 25 47 37 42 29 30 20 80 94. Pillar width (Bp) [m] 30 12 27 27 27 35 30 30 33 30 30 35. Depth of Excavation (z) [m] 894 894 894 894 894 894 894 894 894 894 1001 1031. Extr. Ratio (r) 0.875 0.875 0.875 0.875 0.875 0.875 0.875 0.875 0.875 0.875 0.875 0.887. σv (ver. str.) [MPa] 25.43 25.43 25.43 25.43 25.43 25.43 25.43 25.43 25.43 25.43 28.91 29.76. APS [MPa] 203.47 203.47 203.47 203.47 203.47 203.47 203.47 203.47 203.47 203.47 231.28 263.36. Comparison of the APS values with estimated foundation strength values suggests that the foundations will be intact as long as the APS is less than 216 MPa according to Hansen’s formula. Moreover, regional support pillars with APS levels equal to 200 MPa are intact based on the back analysis. This conclusion is also supported by the COMRO analysis, as it is believed to be optimistic, suggesting higher strength values than actual strength values. These values correspond to fa values in between 2.0 and 2.16 in equation 10.. 19.
(29) Table 4. Foundation strength values of the pillars used for back analysis. Pillar Number 1 2 3 4 5 6 7 8 9 10 11 12. UCS of Weakest Foundation [MPa] 100.00 100.00 100.00 100.00 100.00 100.00 100.00 100.00 100.00 100.00 100.00 100.00. Internal friction angle (Φ) (o) 32 32 32 32 32 32 32 32 32 32 32 32. Cohesion (c) [MPa] 27.72 27.72 27.72 27.72 27.72 27.72 27.72 27.72 27.72 27.72 27.72 27.72. Specific weight (γ) [MN/m3] -0.0284 -0.0284 -0.0284 -0.0284 -0.0284 -0.0284 -0.0284 -0.0284 -0.0284 -0.0284 -0.0284 -0.0284. Hansen's Formula [MPa] 974.76 980.08 975.65 975.65 975.65 973.28 974.76 974.76 973.87 974.76 974.76 973.28. Hansen's Formula (SF=4.5) [MPa] 216.61 217.80 216.81 216.81 216.81 216.28 216.61 216.61 216.42 216.61 216.61 216.28. COMRO Formula [MPa] 250.0 250.0 250.0 250.0 250.0 250.0 250.0 250.0 250.0 250.0 250.0 250.0. Hedley et al. Formula [MPa] 120.0 120.0 120.0 120.0 120.0 120.0 120.0 120.0 120.0 120.0 120.0 120.0. Condition. Intact Intact Intact Intact Intact Intact Intact Intact Intact Intact Failure Failure. Considering the importance of regional support pillars, and the fa values, it will be safer to assume this factor as 2.0 as pillars according to this value have not failed. This approach therefore provides a criterion for regional pillar support design, based on foundation strength, which is calculated as: Design APS ≤ 2.0 x UCS of the weakest foundation strata. (22). After determination of fa, regional support pillars modeled are compared to this criterion. This comparison is given in the following section.. 5.1.. Regional Support Pillar Design. As it has been stated, for the design of squat pillars, an empirical criterion should be based on foundation strength rather than pillar stress or pillar strength. As squat pillars would have W/H ratios greater than 10, which is the case in the current criterion, it is not necessary to determine the pillar strength since the pillar will be virtually indestructible. The first step is to estimate a rough pillar dimension. As the regional support pillars were already designed, these dimensions were taken to analyze the strength of the foundations with respect to average pillar stress values. The following table (Table 5). 20.
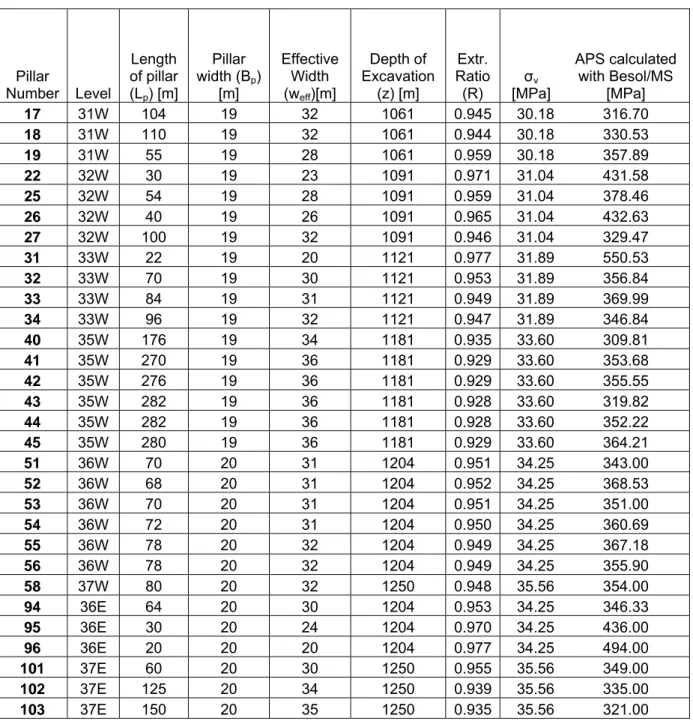
(30) provides information about the pillars used for this analysis, which were modeled in Besol/MS. Table 5. Designed Regional Support Pillars used for analysis. Pillar Number 17 18 19 22 25 26 27 31 32 33 34 40 41 42 43 44 45 51 52 53 54 55 56 58 94 95 96 101 102 103. Level 31W 31W 31W 32W 32W 32W 32W 33W 33W 33W 33W 35W 35W 35W 35W 35W 35W 36W 36W 36W 36W 36W 36W 37W 36E 36E 36E 37E 37E 37E. Length of pillar (Lp) [m] 104 110 55 30 54 40 100 22 70 84 96 176 270 276 282 282 280 70 68 70 72 78 78 80 64 30 20 60 125 150. Pillar width (Bp) [m] 19 19 19 19 19 19 19 19 19 19 19 19 19 19 19 19 19 20 20 20 20 20 20 20 20 20 20 20 20 20. Effective Width (weff)[m] 32 32 28 23 28 26 32 20 30 31 32 34 36 36 36 36 36 31 31 31 31 32 32 32 30 24 20 30 34 35. Depth of Excavation (z) [m] 1061 1061 1061 1091 1091 1091 1091 1121 1121 1121 1121 1181 1181 1181 1181 1181 1181 1204 1204 1204 1204 1204 1204 1250 1204 1204 1204 1250 1250 1250. Extr. Ratio (R) 0.945 0.944 0.959 0.971 0.959 0.965 0.946 0.977 0.953 0.949 0.947 0.935 0.929 0.929 0.928 0.928 0.929 0.951 0.952 0.951 0.950 0.949 0.949 0.948 0.953 0.970 0.977 0.955 0.939 0.935. σv [MPa] 30.18 30.18 30.18 31.04 31.04 31.04 31.04 31.89 31.89 31.89 31.89 33.60 33.60 33.60 33.60 33.60 33.60 34.25 34.25 34.25 34.25 34.25 34.25 35.56 34.25 34.25 34.25 35.56 35.56 35.56. APS calculated with Besol/MS [MPa] 316.70 330.53 357.89 431.58 378.46 432.63 329.47 550.53 356.84 369.99 346.84 309.81 353.68 355.55 319.82 352.22 364.21 343.00 368.53 351.00 360.69 367.18 355.90 354.00 346.33 436.00 494.00 349.00 335.00 321.00. Table 6 shows the foundation strength calculation for these pillars. It has to be observed that the unit weight is taken negative, as the weakest foundation is the hangingwall.. 21.
(31) Table 6 Designed Regional Support Pillars Foundation Strength. Pil. Num. 17 18 19 22 25 26 27 31 32 33 34 40 41 42 43 44 45 51 52 53 54 55 56 58 94 95 96 101 102 103. UCS Weak. Found. [MPa] 180.00 180.00 180.00 180.00 180.00 180.00 180.00 180.00 180.00 180.00 180.00 180.00 180.00 180.00 180.00 180.00 180.00 180.00 180.00 180.00 180.00 180.00 180.00 180.00 100.00 100.00 100.00 100.00 100.00 100.00. Int. Fric. Ang. (Φ) 32 32 32 32 32 32 32 32 32 32 32 32 32 32 32 32 32 32 32 32 32 32 32 32 32 32 32 32 32 32. Coh. (c) [MPa] 49.89 49.89 49.89 49.89 49.89 49.89 49.89 49.89 49.89 49.89 49.89 49.89 49.89 49.89 49.89 49.89 49.89 49.89 49.89 49.89 49.89 49.89 49.89 49.89 27.72 27.72 27.72 27.72 27.72 27.72. Specific weight (γ) [MN/m3] -0.0284 -0.0284 -0.0284 -0.0284 -0.0284 -0.0284 -0.0284 -0.0284 -0.0284 -0.0284 -0.0284 -0.0284 -0.0284 -0.0284 -0.0284 -0.0284 -0.0284 -0.0284 -0.0284 -0.0284 -0.0284 -0.0284 -0.0284 -0.0284 -0.0284 -0.0284 -0.0284 -0.0284 -0.0284 -0.0284. Nq 23.18 23.18 23.18 23.18 23.18 23.18 23.18 23.18 23.18 23.18 23.18 23.18 23.18 23.18 23.18 23.18 23.18 23.18 23.18 23.18 23.18 23.18 23.18 23.18 23.18 23.18 23.18 23.18 23.18 23.18. Nc 35.49 35.49 35.49 35.49 35.49 35.49 35.49 35.49 35.49 35.49 35.49 35.49 35.49 35.49 35.49 35.49 35.49 35.49 35.49 35.49 35.49 35.49 35.49 35.49 35.49 35.49 35.49 35.49 35.49 35.49. Nγ 20.79 20.79 20.79 20.79 20.79 20.79 20.79 20.79 20.79 20.79 20.79 20.79 20.79 20.79 20.79 20.79 20.79 20.79 20.79 20.79 20.79 20.79 20.79 20.79 20.79 20.79 20.79 20.79 20.79 20.79. Sq 1.10 1.09 1.18 1.34 1.19 1.25 1.10 1.46 1.14 1.12 1.10 1.06 1.04 1.04 1.04 1.04 1.04 1.15 1.16 1.15 1.15 1.14 1.14 1.13 1.17 1.35 1.53 1.18 1.08 1.07. Sγ 0.93 0.93 0.86 0.75 0.86 0.81 0.92 0.65 0.89 0.91 0.92 0.96 0.97 0.97 0.97 0.97 0.97 0.89 0.88 0.89 0.89 0.90 0.90 0.90 0.88 0.73 0.60 0.87 0.94 0.95. Hansen's Formula (SF=4.5) [MPa] 392.20 392.20 392.20 392.20 392.20 392.20 392.20 392.20 392.20 392.20 392.20 392.20 392.20 392.20 392.20 392.20 392.20 392.14 392.14 392.14 392.14 392.14 392.14 392.14 217.27 217.27 217.27 217.27 217.27 217.27. COMRO Formula [MPa] 450.0 450.0 450.0 450.0 450.0 450.0 450.0 450.0 450.0 450.0 450.0 450.0 450.0 450.0 450.0 450.0 450.0 450.0 450.0 450.0 450.0 450.0 450.0 450.0 250.0 250.0 250.0 250.0 250.0 250.0. Hedley et al. Formula [MPa] 216.0 216.0 216.0 216.0 216.0 216.0 216.0 216.0 216.0 216.0 216.0 216.0 216.0 216.0 216.0 216.0 216.0 216.0 216.0 216.0 216.0 216.0 216.0 216.0 120.0 120.0 120.0 120.0 120.0 120.0. Comparison of these results with calculated average pillar stress levels are tabulated in Table 7. The safety of foundations is calculated and tabulated using the proposed criterion. Proposed criterion gives APS values less COMRO and Hansen formulae, providing a safe estimation. As it is defined, Hedley et al. formula is the lowest strength value where the back area seismicity starts. For design purposes, the author believes using the criterion would satisfy the foundations safety requirement.. 22.
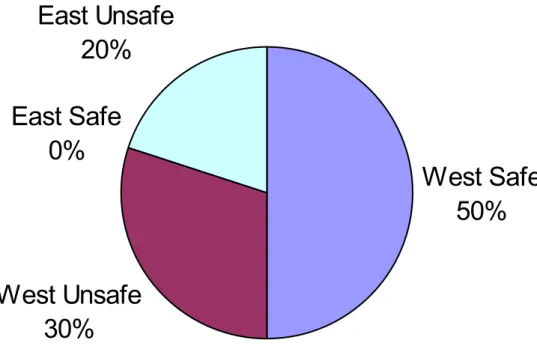
(32) Table 7 Designed Regional Support Pillars Foundation Strength Pillar Number. APS. 17 18 19 22 25 26 27 31 32 33 34 40 41 42 43 44 45 51 52 53 54 55 56 58 94 95 96 101 102 103. 316.70 330.53 357.89 431.58 378.46 432.63 329.47 550.53 356.84 369.99 346.84 309.81 353.68 355.55 319.82 352.22 364.21 343.00 368.53 351.00 360.69 367.18 355.90 354.00 346.33 436.00 494.00 349.00 335.00 321.00. Hansen (SF=4.5). COMRO. Hedley et al.. Proposed Criterion 2 x UCS. Foundations. 392.20 392.20 392.20 392.20 392.20 392.20 392.20 392.20 392.20 392.20 392.20 392.20 392.20 392.20 392.20 392.20 392.20 392.14 392.14 392.14 392.14 392.14 392.14 392.14 217.27 217.27 217.27 217.27 217.27 217.27. 450.00 450.00 450.00 450.00 450.00 450.00 450.00 450.00 450.00 450.00 450.00 450.00 450.00 450.00 450.00 450.00 450.00 450.00 450.00 450.00 450.00 450.00 450.00 450.00 250.00 250.00 250.00 250.00 250.00 250.00. 216.00 216.00 216.00 216.00 216.00 216.00 216.00 216.00 216.00 216.00 216.00 216.00 216.00 216.00 216.00 216.00 216.00 216.00 216.00 216.00 216.00 216.00 216.00 216.00 120.00 120.00 120.00 120.00 120.00 120.00. 360.00 360.00 360.00 360.00 360.00 360.00 360.00 360.00 360.00 360.00 360.00 360.00 360.00 360.00 360.00 360.00 360.00 360.00 360.00 360.00 360.00 360.00 360.00 360.00 200.00 200.00 200.00 200.00 200.00 200.00. SAFE SAFE SAFE UNSAFE UNSAFE UNSAFE SAFE UNSAFE SAFE UNSAFE SAFE SAFE SAFE SAFE SAFE SAFE UNSAFE SAFE UNSAFE SAFE UNSAFE UNSAFE SAFE SAFE UNSAFE UNSAFE UNSAFE UNSAFE UNSAFE UNSAFE. Table 7 shows that 15 out of 30 pillars are unsafe, giving an overall safe pillar ratio of 50 %. For the western pillars, this ratio becomes 37.5 % as 9 out of 24 pillars are unsafe. However, this ratio is 100 % unsafe for pillars on the eastern side as all six pillars are unsafe according to the criterion. The following figure shows this relation.. 23.
(33) East Unsafe 20% East Safe 0%. West Safe 50%. West Unsafe 30% Figure 3 Safety of Regional Support Pillars According to the Criterion Given the analysis with limited time and data, it can be stated that the design APS equal to 500 MPa is a high value. It can also be stated that the abutments show different characteristics, which requires differentiated design for different sections. This analysis is based on the “East” and “West” side of the shaft. However, the boundary in between these two sections, as well as the presence of other zones are not known. The results obtained for foundation strength analysis shows that the overall safe number of pillars is 50 %, which suggests reconsideration of the design. However, as it can be seen from Figure 4, the APS to foundation strength ratio of western pillars is in close agreement with the proposed criterion although the number of unsafe pillars is 37.5 %.. 24.
(34) 1.80 1.60 1.40 Ratio. 1.20. APS / Foundation Strenght Linear (APS / Foundation Strenght). 1.00 0.80 0.60 0.40 0.20 0.00 1. 3. 5. 7. 9 11 13 15 17 19 21 23 Pillar. Figure 4 APS vs. Foundation Strength Ratio for the Western Pillars On the other hand, the ratio of average pillar stress to foundation strength is high for the eastern pillars (Figure 5). This suggests that the design of the eastern part has to be re-evaluated, while the design of western pillars can remain the same and as long as the pillars are observed closely.. 3.00 2.50. Ratio. 2.00. APS / Foundation Strength Linear (APS / Foundation Strength). 1.50 1.00 0.50 0.00 1. 2. 3. 4. 5. 6. Pillar. Figure 5 APS vs. Foundation Strength Ratio for the Eastern Pillars. 25.
(35) 26.
(36) 6 CONCLUSIONS AND RECOMMENDATIONS As stated, the literature in hard rock pillar design is not yet available. However, the engineering problem of design of regional pillars in deep underground platinum mines still exists. Current design of APS=500 MPa is reasonable and a good start, however it has to be refined, which was the purpose of this study in the first place. Based on the available literature, it can be stated that the design criterion of regional support pillars should be based on the strength of the foundations. In order to fulfill this, rock properties has to be determined and pillars have to be observed according to the theory. Due to the scope of this study and the limitations, the design criterion has to be studied further, with rock properties being determined and pillar back analysis being conducted. It has to be mentioned here that the back analysis of the pillars is not easy because of high temperatures; lack of ventilation in back areas, difficulties with navigation, unsafe conditions, and the difficulty of observing foundation failure in hard rocks.. 27.
(37) 28.
(38) 7 REFERENCES Handley, M. ( 2007) Personal Communication, Professor of Mining at University of Pretoria. Jager A.J. and Ryder J.A. (Eds) (1999) A Handbook on Rock Engineering Practice for Tabular Hard Rock Mines, The Safety in Mines Research Advisory Committee (SIMRAC) Publications. Martin C.D. and Maybee W.G. (2000) The Strength of Hard Rock Pillars, International Journal of Rock Mechanics and Mining Sciences No 37. Roberts D.P., van der Merwe J.N., Canbulat I., Sellers E.J., and Coetzer S. (2002) Development of a Method to Estimate Coal Pillar Loading, The Safety in Mines Research Advisory Committee (SIMRAC) Final Report. Ryder, J. A. (2007) Personal Communication, Groundwork Consulting Company Ryder J.A. and Jager A.J. (Eds) (2002) A Textbook on Rock Mechanics for Tabular Hard Rock Mines, The Safety in Mines Research Advisory Committee (SIMRAC) Publications. Sjöberg J. (1992) Stability and Design of Stope Roofs and Sill Pillars in Cut and Fill and Open Stope Mining with Application to the Zinkgruvan Mine, Licentiate Thesis, Luleå University of Technology. Smith G.N. and Smith I.G.N. (1998) Elements of Soil Mechanics, Blackwell Science 7th ed.. Stacey T.R. and Page C.H. (1986) Practical Handbook for Underground Rock Mechanics, Trans Tech Publications. 29.
(39) 30.
(40) 8 APPENDICES Appendix 1 Table 8. West and East Dip Regional Pillars CO-ORDINATES PILLAR NUMBER 1 2 3 4 5 6 7 8 9 10 11 12 13 14 15 16 17 18 19 20 21 22 23 24 25 26 27 28 29 30 31 32 33 34 35 36 37 38 39 40 41 42. WORKING PLACE 25 Level West 26 Level West. 27 Level West. 29 Level West. 30 Level West. 31 Level West. 32 Level West. 33 Level West. 34 Level West 35 Level West. DEPTH FROM SURFACE (m) 894 913 913 913 913 940 940 940 940 1001 1001 1001 1031 1031 1031 1031 1061 1061 1061 1061 1091 1091 1091 1091 1091 1091 1091 1091 1121 1121 1121 1121 1121 1121 1121 1121 1150 1181 1181 1181 1181 1181. PILLAR 25W1 26 W 1 26 W 2 26 W 3 26 W 4 27 W 1 27 W 2 27 W 3 27 W 4 29 W 1 29 W 2 29 W 3 30 W 1 30 W 2 30 W 3 30 W 4 31 W 1 31 W 2 31 W 3 31 W 4 32 W 1 32 W 2 32 W 3 32 W 4 32 W 5 32 W 6 32 W 7 32 W 8 33 W 1 33 W 2 33 W 3 33 W 4 33 W 5 33 W 6 33 W 7 33 W 8 34 W 1 35 W 1 35 W 2 35 W 3 35 W 4 35 W 5. PLANNED X 35940 36125 36000 35935 35813 36000 35900 35935 35820 35800 35674 35500 35700 35625 35500 35330 35563 35500 35375 35230 35770 35625 35563 35500 35438 35350 35250 35140 35600 35500 35480 35380 35313 35240 35125 35000 35560 35470 35500 35340 35290 35125. PLANNED Y 31560 32150 32000 31800 31620 32200 32060 31810 31620 32170 31950 31770 32500 32300 32100 31920 32600 32375 32180 31980 33522 33350 33110 32890 32687 32450 32250 32050 33600 33400 33180 32980 32760 32540 32335 32135 33875 33980 33730 33500 33300 33105. PLANNED LENGTH 118 102 84 62 70 68 68 30 28 160 218 270 118 100 90 90 104 110 55 34 50 30 78 64 54 40 100 87 98 120 22 70 84 96 90 78 96 44 180 176 270 276. 31. PLANNED WIDTH 18 18 18 18 18 18 18 18 18 18 18 18 18 18 18 18 19 19 19 19 70 19 19 19 19 19 19 19 19 19 19 19 19 19 19 19 19 19 19 19 19 19.
(41) CO-ORDINATES PILLAR NUMBER 43 44 45 46 47 48 49 50 51 52 53 54 55 56 57 58 59 60 61 62 63 64 65 66 67 68 69 70 71 72 73 74 75 76 77 78 79 80 81 82 83 84 85 86 87 88. WORKING PLACE. 36 Level West. 37 Level West. 26 Level East 28 Level East 29 Level East 30 Level East 31 Level East 32 Level East. 33 Level East. 35 Level East. DEPTH FROM SURFACE (m) 1181 1181 1181 1181 1204 1204 1204 1204 1204 1204 1204 1204 1204 1204 1204 1250 1250 1250 1250 1250 1250 1250 1250 1250 1250 1250 913 913 971 971 1001 1031 1031 1061 1061 1091 1091 1091 1121 1121 1121 1121 1181 1181 1181. PILLAR 35 W 6 35 W 7 35 W 8 35 W 9 36 W 1 36 W 2 36 W 3 36 W 4 36 W 5 36 W 6 36 W 7 36 W 8 36 W 9 36 W 10 36 W 11 37 W 1 37 W 2 37 W 3 37 W 4 37 W 5 37 W 6 37 W 7 37 W 8 37 W 9 37 W 10 37 W 11 26 E 1 26 E 2 28 E 1 28 E2 29 E 1 30 E 1 30 E 2 31 E 1 31 E 2 32 E 1 32 E 2 32 E 3 33 E 1 33 E 2 33 E 3 33 E 4 35 E 1 35 E 2 35 E 3. PLANNED X 35125 35050 34925 34800 35560 35455 35375 35265 35170 35070 35000 34900 34810 34710 34600 35437.5 35350 35250 33125 35000 34930 34813 34750 34625 34562 34438 37875 37937.5 37500 37600 37375 37000 37120 37000 37030 36600 36687.5 36780 36500 36562.5 36800 36875 35900 36000 36188. PLANNED Y 32550 32680 32485 23295 34385 34215 34055 33846 33625 33430 33250 33050 32850 32625 22425 34450 34305 34140 33945 33730 33952 33365 33135 32950 32700 32540 35875 36050 37550 35937.5 35875 35500 35670 35750 35940 35250 35450 35625 35312.5 35500 35900 36100 34650 34875 35000. PLANNED LENGTH 282 282 280 268 78 48 56 50 70 68 70 72 78 78 78 80 108 122 150 178 182 182 182 182 186 192 118 104 130 98 100 108 85 95 65 45 62 38 100 94 76 144 122 185 215. PLANNED WIDTH 19 19 19 19 20 20 20 20 20 20 20 20 20 20 20 20 20 20 20 20 20 20 20 20 20 20 18 18 18 18 18 20 19 19 19 19 19 19 19 19 19 19 20 20 20. 1181. 35 E 4. 36250. 35200. 200. 20. 32.
(42) CO-ORDINATES PILLAR NUMBER 89 90 91 92 93 94 95 96 97 98 99 100 101 102 103 104 105 106 107 108. WORKING PLACE. 36 Level East. 37 Level East. DEPTH FROM SURFACE (m) 1181 1181 1181 1181 1204 1204 1204 1204 1204 1204 1204 1204 1250 1250 1250 1250 1250 1250 1250 1250. PILLAR 35 E 5 35 E 6 35 E 7 35 E 8 36 E 1 36 E 2 36 E 3 36 E 4 36 E 5 36 E 6 36 E 7 36 E 8 37 E 1a 37 E 1 37 E 2 37 E 3 37 E 4 37 E 5 37 E 6 37 E 7. PLANNED X 36310 36437.5 36570 36700 35900 35750 35870 35940 36062 36190 36315 36400 35500 34813 35745 35850 36000 36062 36125 36200. PLANNED Y 35430 35825 36000 36180 34555 34750 35000-35 35140 35350 35730 35920 36125 34625 35640 35044 35200 35625 35813 36040 36300. PLANNED LENGTH 170 110 232 220 95 64 30 20 74 50 80 90 60 125 150 178 178 190 200 200. 33. PLANNED WIDTH 20 20 20 20 20 20 20 20 20 20 20 20 20 20 20 20 20 20 20 20.
(43) Appendix 2 Table 9. Results of Uniaxial Compression Tests. 34.
(44) Appendix 3 Table 10. Results of Uniaxial Compression Tests. 35.
(45) Appendix 4 Table 11. Point Load Test Results. Level (1181m). Length Range From To. Depth Range From To. Length (m). 35E(+90). 41.55. 44.00. 1139.45. 1137.00. 2.45. 35E(+90). 41.19. 41.55. 1139.81. 1139.45. 0.36. 35E(+90). 38.02. 41.19. 1142.98. 1139.81. 3.17. 35E(+90). 33.04. 38.02. 1147.96. 1142.98. 4.98. 35E(+90) 35E(+46). 31.96 30.30. 33.04 31.96. 1149.04 1150.70. 1147.96 1149.04. 1.08 1.66. 35E(+90). 21.77. 30.30. 1159.23. 1150.70. 8.53. 35E(+90). 19.23. 21.77. 1161.77. 1159.23. 2.54. 35E(+90). 18.65. 19.23. 1162.35. 1161.77. 0.58. 35E(+90). 16.36. 18.65. 1164.64. 1162.35. 2.29. 35E(+90) 11.57 16.36 1169.43 1164.64 * UCS value for the reef obtained from a different hole.. 4.79. REEF*. Luca-norite Norite Mottled Anorthosite Luca-norite Norite. 146.09 145.31 94.29 90.17 96.88 116.25 130.09. FW. 110.80 183.94. 36.70 38.00 1144.30 1143.00 Sample sent to RockLab for testing. 1.30. Mottled Anorthosite. 166.63. 35W(+90). 19.02. 26.08. 1161.98. 1154.92. 7.06. 35W(+90). 18.16. 18.30. 1162.84. 1162.70. 0.14. 35W(+90). 17.95. 18.10. 1163.05. 1162.90. 0.15. 35W(+90). 12.00. 16.49. 1169.00. 1164.51. 4.49. REEF*. Norite Luca-norite Mottled Anorthosite Norite. Reef. 113.16. Specimen Name. 35W(+90). HW. 96.14. Average UCS (MPa). (1181m). Depth Range From To. Bastard Pyrox. Chromite Mottled Anorthosite Spotted Anorthosite Luca-norite. Length (m). Level. Length Range From To. Specimen Name. Average UCS (MPa). HW Reef. 189.05 164.69 130.78. FW. 88.07. 36.
(46) Appendix 5. Figure 6. Frank2 Shaft Mine Plan. Regional support pillars are shown in orange color. Shaft is in the center, and horizontal lines represent haulages, upper one being the shallowest and lower one being the deepest.. 37.
(47) Appendix 6 Table 12. Correction factors applied to numerical modeling results Pillar Number. 17 18 19 22 25 26 27 31 32 33 34 40 41 42 43 44 45 51 52 53 54 55 56 58 94 95 96 101 102 103. APS Calculated by Besol/MS 298.00 314.00 340.00 410.00 353.00 411.00 313.00 523.00 339.00 365.00 351.00 296.00 336.00 339.00 306.00 337.00 346.00 343.00 358.00 351.00 371.00 358.00 347.00 314.00 341.00 436.00 494.00 349.00 335.00 321.00. Real Area. Besol Area. 1976.00 2090.00 1045.00 570.00 1026.00 760.00 1900.00 418.00 1330.00 1596.00 1824.00 3344.00 5130.00 5244.00 5358.00 5358.00 5320.00 1400.00 1360.00 1400.00 1440.00 1560.00 1560.00 1600.00 1280.00 600.00 400.00 1200.00 2500.00 3000.00. 2100.00 2200.00 1100.00 600.00 1100.00 800.00 2000.00 440.00 1400.00 1700.00 1900.00 3500.00 5400.00 5500.00 5600.00 5600.00 5600.00 1400.00 1400.00 1400.00 1400.00 1600.00 1600.00 1600.00 1300.00 600.00 400.00 1200.00 2500.00 3000.00. APS After Besol Area Correction 316.70 330.53 357.89 431.58 378.46 432.63 329.47 550.53 356.84 388.78 365.63 309.81 353.68 355.55 319.82 352.22 364.21 343.00 368.53 351.00 360.69 367.18 355.90 314.00 346.33 436.00 494.00 349.00 335.00 321.00. APS After Besol Level Correction 316.70 330.53 357.89 431.58 378.46 432.63 329.47 550.53 356.84 369.99 346.84 309.81 353.68 355.55 319.82 352.22 364.21 343.00 368.53 351.00 360.69 367.18 355.90 354.00 346.33 436.00 494.00 349.00 335.00 321.00. 38.
(48)
Figure
+7

![Table 4. Foundation strength values of the pillars used for back analysis Pillar Number UCS of Weakest Foundation [MPa] Internal friction angle (Φ) (o) Cohesion (c) [MPa] Specific weight (γ) [MN/m3] Hansen's Formula[MPa] Hansen's Formula(SF=4.](https://thumb-eu.123doks.com/thumbv2/5dokorg/5495607.143114/29.892.68.835.124.475/foundation-strength-analysis-weakest-foundation-internal-cohesion-specific.webp)


Related documents
The examples in the design guidelines show parts of high weight attached both with screw joints and with alternative method.. Screw
1) The Discrimination Act (2008:567).. CERTIFICATES AND PLANNING Students who have been diagnosed with disability can apply for educational support. One prerequisite for
Schwartz’s theory of universal values is implemented in the model in such a way that agents can make value trade-offs, which are operationalized into a measure of refugee wellbeing
Inom ramen för uppdraget att utforma ett utvärderingsupplägg har Tillväxtanalys också gett HUI Research i uppdrag att genomföra en kartläggning av vilka
One for training (i.e., a file with all the variables and the measured pollution value for each moss station), and one for estimating pollution values for all of Sweden (i.e., a
Swedenergy would like to underline the need of technology neutral methods for calculating the amount of renewable energy used for cooling and district cooling and to achieve an
Självfallet kan man hävda att en stor diktares privatliv äger egenintresse, och den som har att bedöma Meyers arbete bör besinna att Meyer skriver i en
The program included a group of researchers on life cycle assessment (LCA) and systems analysis of waste management.. To this group, specialists in national economy,
