Water Shortages and its Environmental
Consequences within Tigris and Euphrates Rivers
Nadhir Al-Ansari1, Nasrat Adamo2 and Varoujan K. Sissakian3Abstract
Water shortage problem is an international issue where 80 countries of the third world supporting 40% of the world’s population suffer from water shortage problems. There are 1.2 billion people suffering physically from water shortage problems and 1.8 billion lack adequate sanitation. In addition, in the Third World, about 80% of illnesses and 30% of unnatural deaths are due to water disease and polluted water. Future expectations indicate that 37 countries in 2015 will be having water shortage problems. Iraq was an exception till the seventies due to the presence of the Tigris and Euphrates Rivers. The flow of these rivers is decreasing due to climate change and building of dams within the upper parts of the catchments. Temperatures are increasing while rainfall is expected to decrease by (15-25%). This will cause reduction of surface water resources by (29-73%). As a consequence, groundwater resources will be depleted. Water shortage will lead to an increase in transpiration, reduction off arable land, decrease of natural vegetative cover, extended desertification, more dust storms and soil destruction. It is expected that Iraq in 2040 is expected to have -20.6 billion cubic meters shortage in its water requirements.
Keywords: Tigris River, Euphrates River, Water shortage, Environment, Iraq.
1 Lulea University of Technology, Lulea 971 87, Sweden.
2 Consultant Engineer, Norrköping, Sweden.
3 Lecturer, University of Kurdistan, Hewler, KRG, Iraq and Private Consultant Geologist, Erbil,
Iraq.
Article Info: Received: October 20, 2019. Revised: November 11, 2019. Published online: December 6, 2019.
1. Introduction
Turkey, Syria, Iran, Jordan, Saudi Arabia and Iraq are part of the Middle East and the Tigris-Euphrates basin lies within these countries (Figure 1). The total area of these basins is 487103km2 and the lower part of this area is referred to as “Mesopotamia”. This area witnessed the dawn of civilization during Sumerians time about 8000 years ago. To improve agricultural production, the inhabitants invented the first form of irrigation technique as well as inventing the first written communication, or handwriting and they used the rivers to transport grain. In view of these practices it is called the hydraulic civilization.
Figure 1: Middle East and North Africa (left) and Tigris-Euphrates basins (right).
Despite the productive wealth and prosperity of the Mesopotamian region for many millennia, there was wave after wave of conflicts and this is well reflected through myths, legends and historical accounts that survived from earlier times e.g. Epic of Gilgamesh [1]. During wars, water supply systems were destroyed and a good of this is the invasion of the Mongols in the thirteenth century, destroying the majority of elaborate canal systems, built centuries before [2]. After this period, more rural society existed creating a huge dependence on irrigated agriculture for its survival. Recently, the Middle East and North African region (MENA) is characterized by its water shortage problems [3,4, 5, 6, 7] where most of the countries have less than 500 m3 of renewable water resources per capita available [8]. For this reason, the stability of the region is affected due to water shortage problems where in 1985, UN Secretary General Boutros Boutros-Ghali said that the next war in the Near East would not be about politics, but over water [9].
In this paper, the concentration will be on Iraq and Syria simply because Turkey and Iran are the least effected countries. This is due to the fact that the Tigris and Euphrates Rivers rise in Turkey. As far as Iran is concerned, most of the tributaries
of the Tigris and Shatt al Arab Rivers rise from Iran. Iran had made schemes to keep the flow of these two tributaries of Shatt al Arab inside the Iranian territory and no flow reaches Shatt Al Arab now from these tributaries [10,11]). This is due to the fact that Iran is recently suffering from water shortage problem [12].
Turkey water resources are higher than its requirements (Tables 1 and 2, and Figures 2 and 3) relative to Syria and Iraq (FAO, 2003; World Bank, 1993). In addition, the total renewable water resources (TRWR) and dependency ratio is better than Syria and Iraq (Figure 3) [13]. For these reasons, the water shortage will mainly affect Syria and Iraq. In Syria, the present situation and wars have destroyed everything and as a consequence this chapter will concentrate mainly on Iraq.
Table 1: Water resources per country and territory (modified from [13]
Country Total Withdrwal (km3/year) Per capita withdrawal (m3/year) Domestic withdrawal (%) Industrial withdrawal (%) Agricultural withdrawal (%) Date of information According to Wikipedia, 2017 Iran 72.88 1,048 7 2 91 2000 Iraq 41.98 723 18 37 45 1998 Turkey 39.78 544 15 11 74 2001 Syria 20.13 720 8 10 82 2000
According to World Bank 1993
Iran 4 9 87
Iraq 3 5 92
Turkey 24 19 57
Table 2: Fresh water withdrawal accessed in June 2008 ([14,15]).
Unit Turkey Iran Syria Iraq
Total area (FAOSTAT, 1999) km2 774
820 438 320 185 180 438 320 Total population (FAOSTAT, 2000) 1000 inhab. 66668 22946 16189 22946
Average precipitation 1961-1990 (IPCC)
(km3/year) 459.5 94.7 46.7 94.7
Internal Resources: surface (km3/year) 186.0 34.0 4.8 34.0 Internal resources: ground water (km3/year) 69.0 1.2 4.2 1.2
Internal resources: overlap (km3/year) 28.0 0.0 2.0 0
Internal resources: total (km3/year) 227.0 35.2 7.0 35.2 External resources: natural (km3/year) 4.7 61.2 39.1 61.2
External resources: actual (km3/year) 2.3 40.2 19.3 40.2
Total resources: natural (km3/year) 231.7 96.4 46.1 96.4 Total resources: actual (1) (km3/year) 229.3 75.4 26.3 75.4
Dependency ratio % 1.0 53.3 80.3 53.3
IRWR per capita m3/year inhab. 3405 1534 432 1534
TRWR (actual) per capita m3/year inhab. 3439 3287 1622 3287 IRWR Internal renewable water resources
Figure 2: Contribution of Turkey, Syria and Iraq to the Euphrates and Tigris Rivers and Their Demands (in Billion cubic meters per year). (after [16]).
Figure 3: Water resources in the Middle East region, total renewable water resources (TRWR) and dependency ratio ([13]).
2. Global Climate Change
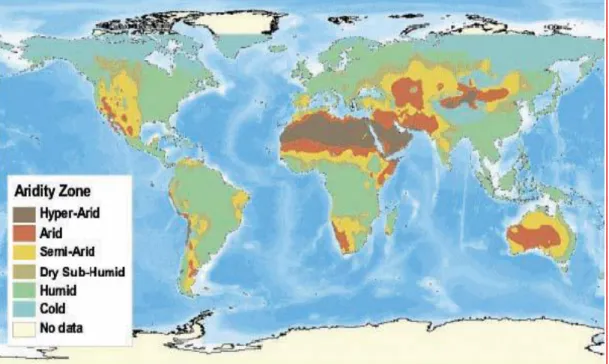
The Middle East and North Africa are considered as hyper-arid, semi-arid and arid land zones (Figure 4) [17] and are among the most vulnerable regions to the impact of climate change [18,19]). This region suffers from aridity, recurrent drought and water scarcity. Nowadays, the average temperature is increasing less and more erratic precipitation, and sea level rise (SLR) [7]. Five countries (Kuwait, 52.6 °C, Iraq, 52.0 °C, Saudi Arabia, 52.0 °C, Qatar, 50.4 °C, and Sudan, 49.7 °C) had abnormal temperature changes among the top 19 countries affected by climate change in the world [9]. Furthermore, the temperature is expected to become higher with time (Figure 5, as an example) and intense heat waves will be affecting inhabitants, crops and marine ecosystems and fisheries. [20] (2010) stated that the temperature will increase by 3–5°C at the end of the century and precipitation will decrease by 20%. IPCC (2007a) indicated that run-off will be reduced by 20 to 30% in most of MENA by 2050, while water supply will be reduced by 10% [21]. Rainfall is expected to decrease (Figure 6 as an example) and becomes more intensive. In this case, there will be more droughts, greater flooding, sea level rise,
more intense cyclones, new areas exposed to dengue, malaria, and other vector and waterborne diseases [22, 23, 24,25,26,27]. Limited precipitation will keep the soil dry and this will enhance the formation of more dust [28] and this in turn will cause more dust storms or aerosol pollution, which change cloud properties and reduce the precipitation in the polluted region.
Figure 5: Average daily temperature of Iraq for the period 1901-2016 (Source: Iraqi Meteorological Office).
Global Climate Change which results in Global warming will lead to sea level rise as direct result of Polar ice melting and Sea water level is predicted to rise between 30 cm and 1 meter by the end of the century [18]. The rise of sea level seems to be increasing with time where it was 1.8 mm/year for the period 1961-2003 and it increased to 3.1mm/year for the period 1993-2003 [30]. Shatt al Arab basin will be first area to experience the effect of the sea level rise where water will cover the low areas within its basin that extends till south of Baghdad (Figures 7 and 8) [17, 31].
Figure 6: Average monthly rainfall of Iraq for the period 1901-2016 (source: Iraqi Meteorological Office).
According to [33], the impact of the climate change and rapid trends of population growth rates indicates that Syria will experience severe water shortages by 2050, and only Iraq is expected to be in a relatively better situation. It is expected that water discharge of the Tigris and Euphrates Rivers will decrease with time to the end of the 21st century due to climatic changes; however, the magnitude of the change is highly uncertain [34].
In addition, agricultural production will be affected due to the drought and the fact that most of the agricultural areas of MENA region are rain-fed [35, 36, 37].
3. Construction of Hydraulic Structures
Water storage and regulation dates back to 1914 on the River Euphrates and 1939 on the River Tigris (Table 3). The purpose of the structures at that time was mainly for irrigation and flow diversions. Later, in the purpose of these structures included hydropower generation, flood control and water supply. The capacity of the existing dams in Turkey and Syria is about 95km3 and 15km3, respectively (Table 3).
When the South-eastern Anatolia Project (GAP) is finished then Turkey can store 100km3. This quantity of water is more than what is required (Table 2 and Figures 2 and 3). After construction of all the dams of the GAP project, Syria and Iraq will be highly affected. Turkey has better capability than Syria and Iraq to produce grains [38], where Syria and Iraq used to export grains and now they are importing grains. Syria tried to achieve self-sufficiency where it doubled its irrigated areas and
Figure 8: Effect of the Sea Level Rise on Iraq and Kuwait (Source: [32]).
used drip irrigation technique but due to water scarcity wheat yield decreased by 50% and much of the livestock had died. For this reason, many people joined insurgents to live [39]. Iraq was planning to be an exporter country by 2017 [40, 41] but now they are importing everything [42,43]. This reflects how bad the agricultural situation is at Iraq now [42,43]). Syria and Iraq consider this plan of food self-sufficiency is of minor importance and priority is given to national security.
It is known that water requirements from the River Euphrates is about 40 BCM (for Turkey 15.7 BCM, Syria 11BCM and Iraq 13BCM) [7]. Before 1990, Syria used to receive 21km3/year of the Euphrates water, which dropped to 12km3 in 2000 onward (40% reduction). Iraq experienced the same situation, where it used to receive 29km3 before 1990 and it dropped to 4.4km3 now (90% reduction). Due to this, agricultural land in both countries will be reduced from 650000 to 240000 hectares and the water quality will be deteriorated; due to back water irrigation directed toward the main channel in its upstream reaches [44].
When Ilisu Dam (is constructed on the River Tigris) starts to operate, then the volume of water that Iraq will receive will be 9.7km3 only and this means that 696000 hectares of agricultural land will be abandoned due to water scarcity [7,44]. The present water demand in Turkey does not exceed 16 km3/ year, while its water supplies reach 195km3/year [45] (and future demand in 2050 will not exceed more than 27km3/year, if the population growth rate is as it is now, and then the population is will be 91 million. For this reason, the Turkish Government is planning to export 500 million m3/year to Israel [44].
The quantity of the water for Syria and Iraq will be reduced due to the development within the upper parts of the Euphrates – Tigris catchments. The quantity of the water interring Iraq will drop to 28% [44]. Syria was planning to double its irrigated area (740000 ha) before 2013 and in this case, the water withdrawal will increase from 5 BCM to 9 BCM [46]. The decrease of flow of the Tigris and Euphrates Rivers will cause serious consequences for Syria and Iraq, where agricultural lands will be reduced. Furthermore, there will be less hydropower generation, more drying of the marshes, further deterioration of the water quality, farmers and fishermen will leave their homes, low groundwater levels and finally, it will give rise to the risk of regional conflicts [6,47].
Iran has diverted all the water from the two main tributaries of Shatt al Arab (Karun and Karkha Rivers) (Table 3) [48]. In addition, Iran recently constructed a new dam on one of the Lesser Zab tributaries [49] and this led to a major reduction of water and the Kurdish minister of agriculture said that he is going to discuss this with Iran. He added that Kurdistan Region has 17 small and medium sized dams to preserve water and he hopes that these will prevent any shortage [49,50].
Table 3: The constructed dams in the basin of the Euphrates- Tigris Rivers. (modified after [51]).
Name of dam Country Use Data of operation Height (m) Storage capacity (km3) Water surface area (km2) Hydropower (MW) River Tigris Kut Iraq I 1939 Samarra-Tharthar Iraq FD, I, HP 1954 ___ 85 2420 87 Dokan, L. Zab, Iraq HP,I 1959 116.5 6.8 270 400
Derbendikhan,
Diyala, Iraq I 1961 128 3 114 ___
Dez Iran HP,I 1962 203 3.46 ___ 520
Dibbis, L. Zab, Iraq I 1965 22 0.05 32
Cag-cag Turkey HP,FD 1968 14
Diyala Iraq I 1969 12 ___ ___ ___
Devegecidi Turkey I 1972 33 0.2 32.1 ___
Karun Iran HP,I 1977 200 3.14 54.8 1000
Hamrin, Diyala, Iraq I, FC 1981 40 3.56 450 50
Mosul Iraq HP,I,FC 1986 113 11.1 380 750
Goksu Turkey I 1991 46 0.06 3.9 ___
Kralkizi Turkey HP 1997 113 1.92 57.5 90
Dicle Turkey HP,I, WS 1997 75 0.60 24 110
Batman Turkey HP,I 1998 71 1.18 49.2 198
Marun Iran HP,I 1998 165 1.2 25 145
Al-Adheem Iraq HP,I 1999 ___ 1.5 ___ ___
Karkheh Iran HP,I,FC 2001 128 7.8 ___ 400
River Euphrates
Al Hindiyah Iraq FD 1914 ___ ___ ___ ___
Ramadi-Habbaniyah Iraq FCI 1948 ___ 3.3 426 ___
Ramadi Raazza Iraq FC 1951 ___ 26 1810 ___
Keban Turkey HP 1974 163 31 675 1330
Tabaqa Syria HP, I 1975 60 11.7 610 800
Fallujah Iraq I 1985 ___ ___ ___ ___
Haditha Iraq HP,I 1987 57 8.2 503 660
Baath Syria HP, I, FC 1987 ___ 0.09 27.2 75
Karakaya Turkey HP 1987 158 9.58 268 1800
Upper Khabur Syria I 1992 ___ 0.99 1.4 ___
Ataturk Turkey HP, I 1992 166 48.7 817 2400
Tishrine Syria HP 1999 40 1.9 166 630
Karkamis Turkey HP, FC 1999 21 0.16 28.4 189
Birecik Turkey HP, I 2000 53 1.22 56.3 672
4. Water Supply and Demand
Turkey has no problem in water supply and demand and it claims that the allocation per capita in Syria and Iraq is suitable for the requirements of their people (Table 4). Water shortage problems in Syria were discussed by various authors [52,53]. The total irrigated areas in Syria is 1 442,530 ha (Table 5) [54]. About 83% of this land is irrigated using flood irrigation, 12% using sprinkler irrigation and 6% using drip irrigation [55]. The total used water in different sectors is 14700 Mm3which is distributed for agricultural (12750=87%), domestic (1390=9%) and industrial (570=4%) sectors [56]. [57] estimated the total water demand in Syria in 2025 will be 23555 MCM (12 % Domestic, 82.5% Agriculture and 5.5% Industrial) compared to 17130 MCM in 2000 (Table 5). It can be noticed also that the major water consumer is agriculture in Syria (Tables 5 and 6). According to [54] the total irrigated area in Syria is 1 442 530 ha of which 82.5% is irrigated by traditional methods and the remainder using modern methods (Table 6) [54]. The [58] reported that the damage of the infrastructure due to war reduced the access to safe water by 50%.
Table 4: Water allocation per capita per year in Turkey, Syria and Iraq (a-[59];
b-[60]).
Table 5: Current and projected water allocation in Syria and Iraq
(in million cubic meters) ([57]).
Country 1990 2000 2010 2020
Turkey 3223 2703 2326 2002a, 980b
Syria 1636 117 880 760a,780b
Iraq 2352 1848 1435 1062a,950b
Country 1990 2000 2025
Dom. Agric. Ind. Dom. Agric. Ind. Dom. Agric. Ind. Total Syria 650 6930 146 1280 15370 480 2825 19430 1300 23555
Table 6: Total irrigated area (ha) in Syria, in 2011 by traditionally irrigated methods and modern methods ([54]).
Flood: Traditionally irrigated area Modern irrigation area Grand total irrigated area Pumped Gravity Private wells Government projects Rivers and springs
Total flood Sprinkler Drip Total
671 874 288,312 231,342 1,191,528 167,201 83,801 251,002 1,442,530
Iraq like Syria, also suffers from the gap between supply and demand. Various authors gave different numbers [44,46,61,62,63]. The irrigation has the highest share in water consumption, where it reached 39 MCM in 1991 and in 2003/4 it was reduced due to war to 22 MCM of water derived assuming 50% irrigation efficiency, while the real efficiency might be 25–35% [46]. Agricultural land in Iraq is 3.5 million ha and the water required for this land assuming good irrigation efficiency is 50 MCM, while in reality, only 1.9 million ha is cropped [7]. Other demand includes 5 BCM for the sanitation sector. Losses increased in this sector due to the fact that the infrastructure is out of service. Evaporation from reservoirs reaches 10 BCM annually and restoring the marshes requires 16 BCM and stream flow demand reaches 3 BCM annually [7]. Since the industry is not going well now; therefore, its demand decreased.
Available water in Iraq reaches 2400 cubic meter per person per year (75 BCM) [61,64] and this is more than it is in Syria and Iran, but less than Turkey (Figure 9). The available quantity of water is (59–75) BCM, while the demand is 73 BCM; apart from the required water for the marshes [7]. Water supplies are expected to drop to 10 to17.6 BCM by 2025 [61], while the demand will be 66.85 BCM [65] or 77 BCM [66].
Figure 9: Water allocation (cubic meters) in some neighbouring countries to
5. Sanitation and Distribution Network
The conflict in Syria started in 2011, and since then it had a severe impact on the availability of the drinking water which has been reduced on average to half of pre-crisis levels (Figure 10) [68]. The water supply was highly affected due to deliberate shut down of supply and electric power systems, sabotage and damage of power generation plants’ gas feed systems, failure of existing water supply systems to meet the increased demand created by large influxes of displaced people, and systemic systems’ failure due to sub-optimal maintenance [68]. To keep the system working requires 55.5 million US Dollars and the available is only 26 million US Dollars [68]. The risk of disease has increased because of the damage to the water and sanitation systems. As a result of the conflict, the following outcomes were noticed by [69]:
-The availability of water per person in certain areas has decreased to one third of pre-crisis levels, from 75 to 25 litres per person per day.
- At Deir Ez-Zor and Damascus the water pumping dropped up to 90 and 20% respectively.
-Urban water supply networks are subjected to system failure and are vulnerable to attacks.
-In areas where water networks are not functional, water trucking is used. A 3000 litres truck cost 15 US Dollars and it can serve a family of 7 only 15 days.
-Sewage treatment decreased from 70 to 35%.
- Cases of diarrhoea were reported by large majority of households.
- Number of people is displaced and living in shelters are subjected of deteriorating sanitary conditions.
-Each shelter host 600 families and the water supplies are very limited. -In shelters usually 70 people share one toilet.
- Simple daily life requirements like soap, laundry detergent, toilet paper, baby diapers and sanitary pads are hard to get.
Figure 10: Access to water and sanitation by governorate in Syria ([69]).
[29] stated that 92% of the population of Iraq is living in house- holds using improved sanitation and 82% of this category use flush toilets connected to sewage systems or septic tanks or latrines (Figure 11). In urban and rural areas improved sanitation is 98% and 82% respectively. In metropolitan areas only 48% have their toilets connected to pipe sewer systems, 57% have septic tanks in urban areas and 36% flush their toilets to latrines which is very common in rural areas. There is an overflow of the effluent into the environment because most of the sewage treatment plants and septic systems do not function properly [70]. According to the [46], only 14 cities out of 252 urban centres have wastewater treatment plants and the capacity of these plants reaches 350,000 cubic meters per day that serve 8% of the population. Furthermore, about 70% of the sewage water is directly discharged to rivers [46]. Both drinking water distribution and waste water system networks are damaged, which causes mix of water and for this reason many people are infected [29,46,70,71].
In 1991, safe water supplies used to reach 100% urban and 54% rural areas in Iraq, after that the situation deteriorated and now 33% of the population do not have safe water and sanitation [7, 44, 72]. Nowadays, it is assumed that 73% in urban areas and 40-45% in rural areas have water supply and it is limited to several hours each day. [70] stated that 79% of the population has access to drinking water of which 92% are in urban and 57% in rural areas. The survey executed by MICS indicated that: (i) Those having access to water it takes them 21 minutes and 42 minutes in rural areas to reach water source to bring 17% of all households. (ii) About 21% have no access to drinking water. (iii) Those having access to drinking water, 16% have daily problems, 7% have weekly problems, 15% have less than weekly problems and 41% have reliable sources. Domestic water shortage reaches 1.7
BCM/day [72] and if the percentage per capita is decreased, then there will be excess to water (Table 7). The water supply is half of the demand which reaches 11 million cubic meters per day [72]. The Iraqi Government plan was designed so that by the year 2015, 91% of the population will have drinking water supply [61]. The efficiency of the water distribution is very poor where it does not exceed 32% and it is decreasing more with time [46] and this might explain the decrease in water allocation per capita since 1980 [73].
Figure 11: Percentage of household using sanitary means of excreta disposal, by governorate, Iraq, 2005. (source [29]).
Table 7: Scenarios of domestic water availability and demand ([72]).
6. Desertification
The climate in Syria is semi-Arid with about 33% of its land can be considered as arable. Only 3% of its land is covered with forests and Badia desert covers 55%; being the driest area in the country. It has been reported that there is an increase in fallow and non-irrigated lands of 10% over the 10 previous years, a decrease in pasture productivity of 61% between 1981 and 1999, and the destruction of 5000 hectares of forests (Courcy´s Intelligence, 2011). Furthermore, despite the enough rainfall in 2010, still the World Food Programme (WFP) distributed food rations to 190,000 people in the eastern provinces of Hasakah, Deir al-Zor and Raqqa [74]. Climate change has a big impact on desertification In the Mediterranean region and in particular Syria [75].
Water became scares in 2006 in Syria, where it suffered its worst drought in 900 years; it ruined farms, forced as many as 1.5 million rural locals to crowd into cities alongside Iraqi refugees and decimated the country’s livestock [76]. It is believed that water shortage will be higher in coming decades and demand will increase in the Middle East. This will cause instability in other countries by impairing access to food and water. The main factors contributing to desertification in Syria are mismanagement of the natural resources and land fragmentation [77]. During 2006-2010 draught years, the agriculture system eventually collapsed in eastern Syria [78]. One of the problems was mismanagement of the pastures where they were over-grazed by free-ranging pastoralists[78].
In addition, the ongoing conflict made the situation worse, where the food supplied decreased tremendously and UNICEF planned to supply food for 2.6 million Syrian children in 2015 [79]. About 18500km2 area is decertified in Syria and this forms 9.99% of the total area of the country and 109020km2 area is vulnerable to desertification [70]. The salinization and water logging affected 50% of the reclaimed lands in the Euphrates plain in Iraq and Syria [80]. This will certainly speed up the desertification; especially the water deficit reaches 5.6 BCM. In addition, degradation affects more than 90% of the rangelands in Syria and Iraq [81, 82].
Several factors contributed to the increase of the desert land in Iraq. The decrease of the flow of the Tigris and Euphrates Rivers, increasing the salinity of soil, water quality deterioration and repeated droughts [83,84]. In addition, large number of palm and other trees were destroyed which were acting as barriers against the
Water Usage (liters/capita/day) Population (millions) Water Supply/Day (million cubic meters) Water Supply/Day (million cubic meters) Balance (million cubic meters/Day) 350 24 8.5 6.8 -1.7 250 24 6 6.8 0.8 200 24 3.6 6.8 3.2
expansion of desertification [7]. According to [85], at least 75% of the area of Iraq has been substantially affected by desertification (Figure 12). This situation forced large number of farmers and fishermen to leave their lands and their villages became deserted [24]. As a consequence, dust storms became more frequent and there was a reduction in cropped areas of 40% between 2007-2009 and 20,000 rural inhabitants left their homes ([65,86].
7. Rehabilitation of the Marshes
The Iraqi marshlands, which are usually known as the Garden of Eden and they cover an area about 15000-20000 km2 in the lower part of the Mesopotamian Plain, where the Tigris and Euphrates Rivers flow (Figure 13). The area is very gentle causing the rivers to meander and split into branches forming the marshes and lakes. The area is composed of thick fluvial sediments carried by the two rivers and deposited due to transgression and regression of the sea [88]. About 18000 year BC the sea level was (120–130)m below its present level and this suggests that the gulf area was dry and Shatt Al-Arab was flowing directly to the Gulf of Oman [89]. The Tigris and Euphrates Rivers were cutting down in the plain -26 to -30 m between Qurna and Fao and probably there were no marshes at that time. The sea level was rising about 14000 years BC onward [89,90, 91]. [89] suggests that the rise of the sea level was faster during (900 – 6000) BP and it was 1 to 2m below its present level [92]. The fauna found in the southern Iraq suggests that the sea reached Amarah [93,94,]. For this reason, Sumerian cities like Ur were located on the cost of the Gulf during the third millennium [95,96]. In the shallow northern region of the Gulf, abundant river sediments were deposited leading to the progression of the delta toward the southeast and this prevented the sea water from entering too far inland and for changing the nature of water from brackish lagoon to fresh water type [97]. During the second and first millennium, the Gulf shoreline was further south and the rivers were running on the surface of the plain and the marshes took their present configuration and zoning. During Hellenistic Period, the southern limit of the Mesopotamian delta was very near its present limit and he sea level is believed to be about one meter lower [98,99]. Miner events took place onward and it should be mentioned; however, that the marshes were bigger in their size relative to its area now [89].
This area was inhabited since the dawn of civilization by the Sumerian more than 6000 BP (Figure 14) [100,101]. It was considered among the largest wetlands in the world and the greatest in west Asia [61,88]. It supported a diverse range of flora and fauna and human population of more than 500000 persons and is a major stopping point for migratory birds and about 60% of the fish consumed in Iraq comes from the marshes.
The marsh area can be divided into three sub areas. These are Al-Hammar Marsh, Qurnah Marshes and Huweizah (Central) Marsh. Al-Hammar marsh is situated south of the River Euphrates and it extends from Nasiriyah in the west to the outskirts of Basrah on Shatt Al-Arab in the east and it is bordered by a saline lakes and sand dunes belt from the south. The marsh area covers approximately 2.8x10³km2 of permanent marsh and lake, expanding to over 4.5x10³km2 during periods of seasonal and temporary inundation during the 1970s. The maximum depth of the water is from 1.8 to 3 m. The surface area is approximately 120km long and 25km wide. The source of the water is mainly from the River Euphrates and sometimes a considerable amount of water from the Tigris River, overflowing from the Qurnah Marsh, also nourished the Al-Hammar Marsh and groundwater recharge
is another source.
The Qurnah marshes are bounded by the Tigris River to the east and the Euphrates River to the south, the area is roughly delimited by a triangle between Nasiriyah, Qalat Saleh and Qurnah. It covers an area of about 3000km2;during the seventies. The sources of the water are mainly the Tigris River. Its area is covered with tall reed beds that are intercepted with large depressions. At its northern fringes, there are dense networks of distributaries deltas were the sites of extensive rice cultivation.
The Central or Huweizah Marsh lies to the east of the Tigris River, straddling the Iran-Iraq border and it extends for about 80km from north to south, and 30km from east to west, the marshes covers an approximate area of 2.35x10³km2. The Kharkeh River feeds the Iranian part of these marshes and in Iraq, two main distributaries departing from the Tigris River near Amarah, known as Al-Musharah and Al-Kahla. The southern part of these marshes is seasonal, while the northern and central parts are permanent. The latter had moderately dense vegetation, alternating with open stretches of water and the water depth in these parts may reach 6m.
During the seventies there was attempt to dry the marshes for oil exploration purposes. After the Gulf War I, the Iraqi Government began to drain the marsh lands (Figure 14). The purpose was the troops can move in that area and perhaps to get rid of the marsh dwellers due to the fact they participated in appraisal against the government in 1991 [102]. They also used the water to block the advances of the Iranian troops during the Gulf war. Five major drainage projects were executed to prevent water from the Tigris and Euphrates Rivers from reaching the marches. Then, the army launched a major attack against the dwellers in the marshes using artillery, mortar and ground attacks and the area was highly contaminated by army munitions and poison gas [88]. Two third of the area was not receiving any water input since 1993 and at 2000 only 10% of the marshes remained (Figure 15). As a result, the local inhabitants left their land and some animals and plants are extent now. In the dried area, the government implemented many agricultural projects to change the environment. These projects covered an area of 1920km2 in three governorates (Thi-Qar, Maissan and Basrah).
In 2003, after the collapse of Sadam regime, the government tried to restore the marshes. The process faced number of difficulties such as land use changes, climatic variations and changes, soil and water salinity as well as ecological fragmentation, where many species were affected as well as the marsh dwellers. Only (70 – 75) % of the original marshes’ areas can be restored [88, 103]), which covers 2800,2350, and 2425 km2 of Al-Hammar, Al-Hawiza and the Central marshes, respectively [103]). To do so, the water required is about 12,886 MCM and to improve the quality then about (10 – 16) BCM/ year of water is required [46, 63, 103]. Therefore, this requires international efforts.
Figure 13: Iraqi marshes
https://en.wikipedia.org/wiki/Mesopotamian_Marshes
Figure 14: a) Sumerian clay tablet 5,000-year-old depicts an ancient reed house. b)‘He (Merodach-Baladan, King of Babylon) fled like a bird to the swampland’ and ‘I (Sennacherib, King of Assyria) sent my warriors into the
midst of the swamps … and they searched for five days’. But the King of Babylon could not be found. (703 B.C.). c) Relief showing life in the
Figure 15: The Mesopotamian Marshes A: 1985; B:2000; C: 2002; D: 2004. (source [103]).
References
[1] George A., 2015, The Epic of Gilgamesh, Penguin Books Ltd, London, UK, 314p.
[2] Gleick, P. ,1994. Water, war and peace in the Middle East, Environment Magazine, 39, 6–42.
[3] Roger, P. and Lydon, P. ,1994. eds. Water in the Arab World, Massachusetts, USA: Harvard University Press. University Press, 1994.
[4] Biswas, A.K., ed. ,1994. International Waters of the Middle East– From Euphrates, Tigris to Nile. Bombay, India, Oxford.
[5] Al-Ansari, N. ,1998. Water Resources in the Arab countries: problems and possible solutions, UNESCO International Conference on World Water Resources at the Beginning of the 21st Century 3-6 June, Paris, 1998, 367-376. [6] Al-Ansari, N.A., 2016. Hydro-Politics of the Tigris and Euphrates Basins,
Engineering, 8, 3, 140-172.
[7] Al-Ansari, N.A, 2013. Management of Water Resources in Iraq: Perspectives and Prognoses, J. Engineering, 5,8, 667-684.
[8] Cherfane, C.C. and Kim, S.E. ,2012, Arab Region and Western Asia, UNESCWA. Managing Water under Uncertainty and Risk, UN World Water Development Report 4, Chapter 33.
[9] Verner, D. and El-Mallah, F., 2011. “Adaptation to a Changing Climate in the Arab Countries” MNA Flagship Report. Sustainable Development Department, Middle East and North Africa Region.
[10] Abdullah, A.D., 2016. Modeling Approaches to Understand Salinity Variations in a Highly Dynamic Tidal River: The case study of Shatt Al-Arab River, PhD thesis, UNESCO-IHE Institute for Water Education, Delft, The Netherlands (unpublished).
[11] Tareek AlShaaab, 2017. Interview with the Iraqi Minister of Water Resources, 22nd June, 2017, Issue number 212, year 82. Available at: http://tareeqashaab.com/images/TariqPDF/2017/6/22.pdf
[12] Proyect, L., 2018, Iran`s Water Crisis, Counterpunch, January 10, 2018. Available at: https://www.counterpunch.org/2018/01/10/irans-water-crisis/ [13] FAO (Food and Agriculture Organization of the United Nations), 2003.
Review of World Water Resources by country, Water Reports number 23.Available at: ftp://ftp.fao.org/agl/aglw/docs/wr23e.pdf
[14] World Bank, 1993. Using Water Efficiently Technological Options, World
Bank Technical paper number 205. Available at:
http://documents.worldbank.org/curated/en/614671468766232590/pdf/multi-page.pdf
[15] Wikipedia, 2017. List of countries by freshwater withdrawal. Available at https://en.wikipedia.org/wiki/List_of_countries_by_freshwater_withdrawal [16] Turkish Ministry of Foreign Affairs, 2017. Water: A source of conflict of
http://www.mfa.gov.tr/data/DISPOLITIKA/WaterASourceofConflictofCoopi ntheMiddleEast.pdf
[17] AFED (Arab Forum for Environment and Development), 2009. “Impact of Climate Change on Arab Countries”, ISBN: 9953-437-28-9, http://www.afedonline.org.
[18] IPCC (Intergovernmental Panel on Climate Change), “Climate change 2007a: climate change impacts, adaptation and vulnerability”. Cambridge University Press, Geneva.
[19] IPCC. “Climate Change 2001: The Scientific Basis, Contribution of Working Group I to the IPCC”, Third Assessment Report 2001, Cambridge, UK, Cambridge University Press.
[20] Elasha B. O.,2010. “Mapping of Climate Change Threats and Human Development Impacts in the Arab Region”. United Nations Development Programme, Arab Human Development Report (AHDR), Research Paper Series, 2010. http://www.arab-hdr.org/publications/other/ahdrps/paper02-en.pdf.
[21] Milly, P.C.D., Dunne, K.A., and Vecchia, A.V., 2005. “Global patterns of trends in streamflow and water availability in a changing climate”. Nature, V.438, 17, 347–350.
[22] Al-Ansari, N.A., Abdellatif, M.,Ali, S. and Knutsson, S.,2014a. Long Term Effect of Climate Change on Rainfall in Northwest Iraq, Central European Journal of Engineering, V.4, No.3, 250-263.
[23] Al-Ansari, N.A., Abdellatif, M.,Ezeelden, M.,Ali, S. and Knutsson, S.,2014b. Climate Change and Future Long Term Trends of Rainfall at North-eastern Part of Iraq J. Civil Engineering and Architecture,V.8, 66,790-805.
[24] Al-Ansari, N., Abdellatif, M., Al-Khateeb, M. and Knutsson, S., 2014c. Desertification and Future rainfall trends north Iraq, 8th edition of the international scientific Congress of GIS and geospace applications Geotunis 2014 April 02 to April 06, 2014 Tunis/ Hammamet
[25] Al-Ansari, N.A., Abdulatif, M., Zakaria, S., Mustafa, Y. and Knutsson, S., 2015. Future Prospects for Macro Rainwater Harvesting (RWH) technique in north east Iraq,International Symposium on Energy Challenges and Mechanics, 8-10 July,Aberdeen, UK
[26] Osman Y.; Abdellatif, M.; Al-Ansari, N.A.; Knutsson, S., and Aljawad S.B., 2017. Climate Change and Future Precipitation in Arid Environment of Middle East: Case study of Iraq, J. Environmental Hydrology,V. 25,paper 3, 1-18. [27] Osman, Y., Al-Ansari, N.A., Abdellatif, M., Aljawad, S. B. and Knutsson, S.,
2014. Expected Future Precipitation in Central Iraq Using LARS-WG Stochastic Weather Generator, Engineering ,6, 12, 948-959.
[28] Rosenfeld, F., Y. Rudich, and R. Lahav, 2001. “Desert dust suppressing precipitation: A possible desertification feedback loop”, Geophysics, V. 98, 11, 5975-5980.
[29] World Resources Institute (WRI), 2002. Dry lands, People, and Eco- System Goods and Services: A Web-Based Geospatial Analysis, 2002. http://www.wri.org
[30] IPCC (Intergovernmental Panel on Climate Change), “Climate change 2007b: the physical science basis”. Cambridge University Press, Cambridge.
[31] Dasgupta, S., Laplante, B., Meisner, C. and Yan, J., 2007. “The impact of Sea Level Rise on Developing Countries: A Comparative Study”, World Bank Policy Research Working, Paper 4136.
[32] Global Warming Art License, 2007. “Middle East sea level risks”, Available at:http://www.globalwarmingart.com/wiki/File:Middle_East_Sea_Level_Ris ks_png
[33] FAO (Food and Agriculture Organization of the United Nations), 2002. “The state of food and agriculture “, Food and Agriculture Organization of the United Nations, Rome.
[34] Arnell, N.W., 2004. “Climate change and global water resources: SRES scenarios and socio-economic scenarios.” Global Environmental Change, V. 14, pp. 31-52.
[35] Medany M., 2008. “Impact of Climate Change on Arab Countries,” Chapter 9, In Tolba M.K. and Saab N.W. (eds). Arab Environment – future challenges, Report of the Arab Forum for Environment and Development.
www.afedonline.org/afedreport/english/book9.pdf or
http://www.afedonline.org/afedreport09/Full%20English%20Report.pdf [36] Oweis, T. and Hachum A., 2004. “Water Harvesting and Supplemental
Irrigation for Improved Water Productivity of Dry Farming Systems in West Asia and North Africa, "New directions for a diverse planet”. Proceedings of the 4th International Crop Science Congress, 26 Sep-1 Oct, 2004. Brisbane, Australia. Published on CDROM. www.cropscience.org.au.
[37] FAO (Food and Agriculture Organization of the United Nations), 2009. “Irrigation in the Middle East region in figures – AQUASTAT Survey” 2008 Water Report 34, 2009, http://ftp.fao.org/docrep/fao/012 /i0936e/i0936e08.pdf [38] Hillel, D., 1994. Rivers of Eden: The Strungle for Water and the Quest for Peace in the Middle East, Oxford University Press and Madzini and Wolf, N.Y. [39] New York Times ,2013. Without Water, Revolution, May 18, 2013.
http://www.nytimes.com/2013/05/19/opinion/sunday/friedman-without-water-revolution.html?_r=0 Last accessed August 18, 2015
[40] Al Ansary, K., 2015, Wheat-Importing Iraq Plans to Be Net Grain Exporter by
2017. Blooming Business, 10th June, 2015.
http://www.bloomberg.com/news/articles/2015-06-10/iraq-to-become-wheat-exporter-within-2-years-trade-ministry Last accessed September 8, 2015. [41] United Nations and World Bank, 2003. Joint Iraq Needs Assessment Working
paper. October 2003,
http://siteresources.worldbank.org/IRFFI/Resources/Joint+Needs+Assessmen t.pdf Accessed August 27, 2015
[42] Robertson, C. ,2009. Iraq Suffers as the Euphrates River Dwindles, The
NewYork Times,
http://topics.nytimes.com/topics/reference/timestopics/people/r/campbell_rob ertson/index.html?inline=nyt-per Last accessed August 30, 2015.
[43] Cockburn, P., 2009. As Iraq runs dry, a plague of snakes is unleashed, The Independent, http://www.independent.co.uk/environment/nature/as-iraq-runs-dry-a-plague-of-snakes-is-unleashed-1705315.html Main page, Depletion of the Euphrates flow. http://www .alrroya .com/node/10899
[44] Al-Ansari, N.A. and Knutsson, S., 2011a. Toward Prudent management of Water Resources in Iraq, J. Advanced Science and Engineering Research, V. 1,53-67.
[45] Kamona, H.A., 2003. “The effect of Turkish water policy on Iraq”, AlSabah Iraqi news net, 17/05/2003, Baghdad, Iraq, 2003.
[46] World Bank, 2006. Iraq: Country Water Resource Assistance Strategy: Addressing Major Threats to People’s Livelihoods, Report No. 36297-IQ, Available at http://siteresources.worldbank.org/INTWAT/Resources/Iraq.pdf [47] BBC News, 2012.“Iraq's PM Warns Arab States May Face 'Water War', May
31, 2012, http://www.bbc.co.uk/news/world-middle-east-18262496
[48] AlShaaab, T., 2017. Interview with the Iraqi Minister of Water Resources, 22nd June, 2017, Issue number 212, year 82. Available at: http://tareeqashaab.com/images/TariqPDF/2017/6/22.pdf
[49] Hydropolitic Academy, 2017. New Iran’s Dam reduces water supply in Kurdish border town, 1st July, 2017. Available at:
http://www.hidropolitikakademi.org/en/new-irans-dam-reduces-water-supply-in-kurdish-border-town.html
[50] RUDAW, 2017. New dam in Iran reduces water supply in Kurdish border
town, 24th June, 2017. Available at:
http://www.rudaw.net/english/business/24062017
[51] ESCWA ,Economic and Social Commission for Western Asia, ,2013. Inventory of Shared Water Resources in Western Asia, Salim Dabbous Printing Co., Beirut, Lebanon, 626p.
[52] Issa, I.E., Al-Ansari, N.A., Sherwany, G.,and Knutsson, S., 2014. Expected Future of Water resources within Tigris–Euphrates Rivers basin, Iraq, J. Water Resource and Protection, V.6, No.5,421-432.
[53] Mourad K. A. and Berndtsson R., 2012. Water Status in the Syrian Water Basins, Open J. of Modern Hydrology, 2, 15-20.
[54] Mourad K. A. and Alshihabi, O., 2015. Assessment of future Syrian water resources supply and demand by the WEAP model, Hydrological Sciences J., 61,2,393-401.
[55] FAO, 2012. Syrian Arab Republic Joint Rapid Food Security Needs Assessment (JRFSNA). FAO Rep., 26 pp. [Available online at: http://www.fao.org/giews/english/otherpub/JRFSNA_Syrian2012.pdf
[56] Gleick, P.H., 2014. Water, Drought, Climate Change, and Conflict in Syria, Weather, Climate, and Society,6, 3, 331-340.
[57] Salman M., Mualla W..2008. Water demand management in Syria: centralized and decentralized views, Water Policy, 10,6, 549-562.
[58] ESCWA (United Nations Economic and Social Commission for Western Asia), 2003. Sectoral Water Allocation Policies in Selected ESCWA Member Countries, Report number E/ESCWA/SDPD/2003/13. Available at: http://www.un.org/waterforlifedecade/pdf/2003_unescwa_sectoral_water_all ocation_policies_eng.pdf
[59] Guardian, 2016. Water supplies in Syria deteriorating fast due to conflict,
experts warn. 7th September, 2016. Available at:
https://www.theguardian.com/environment/2016/sep/07/water-supplies-in-syria-deteriorating-fast-due-to-conflict-experts-warn#img-1
[60] Bilen, O., 2000. Turkey and Water Issues in the Middle East (2nd edn). (Ankara: Republic of Turkey,Prime Ministry, Southeastern Anatolia Project Regional Development Administration).
[61] Turkish Ministry of Foreign Affairs, 2012. Water Issues between Turkey, Syria and Iraq, Department of Transboundary Waters. http://sam.gov.tr/wp- content/uploads/2012/01/WATER-ISSUES-BETWEEN-TURKEY-SYRIA-AND-IRAQ.pdf, Last accessed August 30, 2015
[62] United Nations, 2010. Water Resources Management White Paper, United Nations Assistance Mission for Iraq, United Nations Country Team in Iraq, 20p. https://www.unicef.org/about/execboard/files/DPDCPIRQ2_UNDAF_-_Iraq.pdf
[63] Janabi H., 2010. Water Security in Iraq, Iraqi’s Ambassador to the UN Agencies in Rome l, FAO Meeting, Alexandria, 1 April 2010.
[64] Al-Ansari, N.A. and Knutsson,S., 2011b. Possibilities of restoring the Iraqi Marshes known as the Garden of Eden, Water and Climate Change in the MENA-Region, International Conference, Germany, 28-29 April, 2011. [65] Stockholm International Water Institute (SIWI), 2009. Water Resources in the
Middle East, Background Report to Seminar on Water and Energy Linkages in the Middle East,” p. 9.
[66] Inter-Agency Information and Analysis Unit, 2011. Water in Iraq Factsheet. [67] Investors Iraq, 2009. Water Crisis in Iraq: The Growing Danger of
Desertification.
[68] Iraqi Ministry of Water Resources-Iraq (IMWR), 2010. Annual Report,National Centre for Water Resources Management.
[69] UNICEF Syria Country Office, 2015a. Water, Sanitation & Hygiene Facts & Figures. http://reliefweb.int/report/syrian-arab-republic/unicef-syria-country-office-water-sanitation-hygiene-facts-figures
[70] UNICEF, 2013. Running dry: Water and sanitation crisis threatens Syrian children.
[71] Multiple Indicator Cluster Survey, 2007. IRAQ: Monitoring the Situation of
Children and Women, Final Report.
[72] UNICEF, 2003. “Iraq Watching Briefs, Water and Environmen- tal Sanitation. http://www.unicef.org/evaldatabase/files/Iraq_2003_Watching_Briefs.pdf [73] IMMPW Iraqi Ministry of Work, 2011. “Water Demand and Supply
Municipalities and Public in Iraq: Vision, Approach and Efforts. http://www.mmpw.gov.iq/
[74] World Bank, 2013. Food and Agriculture Organization, AQUASTAT, Renewable Internal, 2013.
[75] Courcy´s Intelligence, 2011. Intelligence Research Group, Desertification in Syria, Future Threats Monitor - 08 November 2011. Available at: http://www.courcyint.com/component/k2/item/49044-desertification-in-syria.html
[76] European Union (EU), 2011. The relationship between desertification and climate change in the Mediterranean, Aston Centre for Europe - Aston
University. Available at:
http://cor.europa.eu/en/documentation/studies/Documents/relationship-desertification-climate-change.pdf
[77] Manshearamani V., 2016. A major contributor to the Syrian conflict? Climate change, PBS NEWSHOUR, March 17, 2016. Available at: http://www.pbs.org/newshour/making-sense/a-major-contributor-to-the-syrian-conflict-climate-change/
[78] ESCWA (United Nations Economic and Social Commission for Western Asia), 1993. The role of ESCWA in Agricultural resource management and conservation and in combating desertification in the region. Available at: http://www.fao.org/docrep/x5322e/x5322e04.htm
[79] Serra G., 2015. Over-grazing and desertification in the Syrian steppe are the root causes of war, Ecologist, 5th June 2015. Available at: http://www.theecologist.org/News/news_analysis/2871076/overgrazing_and_ desertification_in_the_syrian_steppe_are_the_root_causes_of_war.html [80] UNICEF, 2015b. UNICEF plans to reach 2.6 million Syrian children with
winter supplies and cash assistance, News note, 7 December 2015. Available at: https://www.unicef.org/media/media_86455.html
[81] Abahussain A.A.; Abdu A.S.; Al-Zubari W.K.; El-Deen N. and Abdul-Raheemw M., 2002. Desertification in the Arab Region: analysis of current status and trends, J. Arid Environments, 51, 521–545
[82] Shorbagy, M.A. ,1986. Desertification of Natural Rangelands in the Arab World. Agriculture and Water, Vol. 4, pp.68–83. ACSAD, Damascus, Syria (in Arabic).
[83] UN-ESCWA. , 1994. Desertification in the Arab Countries. (FAO/RONE). JCEDAR Meeting of the Arab experts on ‘sustainable Agricultural and Rural Development in the Arab countries’, Cairo, 25–29 September, 1994 (in Arabic).
[84] A Climate for Change, 2012. Water supply and sanitation in Iraq,
[85] Ali, S. M., Qutaiba, A. S., Hussan, M. and Al-Azawi, F. W., 2013. Fluctuating rainfall as one of the important cause for desertification in Iraq, J. Environment and Earth Science, 3, 2, 25-33.
[86] Al-Saidi, A. and Al-Juaiali, S., 2013. THE ECONOMIC COSTS AND CONSEQUENCES OF DESERTIFICATION IN IRAQ, Global Journal of Political Science and Administration, Vol.1, No.1, pp. 40-45, UK.
[87] Sissakian, V., Al-Ansari, N. and Knutsson, S., 2013. Sand and dust storm events in Iraq, J. Natural Science, 5,10, 1084-1094.
[88] FAO (Food and Agriculture Organization of the United Nations), 2005.
Country profile: land use and water resources,
http://www.fao.org/ag/agp/AGPC/doc/Counprof/Iraq/Iraq.html, last access: 24-June-2017.
[89] The Encyclopedia of Earth, “Water profile of Iraq”, 2008. http://www.eoearth.org/article/Water_profile_of_Iraq
[90] Sanlaville, P., 2001. The Deltaic Complex of the Lower Mesopotamian Plain and its Evolution through Millennia, in The Iraqi Marshland: Clark and Magee eds., A human and environmental study, AMAR International Charitable Foundation, 94-109.
[91] Al-Zamel A.Z., 1985. Occurrence and age of submarine peat in the Euphrates-Tigris delta. S.E.P.M. Midyear Meeting. Golden, Colorado, Abstracts 4. [92] Gunatilaka A., 1986, Kuwait and the Northern Arabian Gulf: a study on
Quaternary sedimentation. Episodes 9, 4,223-231.
[93] Lambeck K., 1996. The Persian Gulf since the Last Glacial Maximum: a palaeogeographic reconstruction. Earth Planetary Science Letters, 142, 43-57. [94] Hudson R.G.S., Eames F.E. and Wilkins G.L., 1957. The fauna of some recent
marine deposits near Basra, Iraq. Geol. Mag., 94, 395-398
[95] Macfadyen W.A. and Vita-Finzi C., 1978. Mesopotamia: The Tigris-Euphrates delta and its Holocene Hammar fauna. Geol. Mag., 115, 4, 287-300.
[96] Falkenstein A. and Die E. H., 1951. Sumer, 7, 119-125. [97] Jacobsen T., 1960. The waters of Ur. Iraq, 22, 174-185.
[98] Admiralty Intelligence Division, 1944. The Handbook of Iraq and the Persian Gulf., HMSO London.
[99] Hansman J.F., 1978.The Mesdeltopotamiana in the first millennium. Geogr. Journal, 144: 49-61.
[100] Dalongeville R., 1990. Présentation physique générale de l’île de Failaka. In Calvet Y.and Gachet J., eds, Failaka. Fouilles françaises 1986-1988.
Travaux de laMaison de l’Orient, Lyon,23-40.
http://www.iauiraq.org/documents/1319/Water%20Fact%20Sheet%20March %202011.pdf
[101] UNEP, 2001. The Mesopotamian Marshlands: Demise of an Ecosystem, Early Warning and Assessment Technical Report, 47. (2001).
[102] Roux, G., 1993. Ancient Iraq. Penguin, Hamrondsworth, UK.
[103] Jawaheri, E. A. and Alsahmari, R. A., 2009. Water problems of Iraq and possible solutions”, Journal of Law and Politics, 2, 1, 9-61.
[104] Al-Ansari, N.A., Knutsson, S. and Ali, A., 2012. “Restoring the Garden of Eden, Iraq”, Journal of Earth Sciences and Geotechnical Engineering, 2, 1, 53-88.

![Table 1: Water resources per country and territory (modified from [13]](https://thumb-eu.123doks.com/thumbv2/5dokorg/5504238.143359/3.813.52.767.376.755/table-water-resources-country-territory-modified.webp)
![Table 2: Fresh water withdrawal accessed in June 2008 ([14,15]).](https://thumb-eu.123doks.com/thumbv2/5dokorg/5504238.143359/4.813.58.763.133.659/table-fresh-water-withdrawal-accessed-june.webp)

![Figure 3: Water resources in the Middle East region, total renewable water resources (TRWR) and dependency ratio ([13])](https://thumb-eu.123doks.com/thumbv2/5dokorg/5504238.143359/6.813.116.695.109.584/figure-water-resources-middle-region-renewable-resources-dependency.webp)


![Table 4: Water allocation per capita per year in Turkey, Syria and Iraq (a-[59]; b- b-[60])](https://thumb-eu.123doks.com/thumbv2/5dokorg/5504238.143359/12.813.114.706.531.650/table-water-allocation-capita-year-turkey-syria-iraq.webp)
![Table 6: Total irrigated area (ha) in Syria, in 2011 by traditionally irrigated methods and modern methods ([54])](https://thumb-eu.123doks.com/thumbv2/5dokorg/5504238.143359/13.813.67.754.154.300/table-total-irrigated-syria-traditionally-irrigated-methods-methods.webp)
