Microstructure and tensile property simulation of grey cast iron components
15
0
0
Full text
(2) Nomenclature Upper-case symbols A, B. Stress intensity coefficients.. C. Carbon content, %. Cu. Copper content, %. D. Eutectic cell diameter, m. KC. Maximum stress intensity factor, MPa m. NV. Number of eutectic cells, m −3. Si. Silicon content, %. Y. Shape factor.. Lower-case symbols b0 , b1 ,....., b9. Coefficients for ultimate tensile strength calculation. dT dt 7500C. Cooling rate at 750 0 C , 0 C ∗ s −1. dR dt. Growth rate of the eutectic cell, m ∗ s −1. f aus. Fraction austenite. f white. Fraction carbide. k. Fading coefficient. kg. Growth coefficient of eutectic cell. n. Growth exponent of eutectic cell. t. Time, s. Greek symbols ∆T. Supercooling, 0 C. σ UTS. Ultimate tensile strength, MPa. 3.
(3) 1. Introduction Microstructure and tensile property simulation of grey cast iron has been reported in the literature by e.g. Goettsch1, Leube2, Maijer3 and Fras4. All authors agree on the importance of accuracy of microstructure simulation as a prerequisite condition to predict tensile properties. Microstructure simulation is coupled to the thermal process, and therefore an accurate simulation of the thermal condition in the mould casting environment is crucial. This author has previously reported case studies of complex shaped cylinder head simulation.5, 6. Simulation has been compared to temperature measurements and microstructure investigations on cylinder head castings. The simulated thermal condition was shown to be in very good agreement with measured cooling curves. However, at that time the simulated microstructure and tensile properties were not in good agreement with the real case. The elucidated differences made clear the necessity to improve the understanding of both microstructure formation and its relation to tensile properties. The purpose of the present paper is to present a case study of cylindrical samples and a cylinder head cast in grey iron. The simulation model implements recent developments in the field of eutectic nucleation, eutectic growth and calculation of tensile strength in grey cast iron.. 2. Simulation models The simulations are based on fluid flow and macroscopic heat flow calculations performed by standard simulation software using the Finite Difference Method. The microstructure and tensile property calculation were implemented in MAGMAiron, simulation software which includes kinetic models for calculation of solidification and solid state transformation. The solidification starts with the nucleation and growth of primary austenite. The simulation calculates the austenite precipitation coupled to the phase diagram with respect to the chemical composition. The nucleation of eutectic phase is dependent on the supercooling below the eutectic equilibrium temperature; however it was found that for cast iron inoculated with various commercial inoculants the best model to describe the number of nucleated eutectic cells N V , is rather time dependent. The time dependent decrease of the number of eutectic nuclei is called fading. The fading was calculated according to the following model: NV =. k t. (1). The coefficient k used in the simulation is an inoculant dependent parameter and was reported by Svensson et all7. The eutectic phases grow, following either the stable or the metastable system. The differences between the two systems are related to the supercooling below the eutectic equilibrium and are considered in the calculation. The eutectic cells related to the supercooling ∆T , are considered spherical and the eutectic dR growth rate , is governed by the following equation: dt dR = k g ∆T n dt. (2). 4.
(4) The growth coefficients k g and n were determined8 by inverse kinetic analysis for different inoculants. The reported values were used in the conducted simulations. The equilibrium temperature plays an important roll in the kinetic calculation. In the programme used the equilibrium temperature is calculated from the chemical composition as a function of segregation and back diffusion. The tensile strength σ UTS is calculated by a recently developed model9 based on the stress intensity behaviour in the eutectic cells. The governing relation is given in equation 3.. σ UTS = b0 + b1 ∗ C + b2 ∗ Si + b3 ∗ Cu + b4 ∗ f aus + b5 ∗ f white +. + b6 ∗ D + b7 ∗. KC =. Y=. (4). 1,72 − 1,27 + f white )1 / 3. (5). The coefficients b are given in table 1. b0 b3 b1 b2 b4 322,78. -133,8. (3). A −B + f white )1 / 3. ( f aus. ( f aus. dT + b8 ∗ K C + b9 ∗ Y dt 7500C. 149,16. 23,33. 36,89. b5. bb. b7. b8. b9. 31,19. -25,62. 284,9. 16,64. -93,95. Table 1. Coefficients for calculation of ultimate tensile strength included in equation 3. The stress intensity coefficients A and B are cooling rate and chemical composition dependent and are given in table 2. A B Cu ≥ 0,4%. 10,738. 4,255. dT ≤ 0,7 0 C dt 7500C. 8,6471. 3,9055. dT > 0,7 0 C dt 7500C. 6,7188. 4,4352. Table 2. Coefficients for calculation of maximum stress intensity factors according to equation 4.. 5.
(5) 3. Simulation of experimental conditions An experimental setup originally developed for inverse thermal analysis is presented in Appendix 1. Three cylindrical samples were included, each cylinder surrounded by different cooling media to obtain various cooling rates. The left side cylinder is ø80x70 mm insulated, the middle is ø50x70 mm chilled and the right side cylinder ø50x70 mm was surrounded by sand. The end surfaces of the cylinders were insulated to minimize heat loss through the end surfaces. A mould filling and solidification simulation including the models presented in the previous chapter was conducted for the geometry given in Fig.1. The grey cast iron alloy used in the simulation has the chemical composition given in Table 3. Imaginary thermal points in the simulation have been used to collect simulated cooling data from the different cylindrical samples. The simulated cooling curves at the half height of the cylinders and the central axis of each cylinder are plotted in Figures 1 to 3. The simulated cooling curves are compared to measured ones. The cooling rates obtained by simulation show reasonable agreement with those obtained by measurement. The major parameters included in the tensile strength calculation model are presented in Table 4, where simulated values are compared to measured values. The measured values were reported in reference 9. and correspond to positions between the centre line of the cylinder and the mould interface. The simulated versus measured fraction of primary austenite reveals the largest discrepancy in the procedure presented. This may be due to the simplistic formulation of the austenite growth, but the method of measuring the primary austenite can also contribute to the differences observed. Simulation of the primary austenite is obtained using a kinetic model, but the kinetic parameters are not well known. The eutectic cell diameter and cooling rate at 750 oC is predicted with reasonable accuracy. Finally, the predicted ultimate tensile strength is consistent with the measured values. Appendix 1 includes a colour map of the simulated parameters included in the tensile strength calculation. C Si Mn P S Cr Mo Cu 3,34 1,83 0,56 0,04 0,08 0,15 0,08 0,37 Table 3. Chemical composition of simulated cylinders 1300. 1300 Chill simulated Chill measured. 1100 1000 900 800. 1100 1000 900 800. 700. 700. 600. 600 0. 400. 800. Sand simulated Sand measured. 1200. Temperature [ 0C ]. Temperature [ 0C ]. 1200. 1200. 0. Time [ s ]. 500. 1000. 1500 2000 Time [ s ]. 2500. 3000. Figure 2. Simulated vs. measured cooling curves at the centre line of the sand moulded cylinder. (The time scale of the measured curve is displaced 590 seconds).. Figure 1. Simulated vs. measured cooling curves at the centre line of the chilled cylinder. (The time scale of the measured curve is displaced 400 seconds). 6.
(6) 1300 Insulation simulated Insulation measured. Temperature [ 0C ]. 1200 1100 1000 900 800 700 600 0. 2000. 4000 6000 Time [ s ]. 8000. 10000. Figure 3. Simulated vs. measured cooling curves at the centre line of the insulated cylinder. (The time scale of the measured curve is displaced 1700 seconds) D [µm]. f aus Meas. Chill Sand Insulation. 0,396 0,313 0,436. Sim.. Meas.. Sim.. dT dt 750oC Meas.. [ Cs ] 0. −1. Sim.. 0,310,32 157 110-400 0,9 0,75 0,260,28 775 750-780 0,26 0,28 0,2511501765 0,11 0,15 0,26 1200 Meas. = Measured on tensile bars; Sim. = Simulated. σ UTS [MPa] Meas.. Sim. 368. 378-385. 254. 257-262. 211. 216-218. Table 4. Comparison of measured and simulated parameters in cylindrical samples 4. Cylinder head simulation A complex shaped cylinder head; part of a heavy-truck diesel engine has been simulated. The simulated geometry and gating system is shown in Figure B1 of Appendix 2. The casting is vertically placed in the mould. The mould and core material is assumed to be as quartz sand, bonded by an organic binder. Material properties and boundary conditions are taken from a standard database, except for the major heat transfer coefficients between the cast metal and mould, which are based on measurements and inverse calculations10. The grey cast iron alloy used in the simulation has the chemical composition given in Table 5. The microstructure and tensile properties were calculated according to the procedure presented in chapter 2. Simulated cooling curves obtained in different positions of the simulated casting and internal core are plotted versus measured cooling curves in Figures 4-7.. 7.
(7) 1300. 1300 TC4 simulated TC4 measured. 1100 1000 900 800. 1000 900 800 700. 600. 600. 2000. 4000. 6000 8000 Time [ s ]. 10000 12000. 0. 2000. 4000 6000 Time [ s ]. 8000. 10000. Figure 5. Simulated vs. measured cooling curves in the cylinder head. (The time scale of the measured curve is displaced 1024 seconds). Figure 4. Simulated vs. measured cooling curves in the last solidifying area of the cylinder head. (The time scale of the measured curve is displaced 3020 seconds). 1300. 1200. TC11 simulated TC11 measured. 1200. Temperature [ 0C ]. 1000 Temperature [ 0C ]. 1100. 700. 0. TC9 simulated TC9 measured. 1200. Temperature [ 0C ]. Temperature [ oC ]. 1200. 800. 600. 400. Internal core TC10 simulated TC10 measured. 200. 1100 1000 900 800 700. 0. 600 0. 2000. 4000 Time [ s ]. 6000. 8000. 0. 2000. 4000 Time [ s ]. 6000. 8000. Figure 7. Simulated vs. measured cooling curves in cylinder head. (The time scale of the measured curve is displaced 928 seconds). Figure 6. Simulated vs. measured cooling curves from an internal core of the cylinder head.. C Si Mn P S Cr Mo Cu 3,3 1,97 0,61 0,03 0,09 0,14 0,27 0,85 Table 5. Chemical composition of simulated cylinder head. The thermocouples used for measurements and thereby the measured cooling curves have been influenced by thermally induced strains in the casting / mould environment which was observed by x-ray examination of the casting. Nevertheless, despite the tremendously complex geometry and thermal strains, the simulated thermal behaviour is in good agreement with the measured ones.. 8.
(8) D [µm]. f aus Meas. TP2. 0,38. Bu2. 0,25. Bp2. 0,38. Sim.. Meas.. Sim.. dT dt 750oC Meas.. σ UTS [MPa]. [ Cs ] 0. −1. Sim.. 0,281456 1200 0,095 0,32 0,2651598 1500 0,07 0,28 0,2651237 1500 0,075 0,295 Meas. = Measured on tensile bars; Sim. = Simulated. Meas.. Sim. 281. 260-270. 251. 250. 254. 250. Table 6. Comparison of measured and simulated parameters in cylinder head. Some of the parameters included in the tensile strength calculation are collated in table 6. The properties of a cylinder head cast under identical conditions as those used in the simulation have been investigated. The microstructure and tensile strength of the cylinder head were measured on tensile bars according to Figure B5 in Appendix 2. Even in the case of a complex shaped casting the simulated versus measured fraction primary austenite shows the largest discrepancy. The predicted tensile strength is found to be close to the measured tensile strength. Appendix 2 includes a colour map of the simulated parameters included in the tensile strength calculation.. 5. Conclusions Microstructure and tensile property simulations of complex shaped grey iron components are very sensitive to the microscopic heat flow calculation. Advanced boundary conditions have to be applied to obtain reliable thermal conditions. The kinetic models used to calculate the microstructure formation seem to be more accurate for the graphite-austenite eutectic phase when compared to the primary austenite calculation. However, the tensile strength simulation models introduced in this work include both the primary austenite and the graphite-austenite eutectic phases as important parameters. In spite of the complexity of the microstructure formation and stress and strain behaviour, the model presented predicts the ultimate tensile strength of both simple and complex shaped cast components with satisfactory accuracy. The benefit of the procedure presented here is expected to be the optimization of tensile properties with respect to the functionality of the cast component.. 6. Acknowledgements The present work is part of a research project for development of enhanced material properties in cast iron, supported by the Volvo Powertrain Division Foundry, Daros Piston Rings AB and the Swedish Knowledge and Competence Foundation (KK-stiftelsen), which are gratefully acknowledged.. 9.
(9) 7. References 1. Goettsch D., Dantzig J.: Modelling Microstructure Development in Gray Cast Irons, Metallurgical and Materials Transactions A, volume 25A, May 1994, 1063-1079. 2. Leube B., Arnberg L. Moddeling gray iron solidification microstructure for prediction of mechanical properties, Int. J. Cast Metals Res.,1999, 11, 507-514 3. Maijer D., Cockcroft S.L., Patt W.: Mathematical Modelling of Microstructural Development in Hypoeutectic Cast Iron, Metallurgical and Materials Transactions A, volume 30A, August 1999, 2147-2158. 4. Fras E., Kapturckiewicz W., Burbielko A., López H.F.: Numerical Simulation and Fourier Thermal Analysis of Solidification Kinetics in High-Carbon Fe-C Alloys, Metallurgical and Materials Transactions B, volume 28B, February 1997, 115-123. 5. Diószegi A. and Wessén M., Measurement and simulation of thermal condition and mechanical properties in a complicated shaped cylinder head cast in gray iron.(Modelling of Casting, Welding and Advanced Solidification Processes – IX, 2025 August, 2000, Aachen, Germany, pp. 869-876) 6. Diószegi A.,Millberg A. and Svensson IL, Microstructure evaluation and simulation of mechanical properties of a cylinder head in cast iron (Conference on The science of Casting and Solidification, 28-31 May, 2001, Brassó-Brasov, Romania, pp. 269-277) 7. Svensson I.L., Millberg A., Diószegi A.; A study of eutectic inoculation in gray iron by addition of Fe-Si-Ca-Al-,Sr, Ba, Zr, Ti, RE, and C. (Journal of Cast Metals Research 2003 volume 16, p29-34.) 8. Diószegi A., Evaluation of eutectic growth in grey cast iron by means of inverse modelling. (Journal of Cast Metals Research 2003 volume 16, 301-306.) 9. Attila Diószegi, Vasilios Fourlakidis and Ingvar L Svensson: Microstructure and tensile properties of grey cast iron (Research report 04:1 ISSN 1404-0018, School of Engineering, Jönköping University Sweden, 2004.) 10. Diószegi A.: Microstructure investigation and temperature measurements of a cylinder head cast in grey iron, Volvo Foundry report, 1999. 10.
(10) Appendix 1. Figure A1. Experimental setup of cylindrical samples. Figure A2. Simulated fraction primary austenite. 11.
(11) Figure A3. Simulated eutectic cell diameter. Figure A4. Simulated cooling rate at 750 oC. 12.
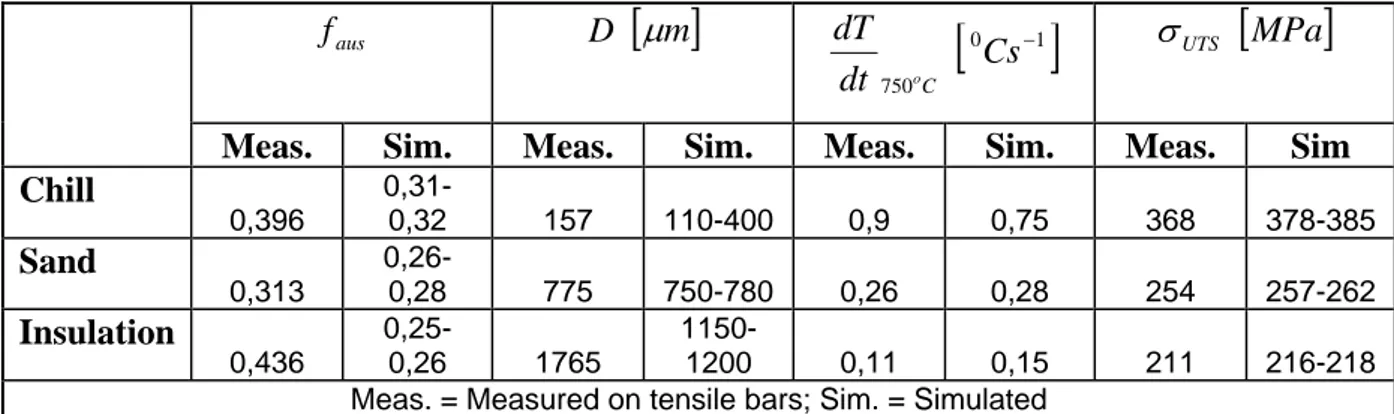
(12) Figure A5. Simulated ultimate tensile strength.. 13.
(13) Appendix 2. Figure B1. Cylinder head with gating system. Figure B2. Simulated solidification time. 14.
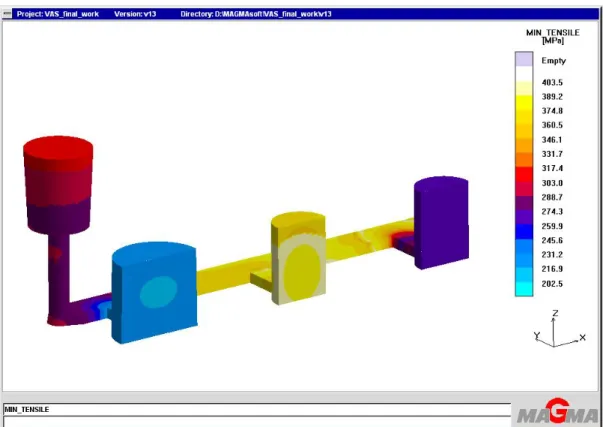
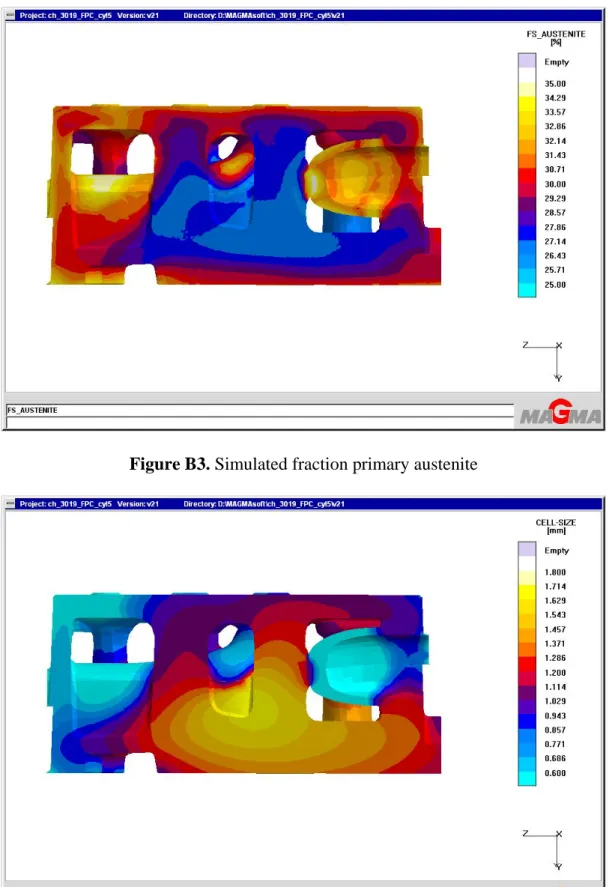
(14) Figure B3. Simulated fraction primary austenite. Figure B4. Simulated eutectic cell diameter.. 15.
(15) Figure B5. Position of samples taken for tensile strength investigation. Figure B6. Simulated tensile strength. 16.
(16)
Figure


+7


Related documents
Recent developments in the field of eutectic nucleation, eutectic growth and prediction of tensile strength in grey cast iron have been implemented into commercial, finite difference
Syftet med studien var att undersöka vilka upplevelser som framkommer kring gruppträning för patienter med en cancersjukdom under pågående eller efter avslutad cancerrelaterad
Kategorin Social på digitala plattformar förklarar hur den vardagliga sociala samvaron med kollegor blir påtagligt förändrad när alla arbetar hemifrån och inte träffas som
Den svenska utvärderingen har väckt ett stort internationellt intresse, dels för att den varit omfattande, dels för de positiva resultaten. Vad man bör beakta är att resultaten
surface structure and composition of the layers; ii) the deuterium retention in the materials after irradiation under different conditions; and iii) the radiation damage pro- duced
This chapter presents general knowledge about solidification, microstructure and shrinkage formation in different cast irons with higher focus on compacted graphite iron..
Att lärarna inte hade fått något stöd eller begränsat stöd tror vi kan vara en faktor till att de använder sig av olika arbetssätt samt att deras synsätt att se på
Shang, Chen och Liao (2006) skiljer på de som söker information om företag eller dess produkter, och de som strävar efter ett mer symboliskt värde som kan stärka deras image
