Investigating the barriers
to increase levels of
automation
PAPER WITHIN Production Systems
AUTHOR: Advait Mehta & Mahalingam Subramanian JÖNKÖPING October 2019
A case study in pre assembly of tap changer
assembly line
Postadress: Besöksadress: Telefon:
This exam work has been carried out at the School of Engineering in
Jönköping in the subject area of Production Systems with a specialization
in Production development and management. The work is a part of the
Master
of
Science
programme.
The authors take full responsibility for opinions, conclusions and findings
presented.
Examiner: Kerstin Johansen
Supervisor: Mahmood Reza Khabbazi
Scope: 30 credits (second cycle)
Date: 2019-10-11
A
BSTRACTThe overarching goal of this thesis is to investigate and explore the barriers that a company would face while increasing the Levels of Automation (LoA), in the preassembly production unit. To achieve the primary goal of investigating the barriers this study takes a threefold approach.
Firstly, the current LoA was measured for the preassembly workstations. This measurement was conducted by incorporating an existing methodology adapted from the literature review known as DYNAMO++ methodology. This method is incorporated such that, the current LoA of the preassembly workstations could be measured and analysed.
The current LoA of the preassembly workstations are analysed to investigate the potential workstations where LoA could be increased, in line with the company’s triggers for implementing automation. For this, experiences of the personnel’s belonging to the operational level of preassembly workstations were incorporated, to find the scope of improvements for increasing the LoA. Additionally, the company’s triggers for implementing automation was investigated from the managerial level. The research questions were answered by adapting an explorative, single case study method. Additionally, four types of data collection techniques were used, such as – interviews, focus groups, observations, and document analysis. Subsequently, source triangulation was adapted to analyse the data collected; to develop a comprehensive understanding of the barriers identified.
Finally, the barriers faced by the company to increase LoA are identified by considering the implications that the improvement opportunities would impose upon the production systems environment.
The identified barriers were then categorised further based on factors that exist internal as well as external to the production systems environment.
The barriers identified in this study highlights various factors that the management must consider beforehand while initiating automation decisions in future automation projects in the preassembly area. Regardless of the barriers faced by the company, there are more opportunities to improve manufacturing processes through automation technologies. This thesis contributes to the knowledge of the factors that restrain the implementation of automation technologies and how companies could deal with it.
Keywords
Level of automation, DYNAMO method, Task allocation, Task Allocation, Triggers
for automation, Functional layout.
CONTENTS
1
Introduction. ... 8
1.1 BACKGROUND ... 8
1.2 PROBLEM DESCRIPTION... 9
1.3 PURPOSE AND RESEARCH QUESTIONS... 10
1.4 DELIMITATIONS ... 10
1.5 OUTLINE ... 12
2
Theoretical background ... 13
2.1 PRODUCTION SYSTEMS. ... 13
2.1.1 Types of production system layouts ... 13
2.1.2 Make-To-Order (MTO) ... 14
2.2 AUTOMATION. ... 14
2.2.1 Automated production systems. ... 15
2.2.2 Triggers for automation technologies in preassembly part production systems. ... 17
2.2.3 Why to automate? ... 18
2.3 TASK ALLOCATION. ... 18
2.3.1 Types of Task Allocation: ... 19
2.4 LEVELS OF AUTOMATION. ... 20 2.5 DYNAMO METHOD ... 22 2.5.1 PHASE 1 – PRESTUDY. ... 24 2.5.2 PHASE 2 – MEASUREMENT. ... 25 2.5.3 PHASE 3- ANALYSIS. ... 27 2.5.4 Phase 4- IMPLEMENTATION. ... 29
2.5.5 Barriers faced in increasing levels of automation. ... 30
3
Method and implementation ... 33
3.1 STRUCTURAL APPROACH. ... 33
3.1.1 Connections between the research questions and research method. ... 33
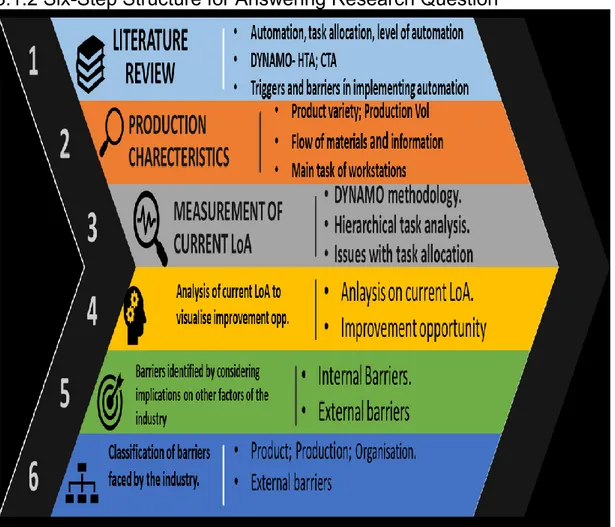
3.1.2 Six-Step Structure for Answering Research Question ... 33
3.2 RESEARCH METHOD ... 36
3.2.1 Research philosophy. ... 36
3.2.2 Research purpose. ... 36
3.2.3 Research approach. ... 37
3.2.4 Case study. ... 39
3.3 DATA COLLECTION TECHNIQUES... 41
3.3.2 Interviews. ... 41
3.3.3 Focus groups. ... 44
3.3.4 Observations... 45
3.3.5 Analysis of internal documents. ... 48
3.3.6 Preassembly data. ... 48
4
Findings and analysis ... 50
4.1 DESCRIPTION OF THE UC TYPE TAP CHANGERS MANUFACTURING UNIT. ... 50
4.1.1 Resistance assembly. ...50
4.1.2 Diverter switch assembly. ... 51
4.1.3 Diverter switch housing assembly. ... 52
4.1.4 Tap selector assembly production unit. ... 52
4.1.5 Final assembly and testing unit. ... 52
4.1.6 UC Preassembly production unit. ... 53
4.2 PRODUCTION CHARACTERISTICS OF PREASSEMBLY PRODUCTION. ... 54
4.2.1 Demographics of the work organisation: ... 55
4.2.2 High product Variety ad Low Volumes: ... 56
4.3 EVALUATION OF THE CURRENT LEVELS OF AUTOMATION (LOA). ... 57
4.4 ANALYSIS OF THE CURRENT LOA TO GENERATE POSSIBLE SOLUTIONS FOR INCREASING AUTOMATION LEVELS IN THE PREASSEMBLY PART PRODUCTION AREA. ... 61
4.4.1 Findings and analysis of Improvement opportunity at workstation 1 (tap selector assembly). ... 61
4.4.2 Findings and analysis related to Measurement at workstation 4 Cylinder preassembly. ... 66
4.4.3 Findings and analysis related to Measurement at workstation 2 (Diverter switch housing preassembly). ... 71
4.4.4 Findings related to Measurement and analysis at workstation 3 and workstation 6 Diverter switch housing preassembly ... 73
4.5THE BARRIERS FACED BY THE INDUSTRY WAS IDENTIFIED BY VISUALISING THE SUGGESTIONS FOR IMPROVEMENTS IN THE PRODUCTION AREA TO SEE WHAT EFFECT IT HAS ON OTHER ASPECTS OF THE PRODUCTION SYSTEMS ENVIRONMENT. ... 75
4.6CLASSIFICATION OF THE BARRIERS FACED BY THE INDUSTRY. ... 77
5
Discussion and conclusions ... 79
5.1 DISCUSSION OF METHOD ... 79 5.2 DISCUSSION OF FINDINGS ... 81 5.2.1 Discussions on RQ1- ... 81 5.2.2 Discussions on RQ2 ... 82 5.2.3 Discussions on RQ3- ... 85 5.3 CONCLUSIONS ... 86
6
References ... 88
7
Search terms ... 92
8
Appendices ... 93
8.1 APPENDIX 1. INTERVIEWS. ... 93
Opening questions related to work experience: - ... 93
Questions related to strategic goals and decision making in the production system. ... 93
Questions related to competitive priorities (external factors that affect automation decisions). ... 94
Questions related to Internal factors that affect the use of automation technologies. ... 94
Questions related to production characteristics at preassembly (Förmontage) production unit of the tap changers. ... 95
Questions related to the organisational factors that affect the use of automation technologies. ... 95
Questions based on other external factors that affect automation decisions. ... 95
Opening questions related to work experience: - ... 97
Questions related to Internal factors that affect the use of automation technologies. ... 97
Questions related to the organisational factors that affect the use of automation technologies. ... 98
Opening questions related to work experience: - ... 99
8.2 APPENDIX 2-FOCUS GROUPS ... 100
Research goals- ... 100
Respondent profiles- ... 100
Topics to cover ... 100
Focus group schedule. ... 100
Purpose of the focus group session. ... 101
Disclosures pertaining to data collection methods. ... 101
Prerequisites for discussions. ... 101
Question guides related to challenges and perceptions. ... 101
8.3 APPENDIX 3- TABLES ... 101
LIST OF FIGURES
Figure 1 A Perspective on the Production System (Bellgran & Säfsten, 2010) ... 14
Figure 2: Human implementation task may be full of mission fulfilment or information and control tasks (Williams & Li, 1999). ... 20
Figure 3 Triggers for changing the current assembly system internal or external (Fasth & Stahre, 2008). ... 24
Figure 4 Identification of subtasks in the production flow of HTA. ... 26
Figure 5 The Square of Possible Improvements (Fasth & Stahre, 2008) ... 28
Figure 6 Task optimisation SoPI (Fasth & Stahre, 2008) ... 29
Figure 7 Operation optimisation SoPI (Fasth & Stahre, 2008) ... 29
Figure 8 Six step structure for answering research question ... 33
Figure 9 UC type tap changers manufacturing unit. ...50
Figure 10 : step 1 of plusminusribba assembly (preparatory step). ... 61
Figure 11 Preparatory step Valjare C (YUMI cobot application) ... 62
Figure 12 YUMI Cobot. ... 63
Figure 13 Press operation for plusminusribba. ... 64
Figure 14 Visual representation of the suggested press. (Dongguan Fityou Robot Automation Co., Ltd.) ... 64
Figure 15 Visual representation of the suggested press. ... 65
Figure 16 Arranging skärmbricka on contacts. ... 67
Figure 17 mounting skärmbricka on cylinder ... 67
Figure 18 holding the copper contacts with skarmbricka on cylinder. ... 68
Figure 19 lifting and LoAding cylinder with a hoist ... 68
Figure 20 allignment of cylinder on press. ... 68
Figure 21 mounting the correct press tool. ... 68
Figure 22 press operation on cylinder. ... 69
Figure 23 manual lever for sliding the press base. ... 69
Figure 24 Basic visual representation of SPM improvement for Workstation 2 ... 72
Figure 25 circlip insertion ... 73
Figure 26 Exploded view of circlip insertion fixture... 73
List of Tables
Table 1 Depicts the common triggers for automation ... 17
Table 2 LoA scales for computerised and mechanised tasks within manufacturing (Frohm, Stahre, & Winroth, 2008) ... 21
Table 3 DYNAMO++ four phases with twelve steps. (Garnell, Frohm, Bruch, & Dencker, 2007); (Frohm J. , 2008). ... 23
Table 4 Dynamo++ overview (Fasth, Stahre, & Dencker, 2008) ... 23
Table 5 Total no. of components and avg. volume/batch ... 56
Table 6 Physical and cognitive LoA of plus-minus ribba ... 58
Table 7 Physical and Cognitive LOA of gaffelarm ... 58
Table 8 Physical and Cognitive LoA of Koppling ... 59
Table 9Physical and Cognitive LoA of Govvaljarcylinder ... 59
Table 10 Physical and Cognitive LoA of Isoleraxel ... 60
Table 11 Physical and Cognitive LoA of Kort lank ... 60
Table 12 Table depicting Current LoA and Future LoA for pre-assemblies in plusminusribba and valjare C. (YUMI improvement) ... 62
Table 13 Table depicting Current LoA and Future LoA for pre-assemblies in plusminusribba. (Fixtures with sliding interpolation improvement) ... 65
Table 14 advantages of implementing improvement opportunity 1 ... 67
Table 15 Name of the components with no. of tool changes and steps involved in fixture changes ... 71
Table 16 The barriers faced by the industry was identified by visualising the suggestions for improvements in the production area to see what effect it has on other aspects of the production systems environment ... 75
Table 17 Classification of barriers faced by the industry. ... 78
Table 18 Current and Future LoA for improvement 1 in station 1 ... 83
Table 19 Current and Future LoA for improvement 2 in station 1 ... 83
Table 20 Current and Future LoA of improvement in station 2 ... 84
Table 21 Current and Future LoA of improvement in station 3 ... 84
Table 22 Current and Future LoA of improvement in station 4 ... 85
List of Abbreviations
Cobot -Collaborative robot COG- CognitiveCTA-Cognitive Task Analysis
DYNAMO Project - Dynamic Levels of Automation for Robust Manufacturing Systems Project EOQ-Economic Order Quantity
ERP- Enterprise Resource Planning systems ETO-Engineering To Order
HTA-Hierarchical Task Analysis LoA- Level(s) Of Automation
(LoAmin)- minimum Level of Automation (LoAmax)- maximum Level of Automation
MABA-MABA- man are best at and machine are best at MTO- Made To Order
Mech- Mechanical
NCR- Non-conformity report; NCR logsNon-conformity report PPC- Production Planning and Control
PLC- Programmable Logic Controller. SOP’s- Standard Operating Procedures SoPI-Square of Possible Improvements SPM- Special Purpose Machine
1
Introduction.
1.1 Background
Technological advancements in the field of manufacturing operations and processes have led to automation in industries. Automation can be defined as the work or functions done by machines or robots usually supported by computers systems; which were earlier carried out by human beings (Parasuraman R. , Sheridan, Fellow, IEEE, & Wickens, 2000).
Throughout history, automation has proven to be an efficient way to achieve cost-effective production in various industries (Satchell, 1998). Apart from eradicating repetitive, tedious and hazardous tasks; automation could also contribute towards improving production quality, productivity and reducing production costs simultaneously (Chinniah & Bourbonniere, 2006). Due to competitive global markets from low wage and labour-intensive countries, industrial markets with high wages are facing intense pressure to reduce production cost (Flegel, Heinrich, 2006). During such conditions, shorter product lifecycles are propelling manufacturing industries in developed countries to move towards automation (Hitomi, 1994). In recent times industries facing higher demands corresponding to increased product variety and shorter life cycles, automation has aided manufacturing companies to adopt greater flexibility by providing faster time to market along with high levels of customisation (Sharma, 2011).
Appropriate implementation of automation in manufacturing systems could be successfully achieved when the physical and cognitive workload on the labour is replaced by machines (Groover, 2001; Sheridan, 2002, as cited in Säfsten, Winroth, & Stahre, 2007). Such that, implementation of automation leverages the skills of operators in line with their physical and cognitive capabilities (Chung, 1996).
To optimise the full potential of humans and machines in a manufacturing system the interaction between them must be well understood, this requires a more human-centred ideology that deals with effects of technology in the context of human issues (Säfsten, Winroth, & Stahre, 2007, as cited in Chung, 1996). To strike a right balance in the task allocations between humans and machines the concept of Levels of Automation (LoA) should be well understood because, lower levels of automation will lead to ‘under-automation’ whereas, on the other hand, higher level of automation will lead to ‘over automation’ (Säfsten, Winroth, & Stahre, 2007).
According to (Satchell, 1998) the level of automation can be defined as “Distribution of task allocations between humans and machines with different degrees of human involvement” (Satchell, 1998). The concept of levels of automation within the context of task allocation between humans and machines was more accurately defined by (Frohm, Stahre, & Winroth, 2008) as “the allocation of physical and cognitive tasks between humans and technology, described as a continuum ranging from totally manual to totally automatic (Frohm, Stahre, & Winroth, 2008).” Low levels of automation may lead to less utilisation of the manufacturing systems resources; whereas high levels of automation would interfere with the upcoming demands on the production systems (short lead times, high customisation) which will eventually lead to increased cognitive requirement on the operator to manage such high levels of information (Fasth, 2012). Pointing to the conclusion that the measurement of the levels of automation must be carried out systematically with the use of correct methods and tools that comply with the strategic goals of the industry.
The ‘DYNAMO’ project (Dynamic Levels of Automation for Robust Manufacturing Systems); therefore, the acronym ‘DYNAMO’ - financed by the Swedish Foundation of Strategic Research (Lindström & Winroth, 2010). Further research in the DYNAMO project led to the development of a systematic method called DYNAMO++ to measure and asses the levels of automation that could be applied in an industrial context (Garnell, Frohm, Bruch, & Dencker, 2007). The researchers in this thesis have adopted the modified DYNAMO++ method developed by (Garnell, Frohm, Bruch, & Dencker, 2007) within the context of the ‘preassembly part production’ area of the focal company; with an aim of- measuring the current levels of automation; and thereby asses the possibilities to improve the level of automation in the preassembly part production area of the focal company. Once the suggestions for increasing the levels of automation was formulated by incorporating experiences of the production personnel’s; the researches in this thesis, has thereby taken a qualitative approach applying these suggestions for improvement in the manufacturing systems context; to eventually investigate the barriers that the focal company would face in the effort to increase the levels of automation.
1.2 Problem description.
It has led to a pre-disposed notion amongst managers to invest in automation with a view of reducing labour cost and improving productivity along with all other benefits of automaton mentioned above (Majchrzak, 1988). However, this is not always the case; implementing automation does not necessarily live up to the expectations and instead cause more disturbances, eventually causing the automation efforts to fail, which places the decision regarding automation in a grey area among managers (Fasth, Stahre, & Dencker, 2008). Which stems from the fact that the evaluations/assessment regarding the factors backing up such automation decisions is based on informal and unstructured interpretations, rather than facts (Fasth & Stahre, 2008; Säfsten & Aresu, 2000; Bellgran & Säfsten, 2005, as cited in Åsa & J.Stahre, 2013).
The focal company appointed the researchers to conduct a study in their preassembly areas, to systematically investigate the ‘barriers’ that the industry might face, if they decide to improve levels of automation in their preassembly production area.
Therefore, before initiating the efforts to increase the level of automation, as a prestudy, the focal company needed to first asses their current levels of automation. Then, based on the assessment of the current levels of automation, various suggestions could be developed to increase the level of automation. Eventually, to achieve the primary goal of this study which is- to perceive the barriers that the focal company would face while increasing the level of automation, quantitative as well as qualitative approach must be taken to introduce the suggestions of improvement in the context of part preassembly area, to figure out the constraints that such improvement opportunities would impose on the other production-related factors of the manufacturing systems environment.
1.3 Purpose and research questions
The purpose of this study is to investigate the barriers faced by the production unit while improving LoA. To investigate the barriers to improve LoA, this study answers three research questions-
• RQ1- What are the current levels of automation in the
preassembly part production?
This research question aims to measure the current Levels of Automation in the preassembly part of production areas. This measured Level of Automation would then act as a foundation above which, the level of automation could be increased/improved.
• RQ2- What could be the desired Level of Automation in the
preassembly part production according to the focal industry’s triggers for implementing automation?
This research question aims to analyse and develop the level of an extent that would be feasible for the focal industry to advance while making decisions regarding automation, such that the automation efforts would be justifiable corresponding to the preassembly systems capabilities.
• RQ3- What are the foreseeable barriers that the focal company
would face to increase the Level of Automation in the preassembly part production areas?
This research question aims to qualitatively asses the barriers that increasing the Level of Automation would impose on the manufacturing environment of preassembly part production. This research question would be answered by source triangulation techniques that- qualitatively investigate the implications, increasing the levels of automation would have on other characteristics of the production unit from a production systems perspective.
1.4 Delimitations
This study was conducted within the preassembly workstations that belonged to the UC assembly line. Additionally, the types of components assembled at the preassembly station belonged to a niche category of electrical components that are subjected to extremely high levels of variations (due to customisation) and comparatively low production volumes. Therefore, the results of this study could only be generalised for similar pre-assemblies that produce- intricate preassembly components with a wide variety, low volumes.
This study makes conceptual suggestions in its analysis phase, regarding how current levels of automation could be improved in preassembly workstations. These conceptual suggestions were developed only to gauge the implications it would impose on other aspects of the production systems; and not with the intention of an actual implementation. Therefore, this study also does not consider economic/financial elements such as- investment costs, operating costs, Returns on investment (ROI); breakeven analysis, design aspects for automation such as DFA, prototype,
The DYNAMO++ methodology used to measure current LoA suggests videography as well as time and motion studies to study the operations while measuring LoA. However, owing to the ethical restrictions imposed in this research, the researchers were not permitted to take videos while conducting the studies. Alternatively, the use of an essential internal document known as- Standard Operating Procedures (SOP’s) was used instead to carry out the measurements, which led to estimates being made while judging time parameters for assembly tasks. Additionally, certain(rare) products were not studied as the order cycles for these products was extremely long, which made it very rare to produce within the timespan of this thesis; which could have a considerable impact regarding the findings of this study.
1.5 Outline
Chapter 1: The chapter consists of the background of the study, a description of the
problem, the purpose of the study, formulated research questions and the scope, along with the delimitations of the study.
Chapter 2: This chapter contains the various theories related to the content of the
thesis report; it consists of the theoretical explanation of multiple terms and suggestions as seen in the report for example production systems, automation, levels of automation etc.
Chapter 3: This chapter contains information about the various methods chosen for
the study and how it was implemented. The section also consists of information about the different types of data that was collected during the work and ends with a discussion about validity and reliability.
Chapter 4: This chapter focuses on analysing and presenting the findings obtained
through empirical studies carried out.
Chapter 5: This chapter focuses on discussions of the methods used in this research
2
Theoretical background
2.1 Production systems.
The term production refers to an output of industrial work done, and this is also the definition according to The International Academy of Production Engineering (CIRP) as, any result or output from a collection of industrial work in various fields is called production (Chisholm, 1990). A production system is defined as a set of people, machines and procedures assembled to carry out manufacturing operations or a series of operations for an organisation (Groover M. P., 2008). Some other authors have also defined the production system as a combination of the human workforce and mechanical or technological equipment used to produce an output through a series of industrial procedures (Rösiö, 2012). According to (Groover M. P., 2008) A production system is divided into two subsystems consisting of manufacturing support systems and production facilities where the manufacturing support system consists of set of procedures used by the organization to manage production purposes and to get support for production-related activities (technical and logistic issues), a facility generally refers to the workspace and the equipment used for production purposes. He also links the human perspective into production systems which are responsible for operating both the facilities and the manufacturing support system. (Hubka & Eder, 1984) have also defined and divided production systems into various subsystems consisting of human, technical, information and management systems.
2.1.1 Types of production system layouts
According to (Slack, Chambers, & Johnston, 2010) any production system would have a design and the primary purpose of it would be to determine the flow of information and raw materials throughout the plant form inbound till outbound. Any production layout would comprise of equipment’s or machines and operators to work with it. An excellent production layout would lead to shorter throughput times which would eventually lead to less work in processes, thus reducing the capital associated with it (Ohlager, 2007). He has further added that the primary purpose of a layout is to utilise high capacity and to have high flexibility. (Slack, Chambers, & Johnston, 2010) has classified layout into 4 different types depending on how the materials and information is transferred:
Fixed Layout: Fixed layout is used for producing products that are generally very heavy or large to produce like ships and aircraft, which are very hard to move at initial stages. Usually, in this layout, the equipment and tools are generally moved or transported to the product along with the operators (Ohlager, 2007). Generally, the skill level of the operator is typically high, and the demand for the products made in the fixed layout is very low (Slack, Chambers, & Johnston, 2010).
Functional Layout: Functional layout consists of machines or equipment that has the same function, and the same processes are carried out on a product. This layout creates a very flexible production operation sequence and is more suitable for producing products with a wide variety. One more feature of this layout is it can be used to make products that have very high or varying operating times. The operators working in this layout are generally considered to be highly skilled and can be flexible with their skills related to Production Planning and Control (PPC) (Slack, Chambers, & Johnston, 2010).
Product Layout: In process layout, the production processes are more
product-oriented and structured in a way where each product variant/type has its own flow, and a set or sequence of operations carried out on it. This layout is usually designed for a single product type or single product group where demand is generally high. It is also suitable for products with limited variants (Ohlager, 2007). This layout has very less
flexibility; if a different product is to be produced then, the entire machine or equipment setup must be changed to suit the process according to the component produced. Generally, this layout has an advantage of reducing the throughput times and work in process (Slack, Chambers, & Johnston, 2010).
Continuous Layout: In a continuous layout, the products are made or delivered in a continuous flow manner without any intrusion. The production steps in this process are generally interconnected, and this layout is prefered for products made in very high volume and where the product variety is very limited or where there is no variety at all. Industries which prefer these kinds of layouts are paper industry, breweries and gasoline production companies (Ohlager, 2007).
2.1.2 Make-To-Order (MTO)
In the recent time, there is an increase in customizability of the products as well as there is a demand for a wide variety of products which has eventually lead the industries to opt for Made-To-Order MTO production policy to satisfy the customers and to maintain an acceptable level in inventory (Altendorfer, 2014). The focal company’s preassembly area follows a Make to Order MTO setup where the production volume is generally medium or high along with very high inventory. The labours skill and flexibility is low as their work methods are generally routine. (Rahman Abdul Rahim & Shariff Nabi Baksh, 2003).
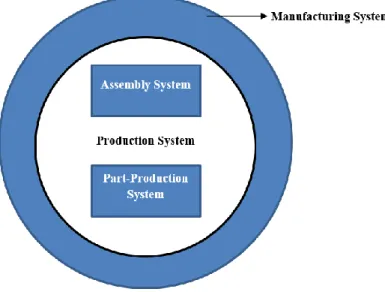
According to (Bellgran & Säfsten, 2010) any production system is built up in a hierarchical perspective where the production system is a subsystem to a manufacturing system. They have also explained the difference between these systems. A manufacturing system consists of a list of operation starting form planning the raw materials to choosing production processes till managing and marketing the finished products; whereas a production system focuses only on making and designing the products. Further, the production system is classified into two subsystems consisting of an assembly system and part production system(see Figure 1 below).
Figure 1 A Perspective on the Production System (Bellgran & Säfsten, 2010)
2.2 Automation.
The way in which automation is perceived among manufacturing industries would continuously alter with time (Parasuraman & Riley, 1997). Therefore, it is challenging to define automation in A generic sense, due to the wide range of contexts and
Automation involves three main functions, Automatic operations; automatic processes; and automated handling of materials and information. The meaning of ‘automation’ also resonates with ‘mechanisation’. Mechanisation could is defined as the replacement of physical work functions of humans by machines (Groover M. P., 2019). According to him, the interrelations between the terms ‘mechanisation’ and ‘automation’ could be defined as follows-
“The application of machines to tasks once performed by human beings or, increasingly, to tasks that would otherwise be impossible; although the term mechanisation is often used to refer to the simple replacement of human labour by machines, automation generally implies the integration of machines into a self-governing system. (Groover M. P., 2008)”
From the above definition, it could be observed that automation is a function of mechanisation combined with an amalgamation of the ability to sense the environmental factors by using artificial sensors (Frohm, Stahre, & Winroth, 2008); (Parasuraman & Sheridan, 2005).
Historically, automation has not only relieved humans from repetitive, tedious, hazardous, and time-consuming tasks (Parasuraman & Mouloua, 1996). Throughout its evolution, automation has also proved to be an efficient tool for achieving a cost-effective production process in manufacturing units (Satchell, 1998).
According to (Frohm, Stahre, & Winroth, 2008) The development of achieving cost-effective production could be attributed to that fact that, today automation has not just freed the human in terms of physical/labour capabilities, but has also relived humans in terms of imparting of cognitive capabilities such as decision making, visualisation and interpretation of information (Frohm, Stahre, & Winroth, 2008). Therefore, in today's frame of reference, design of automated systems should be focussed on both the mechanisation aspects as well as cognitive aspects, this requires a human-centred ideology which allows the design of automated systems within manufacturing to optimise between the task allocation between humans and machines.
2.2.1 Automated production systems.
(Groover M. P., 2008) has presented three main types of automation, namely fixed automation, programmable automation and flexible automation. According to the same author –
Fixed automation is also denoted as hard automation since this type utilises the equipment to do a specific operation. The operation may be a simple rotatory motion, and the main drawback is the making changes in the design of the product made in these machines. But when it comes to programmable automation and flexible automation, both of these have high flexibility when it comes to the design of the products. Both of these automation types accommodate the configuration of different types or a variety of products, but the only drawback is the production rate is low compared to fixed automation. These types of automation are suitable for batch production, where the investment cost is generally high in these types of automation. Flexible automation consists of CNC machines and a programmable automation consist of industrial robots.
There is one more type of automation, namely integrated automation apart from the types explained by Groover (2008). In an integrated automation process, the entire manufacturing system is entirely controlled by computers and the transfer of information is completely digital. This system would use a combination of fixed automation and flexible automation where it consists of both robots and special
purpose machines in the production line along with this it also consists of automated storage and retrieval system (Power Electronic-EE IIT, 2010).
2.2.2 Triggers for automation technologies in preassembly part production
systems.
Table 1. Depicts the common triggers for automation.
Triggers. Authors.
• Reduction in operating costs. • Reduction in repetitive tasks. • Improved operator safety.
(Groover M. P., 2008); (Tangen, Axelson, Dencker, & Gröndahl, 2008); (Ariss, Raghunathan, & Kunnathar, 2000)
• Competitive advantage. (Ohlager, 2007); • Quality.
• Costs.
• Deliverability. • Flexibility.
(Tangen, Axelson, Dencker, & Gröndahl, 2008) (Ariss, Raghunathan, & Kunnathar, 2000)
• Technological feasibility. • Reduction in
unpleasant/hazardous tasks.
(Wickens, Hollands, Banbury, & Parasuraman, 2013);
• Faster production ramp-ups. (Meredith, 1987).
• Improved productivity. (Zairi, 1993) ; y (Ariss, Raghunathan, & Kunnathar, 2000).
A company would have various triggers for automating their production systems ; (depicted in Table 1 above). According to (Wickens, Lee, Liu, & Gordon-Becker, 2004) automation may felicitate by assisting the humans with difficult or unpleasant task and may also help in performing hazardous tasks, further automation increases human capability and facilitates in technological feasibility. (Groover M. P., 2008) has also argued how automation can help in reducing labour cost, manufacturing time and repetitive tasks, while at the same time increasing the quality, labour safety and productivity. In addition to these, one more main factor that would trigger a company for automating is for the competitive factors which would help in reaching the company’s goals (Ohlager, 2007). Some researchers have said that a company’s automation strategies will be directly connected to its competitive factors, (Tangen, Axelson, Dencker, & Gröndahl, 2008) have broken down companies competitive factors that trigger automation in terms of properties like cost, quality, delivery capability and flexibility.
The common factors, as discussed by most of the authors for a company to automate its production systems, are-
Increased Productivity: Adaptation of automation by companies has an enormous impact on their production systems, automation technology generally aims at improving the productivity of the company. This statement has also been argued by (Zairi, 1993) stating that implementing automation directly improves the overall effectiveness and efficiency of the production system in a company. Apart from this
some other researched have also found that automation technologies might help in reducing the lead time and work breakdown at the same time improving productivity and safety (Ariss, Raghunathan, & Kunnathar, 2000).
Quality Improvement: In the recent trend’s, customers’ demands have driven industries to increase the quality of the products; which forces the company to implement automation technologies as one main task done by these technologies is identifying errors or flaws in the products (Ariss, Raghunathan, & Kunnathar, 2000). The identification is generally made in the design phase itself thus, reducing the unwanted capital in reworks; this statement is also argued by (Zairi, 1993) who says quality has become the main criteria for the companies to implement automation in their production systems. (Kandray, 2010) has pointed out some areas like inventory, production planning and scheduling where automation may improve the quality of the product.
Product Design: Many researchers have found out that implementing automation at the design phase may help in reducing the errors or flaws in products and as well as help in modification or redesigning of the products at a very early stage (Ariss, Raghunathan, & Kunnathar, 2000). According to (Meredith, 1987) time taken during the product’s design phase is generally reduced by using automation technology by testing for structural and engineering aspects of the prototype before its even made. It has been noted that manufacturability of the products, as well as aftermarket maintenance, have found to be enhanced by using automation technologies in earlier phases of product design.
2.2.3 Why to automate?
According to (Frohm, Stahre, & Winroth, 2008) the reasons for why to automate could be broadly viewed from two perspectives, i.e., Industrial perspective and Production systems perspective, wherein the latter consists of a human-centred approach. Because, even though a company implements high-tech automated systems in their production units, there must be a balanced allocation of tasks between humans and automation. Otherwise, just improving the Level of Automation could also mean increased cognitive workload on the operator. Therefore, the main issue of consideration while designing automation within manufacturing systems is not just how to design the best automated production system, but also how to optimise the Task Allocation (TA) between human and automation.
2.3 Task Allocation.
The term task allocation has been defined and explained by various authors over the decades. Initially, the primary strategy of task allocation was determined by (Fitts, 1951) stating that, it is a way to allocate tasks between humans and machines while considering both as a resource of the production system. He also further added that both human and machines are better in each and went on to state that machine is better at doing repetitive tasks, whereas men are better at improvising the existing task (MABA-MABA). Later on, some more researches added to Fitts definition like (Sheridan T. , 1995) incorporated the concept of automation into it and stated that humans should be allocated with the task best suited for them and automation should be allocated with tasks best suited for it. But this definition by Sheridan was counter-argued by (Endsley & Kiris, 1995) stating that if tasks in which machines are better being automated then a human is still needed to monitor it with full situation awareness which in some cases might increase the cognitive workload of the human leading to disturbances in the production system. (Prince, 1985) stated that some activities or set of tasks could be done by both humans and machines working together
each other in doing the tasks rather than splitting each task. (Sheridan T. , 2000) Also supported (Prince, 1985) statement saying, there should be an equal split of tasks between human and machines rather than focusing on one resource alone. In the recent year’s researchers like (Parasuraman & Wickens, 2008) have said that designers are modifying the subsystems to improve the productivity and economic feasibility but overlook the fact that this will lead to overloading/suboptimisation of the valueable human capabilities in the system.
2.3.1 Types of Task Allocation:
Generally, A task carried out in A production system consists mainly of the mechanical or physical task along with cognitive tasks; various authors have split these tasks into multiple levels in terms of mechanical handling and cognitive handing. (Bright, 1958), in his book has allocated the task in 17 different levels in terms of a mechanical scale, where he decides the levels depending on the mechanical task done by the human. In his scale, if the human initiates the control to the system, then it lies between 1-4; if the control is shared between machine and human it lies between 5-8; and if the decision control is fully automated then it lies above level 9. Some other researchers like (Marsh & Mannari, 1981) have used a mechanical scale as well and have divided it into 6 levels where each level goes from a task done manually by a human to the fully automated task done by the computer system. In terms of information scale researches like (Sheridan T. B., 1980 ) have split it into 10 stages where each level denotes how much information is shared by the system to the human. (Parasuraman, Sheridan, & Wickens, 2000) Have also scaled the task in term of information shared by the systems and denoted that information shared must be a changeable factor. A task allocation can also be denoted with a combination of both mechanical and cognitive scales, (Frohm J. , 2008) mentioned that- allocation of tasks between humans and machines varies from being completely manual to completely automatic, so he further split these mechanical and cognitive tasks into 7 levels each and formed a matrix which would give a total of 49 possibilities.
To do this first all, the task and sub-task carried out by the human in a system must be studied according to the Hierarchical Task Analysis(HTA) by (Stanton, et al., 2013), the tasks should be broken down until where the human to machine is responsible on how cognitive and what mechanical activity is need to do the task. Then with this, a cumulative mechanical LoA and cognitive LoA are noted, and a Square of Possible Improvements(SoPI) matrix is formed (Fast-Berglund & Stahre, 2010 ).
2.4 Levels of Automation.
Historically, (Sheridan & Verplank, 1978) provided a detailed explanation regarding the co-operation between humans and computers, concerning the shifting of roles of humans from manual to supervisory control. They introduced a model which encompassed 10 stages in the levels of automation; wherein, they provided an understanding of the variety of co-operative choices depending upon, who can be in control of the operation between humans and computers. These choices were listed down in a model varying from completely manual to completely automatic, giving an analytical description about who can be in control at every stage.
According to (Groover M. P., 2008), Level of Automation from a manufacturing perspective could be defined as the amount of level of engagement of humans, with the focus around machines, which could be either manually operated; semi-automated; or fully automated.
Later on, (Frohm, Stahre, & Winroth, 2008) in line with (Chiantella, 1982)and (Williams & Li, 1999) recognised that tasks related to automation in manufacturing operations could be categorised into two different classes, i.e. Mechanization (physical tasks) and Computerized (cognitive tasks). Wherein, mechanisation tasks are represented by human physical tasks which are involved in mission fulfilment such as- the use of human muscle power or the tasks related to material and energy transformation (see Figure 2, below) (Williams & Li, 1999)and (Frohm, Lindström, & Bellgran, 2005). And, computerisation tasks are represented by information control tasks such as- mental activities related to the human sensory thought process (Williams & Li, 1999).
Figure 2: Human implementation task may be full of mission fulfilment or information and control tasks (Williams & Li, 1999).
(Frohm, Stahre, & Winroth, 2008) suggested that, changes in the levels of automation of tasks involved in manufacturing operations can be done to both, physical as well as cognitive tasks. Increasing the level of automation in physical tasks implies mechanised support; whereas increasing the level of automation in cognitive tasks, implies either the provision of decision support to the operator or to increase the
efficiency of the flow of information; that would eventually support the operator to have better supervisory control over the mechanised tasks.
Table 2 LoA scales for computerised and mechanised tasks within manufacturing (Frohm, Stahre, & Winroth, 2008).
(Frohm, Stahre, & Winroth, 2008)further identified two independent continuums, one of which comprised of mechanical and equipment (physical tasks); and the other consisted of information and control tasks (cognitive tasks); they also provided a model to assess the two-level of automation (LoA) continuums into two seven-step reference scales, each reference scale indicated levels of automation from totally manual to automatic. (see Table 2 above.) and finally concluded that, by assessing the (a) Relevant
minimum levels of automation (LoAmin) (b) Relevant maximum level of automation (LoA max) and (c) Current levels of automation (LoA cur); on both the respective reference scales for each work tasks carried out by humans, machines or both humans and machines; the potential for increasing or reducing the level of automation for work tasks could be gauged in line with the requirements of the study.
The results of such assessments could be applied for improving the levels of automation of manufacturing systems.
2.5 Dynamo method
The ‘DYNAMO’ project (Dynamic Levels of Automation for Robust Manufacturing Systems) therefore, the acronym ‘DYNAMO’ was financed by the Swedish Foundation of Strategic Research (Lindström & Winroth, 2010). Further research in the DYNAMO project in conjunction with the researchers from the project ProAct, led to the development of a systematic method to measure and asses the levels of automation that could be applied in an industrial context (Garnell, Frohm, Bruch, & Dencker, 2007).
The purpose for validation and assessment of the measurement of levels of automation (LoA) was to seek the appropriate levels of automation for balancing the manufacturing systems, with an approach of achieving high effectiveness in improving the levels of automation of manufacturing systems (Garnell, Frohm, Bruch, & Dencker, 2007).
The development, implementation and validation of the DYNAMO methodology presented by (Garnell, Frohm, Bruch, & Dencker, 2007), was based on six case studies conducted from the years 2004 to 2007 wherein, single case studies were adapted sequentially; and was mainly focussed to improving reliability of the existing dynamo methodology, to enhance its applicability over a wide range of industries.
Further research on the DYNAMO methodology led to modifications to the original method, and the revised methodology was known as DYNAMO++; which was developed during the years 2007-2009; and was validated further by assimilating useful information from additional five case studies that was conducted within Swedish manufacturing industries (Fasth, Stahre, & Dencker, 2008) (Garnell, Frohm, Bruch, & Dencker, 2007).
The main modifications included- conducting a value stream analysis (VSA), which was done to gain information regarding the flow of materials and information as well as to gather information regarding time parameters to be studied during the flow. Additionally, video documentation was included to enhance the analysis carried out at the assembly area (Fasth, Stahre, & Dencker, 2008) (Garnell, Frohm, Bruch, & Dencker, 2007).
Table 3 DYNAMO++ four phases with twelve steps. (Garnell, Frohm, Bruch, & Dencker, 2007); (Frohm J. , 2008).
Table 4 Dynamo++ overview (Fasth, Stahre, & Dencker, 2008)
The DYNAMO++ methodology according to (Fasth, Stahre, & Dencker, 2008) (Fasth & Stahre, 2008) (Fasth, 2012) consists of the following.
The DYNAMO++ methodology comprises of 12 steps which are supposed to be carried out in succession; and these 12 steps are further categorised into 4 phases, with 3 steps in each phase. (see above, Table 3 & Table 4)
The first two phases are executed to know the present status of the system to get a clear idea about- current levels of automation, current material flows, current information flows, current production flows/layouts, as well as current resource flows. (see figure 3 below)
Level of automation (LoA) is measured of each task carried out in the area under study with the help of a seven-step reference scale that measures level of automation (LoA) related to- mechanical and equipment (physical) tasks, as well as current levels of automation (LoA) of the information and control (cognitive) tasks.
The last two phases- phase3 and phase 4; are used to develop the levels of automation for the future stage. (see Figure 3 below)
The output analysis carried out from the first two phases; acts as an input for the subsequent two phases, i.e., phase 3 and phase 4.
The first phase, PHASE 1, is called as the ‘prestudy phase’. The second phase, PHASE 2, is known as the ‘measurement phase’. The third phase, PHASE 3, is known as the ‘analysis phase’. And lastly, the fourth phasePHASE 4 is known as the
‘implementation phase’.
Figure 3 Triggers for changing the current assembly system internal or external (Fasth & Stahre, 2008).
2.5.1 PHASE 1 – PRESTUDY.
The main objective of the pre-study phase is to get an overview and initial understanding of the characteristics of the production system under study.
This phase helps the researchers to decide upon the ‘goal functions’ that the study seeks to accomplish; it also helps to get a clear understanding about the ‘triggers for change’; and helps to get a better understanding about the logistical flow of the production system under study (Fasth, 2012).
to perceive the delimitations of the production flow such that, the system boundaries could be set for the measurement (Frohm J. , 2008). For example, ‘The goal of the LoA measurement is to investigate the current levels of automation in the preassembly part production system, and thereby gauge the possibilities to increase the level of automation in the preassembly part production system’.
The prestudy could also involve chalking out a pre-LoA measurement plan to get an idea about the protocols of the measurement; this would also help the researchers to approximately gauge the timeframe required for the study as well as understand the underlying goals of the measurement; during this time other vital information regarding the production flow can also be identified and evaluated such as- the demographics regarding the type of organisation prevalent in the area under study, information regarding the types of machines, and the other vital information regarding the system under study (Frohm J. , 2008).
Step 2- Walk the process.
According to (Frohm J. , 2008), This step is supposed to be conducted on-site. This step involves identification and documentation of the parameters pertaining to the production flow from a company perspective; this step helps the researchers to denote the start and end of the production flow in line with the scope of the study (Frohm J. , 2008).
This step also involves the industry representatives, as it is necessary to run through the measurement steps so that the people in the industry that are directly or indirectly involved in the measurement are well informed about the procedures, objectives as well as the intentions regarding the study conducted. Informing the people is necessary such that they are comfortable to participate in the process, and it also avoids probable biases/Hawthorne effect as the behaviour of the workforce may tend to be different than normal during the study. Once the people involved in the study are well informed, the initial data collection in the industry may commence.
Some of the vital data points for collecting data at this step could be regarding- variants as well as volumes of the products produced, demographics regarding the work organisation, and most importantly the tasks carried out by the machines as well as the tasks carried out by humans (Frohm J. , 2008).
Step 3- Identify and visualise the flow and time parameters (VSA)
Value stream analysis is done in order to collect information related to flow and time parameters such as – a) information flows b) material flows; VSA is carried out to get a visual overview of the different types of flows as well as, to identify the buffers between the production operations (Fasth, Stahre, & Dencker, 2008). The output achieved from conducting the value stream mapping, also helps the researchers to identify the value-added and non-value-added tasks performed in the production systems (Fasth, Stahre, & Dencker, 2010).
2.5.2 PHASE 2 – MEASUREMENT.
The main aim of the measurement phase is to identify-measure, and thereby document the current status of the production systems, in terms of current Levels of Automation, on both cognitive as well as mechanical reference scales stated above (Fasth, 2012). The output achieved at the end of this phase, helps the researchers to document the current levels of automation (LoA) prevalent in the production system under study.
Step 4- Identify the main operations using Hierarchical Task Analysis
(HTA).
According to (Shepherd, 1985) as cited in (Schaafstal & Schraagen, 1992); (Annett, 2003), hierarchical task analysis could be defined as- a method to re-describe the overarching goal of the task, into a set of subordinate goals; supported by a procedural plan, that indicate ‘how’ and ‘in what order’, the subordinate goals must be executed; to achieve the overarching goal of the task.
According to (Fasth, Stahre, & Dencker, 2010) In the context of measuring the levels of automation (LoA); Hierarchical task analysis is carried out by decomposing the value-adding assembly operations into tasks and subtasks to the point it reaches a level where, either ‘human’ or ‘technology’ is accountable regarding- HOW? (cognitive/information and control); and with WHAT? (physical/mechanical and equipment); the task is performed (see Figure 4 below). The HTA is done to comprehend the overall structure of the operations performed, and thereby reasonably differentiate between why the task is performed? And why is the task performed in that specific order?
To decipher the main task as well as the sub-tasks accurately, the use of video recordings was suggested (Garnell, Frohm, Bruch, & Dencker, 2007). It may, however, be a case where, due to ethical/security reasons, the use of video recordings is not possible, the researchers can document repeated observations of the task, supported by documents that contain the standard operating procedures.
Figure 4 Identification of subtasks in the production flow of HTA.
Step 5- Measure Level of Automation (LoA); (mechanical and cognitive).
Once the main tasks, as well as the subtasks, have been disintegrated and documented from step 4, the current levels of automation (LoA), for individual task could be judged by attributing each task to the two 7 -step reference scales i.e. ‘Mechanical and Equipment” LoA; and ‘Information and Control’ LoA (Frohm J. , 2008); (see Figure 4, above)
The ‘judging’ of the LoA for each task could be based on two essential criteria’s, i.e. by questioning- ‘how the task was conducted?’ and ‘what type of interaction between human and machine was involved in the task fulfilment?’; the latter would be more appropriate to be matched with the two reference scales (Frohm J. , 2008).
The judged levels of automation (LoA) on each respective scale could be documented, which would denote the current levels of automation indicated by (LoAcurrent) for each
individual task. By the end of this step, the researchers would be able to obtain the current levels of automation corresponding to the ‘mechanical and equipment’ LoA reference scale as well as ‘information and control reference scale respectively.
Step 6- Documenting the results.
The results obtained from the previous step could be documented and represented through a matrix that encompasses the two reference scales- LoAcognitive on X-axis; and
LoAmechanical on Y-axis respectively, thereby forming a 7-by-7 matrix scale containing
49 types of possible solutions for task allocation (Fast-Berglund & Stahre, 2013). The matrix provides a good representation of the current LoA and acts as a benchmark for discussing the further scope of possible improvements (SoPI) that would help improve the level of automation (Fast-Berglund & Stahre, 2013).
2.5.3 PHASE 3- ANALYSIS.
This phase involves analysing and discussing the current levels of automation, with the operators and production engineering personnel’s onsite, with the aim of estimating the relevant minimum levels of automation as well as relevant maximum levels of automation for each of the observed tasks (Frohm J. , 2008). Thereby predicting the conceptual (future) possible solutions that could be implemented to increase the automation potentials of the observed tasks based on the goals of the measurement. The evaluations carried out in this phase gives an overview regarding when? And how? ; to change the current levels of automation; and thereby perceiving which people and what factors related to the production system would be affected by the changes (Fasth, 2012).
Step 7- Decide the minimum levels of automation (LoAmin); and maximum
levels of automation (LoAmax); for the identified operations (workshop).
The results documented in step 6 regarding the current levels of automation are discussed in detail with the production operators and the production engineering team. Such discussions aim to estimate the relevant minimum LoA as well as relevant maximum LoA that could be possible, for each of the work tasks measured.
The respondents for the discussions must be carefully selected, as they act as vital inputs in this stage. For example, the production operators and the production engineers are chosen as the respondents for the discussion, as they have a better knowledge about the tasks being observed and conducted.
(Frohm J. , 2008) suggests that it would be beneficial to translate the assessed LoA values, in terms of hypothetical on-site tasks that the respondents could practically relate to.
Step 8- Design the Square of Possible Improvements (SoPI) based on the results of the workshop.
This step involves compiling the analysed data regarding current levels of automation (step6), along with the relevant min and relevant max values (step 7); thereby obtaining the Square of Possible Improvements (SoPI).
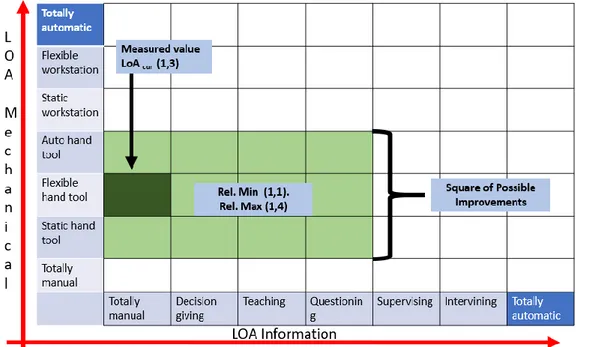
The Square of Possible Improvements (SoPI), provides a visual representation of the current LoA, relevant min LoA, (LoAmin) and relevant max LoA, (LoAmax);. Thereby
LoA, as well as the extent to which the current LoA could be increased or decreased according to the goals of the study (Fasth & Stahre, 2008).
For example, a given task in a particular process, see Figure 5 below shows the current level of automation LoA cur (shadedin dark green) on the LoA matrix. And the light
green box represents the Square of Possible Improvements that could be done on that task. The light green box encompasses the boundaries depicted by relevant minimum LoA and relevant maximum LoA (shaded in light green).
The orange blocks in Figure 7 depicts ‘operation optimisation’. Operation optimisation provides a common base for improving all the tasks performed in a given operation. As to what extent all the tasks of that particular operation could be improved on common grounds; such that all tasks would still be categorised to fit in within the same operation but with an improved LoA.
Figure 5 The Square of Possible Improvements (Fasth & Stahre, 2008)
Step 9- Analysis of the SoPI.
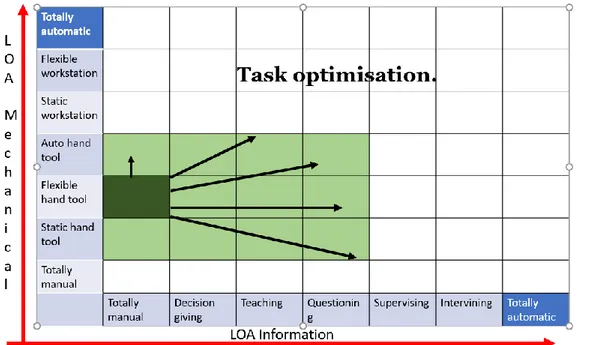
According to (Fasth & Stahre, 2008), the square of possible improvements SoPI, could be analysed for two different types of optimisation- A) Task optimisation; B) Operation optimisation.
A. Task optimisation- Refers to optimising only specific selected tasks carried out in a given operation.
B. Operation optimisation- Refers to optimising for one operation along with the included tasks on common grounds.
For example, Figure 6 shows that only one selected task (dark green) could be optimised along the measured boundaries; i.e., 12 possible solutions for task optimisation.
Figure 6 Task optimisation SoPI (Fasth & Stahre, 2008)
Example- Figure 7 shows, operation optimisation, i.e., six possible solutions if the entire operation and it’s including tasks, must be optimised.
Figure 7 Operation optimisation SoPI (Fasth & Stahre, 2008)
2.5.4 Phase 4- IMPLEMENTATION.
Once the analysis of the SoPI has been done in the previous phase, the implementation phase starts with the development of an action plan for implementation of the selected improvement solutions; and ends with a thorough follow-up evaluation of the implementation. The follow up towards the end of this phase also supports to analyse the effects of such implementation, on the production systems environment. And finally helps to evaluate- whether the effects of such changes are in line with the goal of the study/automation triggers.
This step helps the research team to simulate the effects that the change seeks to achieve. The simulation could be on vital factors such as- economic feasibility, safety, production performance, ergonomics etc.
This step ends by chalking out a thorough project plan, that includes other vital details required for the implementation of the project.
Step 11- Implementation of the suggested improvements.
This step involves carrying out the implementation of the suggested improvements according to the project plan.
Step 12- Follow-up on the implementation.
This step involves checking up for the effects of the implemented changes on other vital aspects of the production systems.
And towards the end, evaluate whether the goal of the development projects was met as per plan (Fasth, 2012).
2.5.5 Barriers faced in increasing levels of automation.
The implementation or adaptation of automation may have positive or negative impacts directly on companies, customers and suppliers. The major barriers faced while implementing automation have been classified into three main categories namely organisational barriers, external barriers and technical or internal barriers where the organisational barriers consist of technical expertise of the operator, human perception and stakeholders (Del Aguila-Obra & Padilla-Meléndez, 2006). Furthermore (Saliba, Zammit, & Azzopardi, 2017) have classified internal barriers into subcategories like low volume in production, high variety of products in production, high demand fluctuations and product life cycle. These factors can also be classified into product and production aspects as well, for example, volume, variety and demand fluctuations are based on challenges faced in terms of production and factors like standardisation and life cycle depends on product perspective. In terms of external barriers (El-Gohary, 2012) has classified them in terms of customers and suppliers.
2.5.5.1 Internal Barriers
Low volume:
According to (Löfving, Almström, Jarebrant, Wadman, & Wedfeldt, 2018), it has been a challenge to implement automation into companies which produce products in low volume since it may affect the entire production system. Generally, if a company had a very high variation in production volume, it would eventually lead to low utilisation of machinery and thus directly affecting the workforce. (Löfving, Almström, Jarebrant, Wadman, & Wedfeldt, 2018).
High variety:
The degree of automation in Swedish manufacturing industries is meagre, less than 1% due to the fact that most the industries produce products that are high in variety and low in volume where industrial automation is generally developed of low variety products that are typically made high in volumes (Thomassen, Sjøbakk, & Alfnes, 2014). (Frohm J. , Lindström, Winroth, & Stahre, 2006) Argues that implementing automation strategy for a company which has high variety may not be successful and lead to significant complication in the production systems.
Product life cycle:
A products life cycle also plays a major part in a company to adopt automation, (Frohm J. , Lindström, Winroth, & Stahre, 2006) suggests that implementation of automation strategies for products with shorter life cycles are not beneficial. Also (Vogel-Heuser, et al., 2014) argues that if a product is made up of many components, then the shorter life cycle of these components may be a challenge to the plant automation.
2.5.5.2 External barriers
Customers:
Adaption of automation in a company may lead to an improvement in operator productivity and may improve the overall quality of the component made, but a decision to implement the automation decisions can be successful only if the company has a good relationship with its customer base (Helper, 1995). This statement is also supported by (Hall & Khan, 2003) stating that, a strong and stable customer base is needed for a company to sustain its automation implementation decision. The factors like just in time and quality are essential key characteristics of the industry that the customer would prefer in a company, and these factors justify the implementation of automation in a company. Which in turn, compels the industry to justify the use of appropriate automation strategies/ethics within the industry.
Supplier integration:
According to (Rosenberg, 1972) Since suppliers are one of the significant sources of input for raw materials, they have a critical role in influencing the production aspects of the focal company; he also states that appropriate collaboration/integration of suppliers allows the focal company gain a technological advantage which eventually supports automation decisions. The same statement has also been argued by (Hall & Khan, 2003) stating that, automation adaption rate will increase if the suppliers are interested in supplying parts or components that can be incorporated in automated systems.
2.5.5.3Organizational barriers
Technological expertise of the operator:
The employees who work in the shop floor or the operator acts as an essential factor for a company to implement automation, as their education level or skills should be considered. (Ariss, Raghunathan, & Kunnathar, 2000), also supported this statement by stating that the operator spends more time working with these automation technologies so the company’s management should consider their competence level during automation implementation decisions. The training that needs to be given to the operators must also be considered as the money spent on it would directly affect the adaptation of automation by a company (Ramchandran, 1986). (Chao & Kozlowski, 1986) also concluded this statement by stating that the employees with higher skill tend to accept automation easily than employees with lower skill and training.
Human perception:
It is crucial to know how the company’s employees perceive the implementation of automation strategies, (Parasuraman & Mouloua, 1996) have also denoted this saying that implementing automation may have adverse effects like employees being overloaded with information. (Endsley M. , 1995) Has also indicated in his article that implementation of automation may create issues like distrust in automation or over-dependence on automation leading to skill degradation or even lead to a change of roles for the operator. Operator’s trust in automation may not be the same throughout, it