Thermoelectric Properties of Polymeric Mixed
Conductors
Ujwala Ail, Mohammad Javad Jafari, Hui Wang, Thomas Ederth, Magnus Berggren and Xavier Crispin
The self-archived postprint version of this journal article is available at Linköping University Institutional Repository (DiVA):
http://urn.kb.se/resolve?urn=urn:nbn:se:liu:diva-133171
N.B.: When citing this work, cite the original publication.
Ail, U., Jafari, M. J., Wang, H., Ederth, T., Berggren, M., Crispin, X., (2016), Thermoelectric Properties of Polymeric Mixed Conductors, Advanced Functional Materials, 26(34), 6288-6296.
https://doi.org/10.1002/adfm.201601106
Original publication available at:
https://doi.org/10.1002/adfm.201601106 Copyright: Wiley (12 months)
1
Thermoelectric Properties of Polymeric Mixed Conductors
Ujwala Ail1, Mohammad Javad Jafari2, Hui Wang1, Thomas Ederth2, Magnus Berggren1, Xavier Crispin1*
1. Department of Science and Technology, Linköpings Universitet, S-60174 Norrköping, Sweden 2. Department of Physics, Chemistry and Biology, Linköping University, S-581 83 Linköping Sweden
*E-mail: xavier.crispin@liu.se
Keywords: mixed ion-electron conductors, ionic Seebeck effect, mixed conducting polymers, poly(3,4-ethyelenedioxythiophene)-polystyrene sulfonate, ATR-FTIR spectroscopy
Abstract
The thermoelectric (TE) phenomena are intensively explored by the scientific community due to the rather inefficient way energy resources are used with a large fraction of energy wasted in the form of heat. Among various materials, mixed ion-electron conductors (MIEC) are recently being explored as potential thermoelectrics, primarily due to their low thermal conductivity. The combination of electronic and ionic charge carriers in those inorganic or organic materials leads to complex evolution of the thermovoltage (Voc) with time, temperature and/or humidity. One of the
most promising organic thermoelectric materials, poly(3,4-ethyelenedioxythiophene)-polystyrene sulfonate (PEDOT-PSS), is a MIEC. A previous study reveals that at high humidity, PEDOT-PSS undergoes an ionic Seebeck effect due to mobile protons. Yet, this phenomenon is not well understood. In this work, we study the time dependence of the Voc and explain its behavior from the
contribution of both charge carriers (holes and protons). We identify the presence of a complex reorganization of the charge carriers promoting an internal electrochemical reaction within the polymer film. Interestingly, we demonstrate that the time dependence behavior of Voc is a way to
distinguish between three classes of polymeric materials: electronic conductor, ionic conductor and mixed ionic- electronic conductor.
2
1. Introduction
Mixed ionic–electronic conductors (MIEC) are widely used in devices for energy conversion and storage. [1-8]MIECs are materials that conduct both ions and electrons.[9] They include semiconductors and solid electrolytes. Besides the standard electronic and ionic conductors, MIEC s belong to two distinct families, namely, ceramics and conducting polymers. Survey of the state-of- the- art in solid state electronic, ionic and mixed conductors has been summarized by Malti et al. [10]
It is important to note that there are limited number of MIECs with both high electronic and ionic conductivities. Since single phase MIECs rarely fulfill these requirements, composite materials consisting of separate ionic and electronic conductive phases are often adapted as a solution to this challenge. [11] There is a lot of interests in MIECs with respect to their thermoelectric properties. Apart from Zn4Sb3, there has been extensive studies on super-ionic conductors; Cu2-xSe,
Cu1.97Ag0.03Se, Cu1.97Ag0.03Se1+y, Ag2+xSe, AgCrSe2, etc. [12-20] as they undergo a structural phase
transition above which the metal ions become mobile leading to enhanced phonon scattering, consequently leading to low thermal conductivity. They also have remarkable electrical conductivity. In case of Cu2Se and Cu1.97Ag0.03Se (holes are the majority carriers except at the highest
temperatures) thermopower or Seebeck coefficient, α ( where, 𝛼𝛼 =𝑉𝑉𝑜𝑜𝑜𝑜
∆𝑇𝑇 , ∆T is the temperature
difference) versus temperature, shows dramatic peak (55% increase in α) around the superionic phase transition temperature (characterized by disordered Cu+ above the phase transition) with increased phonon and electron scattering. [13] It has been suggested that a great portion of the α increase might be explained by the coupling of structural degrees of freedom associated with the phase transition to carrier transport, indicating the use of structural entropy for enhanced α as new approach for enhancing thermoelectric figure of merit, ZT (where, ZT= σα2T/λ, where σ , λ and T are electrical
conductivity, thermal conductivity and the absolute temperature respectively). Korzhuev et al. [21] measured a sharp peak in the thermodiffusion of Cu0 on Cu
2Se at the phase transition and the
corresponding α was calculated to be αCu+ − αp = 2500 μV/K, implying a very large value for α Cu+ at
3
as a function of oxygen partial pressure in the transition region from electronic to ionic conduction.
[22]
Conducting polymers based on poly(3,4-ethylene- dioxythiophene); PEDOT are appealing in this regard as they are known to exhibit both electronic and ionic conduction. Owning to this property, they have been investigated extensively for their reversible electrochemical activity.
[23-24] In the PEDOT-PSS composite with nanofibrillated cellulose (NFC), glycerol and dimethyl
sulfoxide (NFC-PEDOT paper) Malti et al. reported high electronic and ionic conductivity. [10] PEDOT with Tosylate (Tos) or PSS counter ions display attractive thermoelectric properties with the highest reported values for the power factor ,σα2 of 1270 W m −1 K −2, [25] and ZT of 0.25,[26] 0.31, [27] and 0.42 ,[28] at room temperature. Interestingly, the humidity was also found to be a crucial factor,
increasing the σα2 from 23 to 355 µWm-1K-2 .[29] This rather large increase in σα2 was attributed to
the morphological changes due to the absorption of water and/or electrochemical reactions of PEDOT upon exposure to air. Recently, we reported the role of ions in the thermoelectric response of different PEDOT derivatives. A large resulting thermopower, reaching several hundreds of µV/K at high humidity levels, was identified to be due to primarily ionic Seebeck effects. [30] However, the high
Voc observed in mixed electron-ion conductors, such as for PEDOT-PSS, cannot be sustained, but
decreases with time due to the compensation and polarization of ions and electronic charges that occur in such systems.
In this study, we aim at understanding the underlying mechanism of the time- dependence of the Voc in a mixed ionic-electronic conductor such as for PEDOT-PSS. By comparing
the thermoelectric characteristics between a pure electronic conductor (PEDOT-Tos), a pure ionic conductor (PSS) and a mixed electron-ion conductor (PEDOT-PSS), we identify, for the first time, that an internal electrochemical reaction is induced within the conducting polymer layer promoted by the ionic thermoelectric effect.
4
2. Results
2.1. Electric and thermoelectric characterization
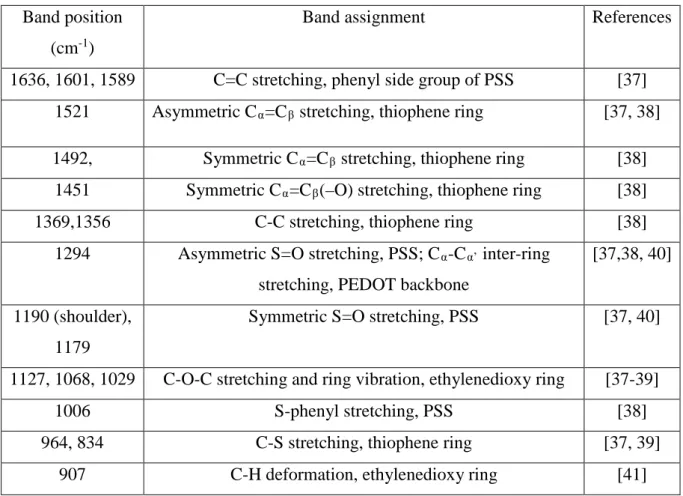
In order to understand the thermoelectric properties of the MIEC, PEDOT-PSS under different humidity levels, we systematically compare its properties with those of PEDOT-Tos (primarily an electronic conductor) and the polyelectrolyte, poly(sodium-4-styrene sulfonate), PSSNa (solely an ion conductor). Figure 1 shows the structures and the kind of electrical charge carriers present in the three different polymer systems. Figure 2a displays the electrical conductivity obtained from impedance spectroscopy as a function of the relative humidity (RH) for Tos, PEDOT-PSS and PEDOT-PSSNa. PEDOT-Tos (a thickness of 627 nm, σ = 15200 Sm-1 at RT and 10%RH) was
prepared by in situ oxidative polymerization process. [31] PEDOT-PSS films (a thickness of 5.68 µm, σ = 14 Sm-1 at RT and 10% RH) were manufactured from a commercial water dispersion (Baytron
P), provided by H. C. Starck (1.3 wt% PEDOT-PSS). PSSNa ( Mw: 70,000g/mol) was purchased from Sigma-Aldrich and films (thickness 1.5 μm, σ = 9.58 x10⁻⁴ Sm-1 at RT and 10% RH) were
obtained by drop-casting the solution onto the planar glass substrates (2 wt% PSSNa in deionized water). The total electrical conductivity in the polymer films is the sum of the electrical and ionic conductivity components. Humidity is known to facilitate and also modulate the ionic conductivity in polymers, and therefore the study of the conductivity versus a change in the RH gives us an insight regarding the relative levels of the electronic versus the ionic conductivity. As can be seen in Figure 2a, the conductivity of PEDOT-Tos is almost independent versus the RH. The most predominant conduction is then represented by electronic charges, since the large size of the tosylate counter ion do not promote fast ion conduction even at high RH levels. [31] In the case of the polyelectrolyte, the PSSNa system, the sulfonate groups are dissociated from the sodium cation. The presence of water then aids in screening the electrostatic attraction of the cations with the immobile sulfonate groups of the polyanion; thus resulting in an increase in mobility of the sodium cations.[32] The overall
5
conductivity in the PSSNa system exhibits an exponential increase with the RH, indicating that ionic conduction represents the electrical conductivity in this material. [33] PEDOT-PSS is known as a MIEC, wherein both ionic (cations) and the electronic (holes) charge carriers contribute to the overall electrical conduction. PEDOT-PSS film exhibits a decrease in the electrical conductivity up to 40% RH, while above this level the conductivity increases with RH. Even though the ionic conductivity increases by one order of magnitude with humidity, the electrical transport is still dominated by electronic conduction. The details of the composition of the electrical conductivity behavior for PEDOT-Tos and PEDOT-PSS vs. humidity have been reported in a previous communication. [30]
The set-up used for the Voc measurement is depicted in Figure 2band further explained
in the experimental part. Figure 2c shows the evolution of the open circuit voltage (Voc) with time
for the three samples, as a temperature difference (ΔT) of 1 °C is applied between the two electrodes at 80% RH. In case of PEDOT-Tos, the electronic conductor, Voc increases as ΔT increases and
saturates at a constant value of 9 µV within ~30 s. Hence, the development of the voltage (Voc)
follows the temperature rise and it is thus almost instantaneous. For PSSNa, i.e. the ionic conductor, the evolution of Voc is completely decoupled with the increase characteristics of ΔT. Voc reaches a
high voltage ranging 5-10 mV after a period of time of about 100 min; the ΔT reaches a static value in typically 30 s. The thermodiffusion of ions in polyelectrolytes, due to the Soret effect, is known to lead to large Voc in the mV/K range. [34] For the mixed conductor PEDOT-PSS, the Voc evolves in a
complex fashion. Voc increases steadily within 30 s, as ΔT is increased, reaching a maximum value
(dependent on the RH), before the ΔT stabilization time. Nonetheless, after that Voc reaches the
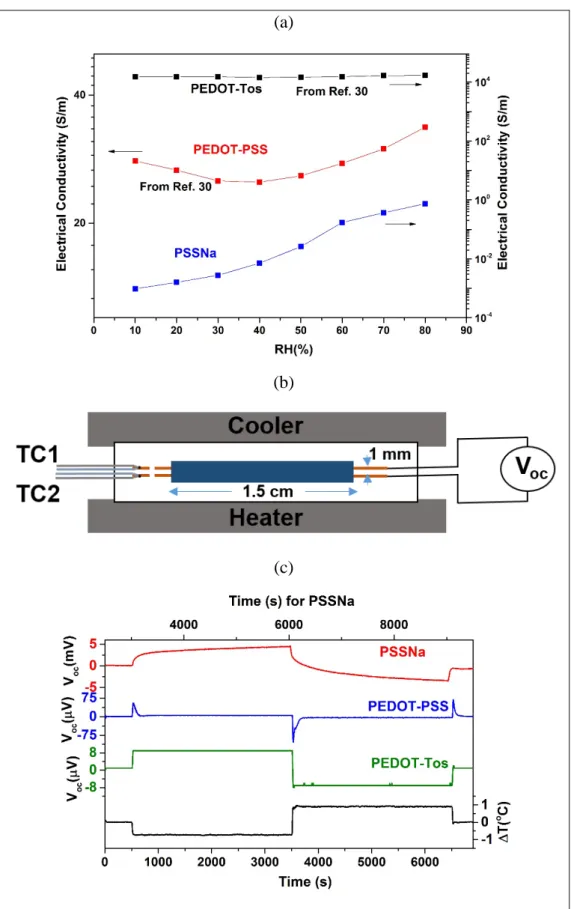
maximum value, it then starts to decrease, thus forming a peak. The value then settles to a minimum value of around 4-10 µV corresponding to the Voc of the electronic charge carriers. The peak value
of the Voc depends on the ambient humidity and the value reaches as high as 380µV at 100% RH, see
Figure 3a. In comparison to the traditional relatively much smaller electronic contribution (found in PEDOT-Tos), the presence of this high, but short-term lasting, Voc suggest a dynamic contribution
6
Voc evolution when a ΔT of 1 °C is applied across the PEDOT-PSS sample. The inset of Figure 3a
displays the Voc peak value per 1 °C for the PEDOT-PSS film at various RH values ranging from
20% to 100%. The fact that the Voc peak value depends on the humidity level is yet another indication
that the origin for this Voc versus time evolution includes a contribution from ionic transport.
2.2. Hypothesis of Voc Evolution in Mixed Conductors
When a ΔT is applied, it is reasonable to consider the thermodiffusion of holes from the hot side towards the cold side. This leads to an increased concentration of holes at the cold side, resulting a Voc in the range of ~20 µV in the region (i) of the curve in Figure 3b. Since PEDOT-PSS is a mixed
conductor, in addition to holes, it is expected to have significant thermodiffusion of protons towards the cold end, creating an internal electric field that would dominate the one developed by the thermodiffusion of holes (for the sake of comparison of the magnitude of those effects, one can remind the values for the pure electronic and ionic conductors: Sh+ in PEDOT-Tos (~20 µV/K) <
SNa+ in PSSNa (5-10 mV/K). The ionic contribution is reflected in the high value of the Voc in the
region (ii) of the curve. However, in the mixed conductor, the holes and cationic currents are interrelated and respond simultaneously to the concentration gradients created by the thermodiffusion effects. As a result, the internal field due to developing proton concentration higher at the cold side than the hot side leads to an opposite h+ drift current toward the hot side. This opposite hole current limits the Soret effect of protons and eventually leads to the decline of the Voc as seen in the region
(iii) of the curve.
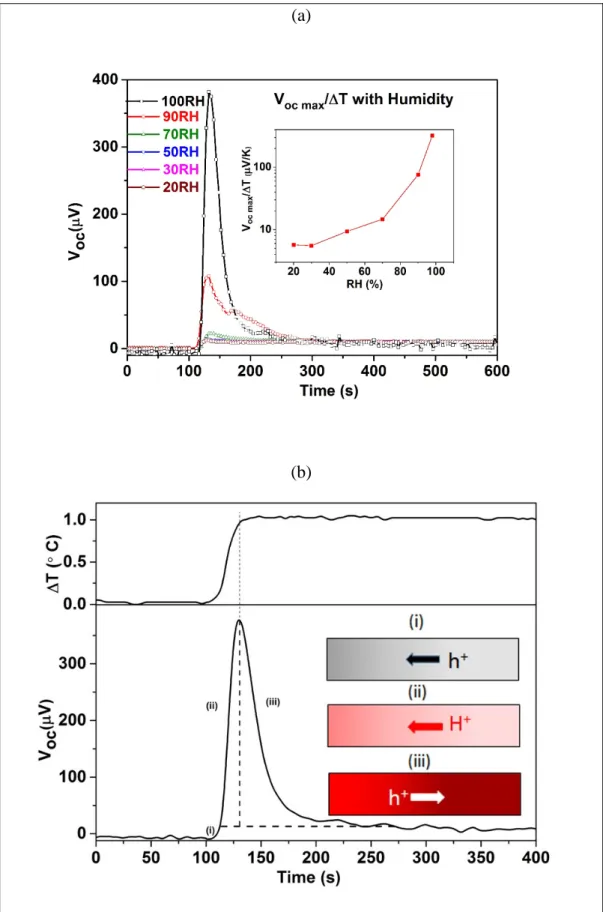
2.3. Electrical output versus time
When an external resistor is connected to the hot and cold electrodes (Figure 4a), the current versus time evolution is very different for the three types of materials: for an electronic conductor (PEDOT-Tos), the current is constantly generated because the thermodiffused holes
7
reaching the cold electrode passes through the external circuit. This is the principle of thermoelectric generators. [26] For an ionic conductor (e.g. PSSNa), the temperature gradient leads to a concentration gradient of ionic charge carriers developing slowly with time to reach a high and constant Voc. But
the ions are accumulated at the Au electrodes and cannot pass through an external circuit. Hence, the ionic thermoelectric effect can charge an electric double layer at the metal electrode. This is the principle of charging an ionic thermoelectric supercapacitors. [35] For a mixed conductor
(PEDOT-PSS), the behavior is yet different. A first question is if the ionic reorganization occurs at the interface between gold electrode and PEDOT-PSS (like in the case of PSSNa) or within the bulk of the polymer film. To in part investigate this, we measure the amount of charges that flows from the cold to the hot electrodes by applying a load resistor to the two electrodes. Figure 4b shows the output current calculated from the voltage drop measured across a load resistor over time. The resistor value was chosen to equal the internal resistance of the device (RL= Ri = 347Ω). When a ΔT of 3.7 °C was
applied across the PEDOT-PSS film at 80% RH, the current rises accordingly and reaches a maximum peak value of 0.22 µA as the ΔT gets constant (i.e. after ~100 s). After reaching this peak current value, the current reduces down to ~0.024 µA and becomes then constant. This constant low current is attributed to a pure electronic thermoelectric effect; while the added current rise and fall occurring from 0 s to ~ 250 s is attributed to an ionic thermoelectric effect and corresponding rearrangement of the ions within the films. The integrated charge under this bump equals an ionic charge of Qi = 22.7
µC rearranged in the sample. By increasing the applied temperature in 4 discrete steps finally reaching a ΔT of 3.7 °C, we record a series of 4 current bumps, see Figure 4c. The integrated charge estimated from the current versus time peak in Figure 4b equals the sum of the 4 peaks recorded in the Figure 4c experiment. This then suggests that the reorganization of ionic charges in the film can occur in discrete steps and that the total amount of electrical and ionic charges involved in the corresponding reactions and polarizations is maintained. To relate the order of magnitude of the total charge involved in this thermoelectric-driven reorganization, we simply compare this total amount of charge with that stored in a typical electric double layer EDL residing along the interface between an ionic conductor
8
and planar a metal surface (Heltmoltz layer, C = 100 µF/cm2). [36] For a voltage that equals the
maximum Voc of 300 µV of our experiment, and a capacitor surface that equals the area of the gold
electrode (A=1.5×10⁻⁵m2), an EDL will then store a charge QEDL= 4.5×10⁻³ µC. Hence, since Qi >>
QEDL, we conclude that the ionic charges is likely reorganized throughout the entire bulk of the
PEDOT-PSS film and not just along the electrode-bulk interface. This then motivates us to investigate the charge reorganization effects using a spectroscopic method that is sensitive to the chemical composition of the bulk of the PEDOT-PSS thin films.
2.4. Spectroscopic characterization
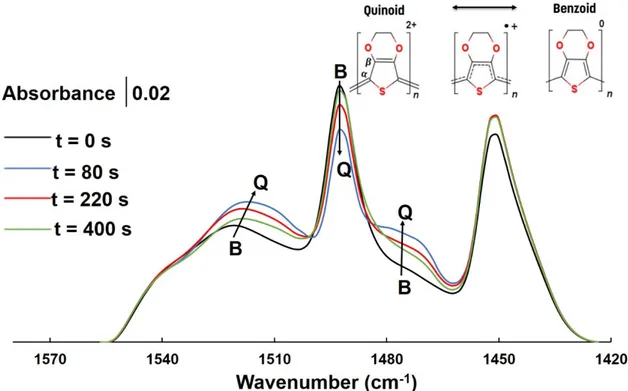
In order to understand the mechanism of the ionic thermoelectric effect in PEDOT-PSS, we use in situ Attenuated Total Reflectance- Fourier-transform infrared (ATR- FTIR) spectroscopy to resolve either a variation in free-carrier density or modification of the structure of the polymer chains upon exposure to a ΔT. A schematic view of the setup for the measurements is shown in Figure 5a. ATR-FTIR spectra of PEDOT-PSS were recorded before (t = 0 s), during (t = 0 - 220 s) and after (t = 220 - 400 s) applying ΔT. Spectra in the wavenumber region 1800-800 cm-1 are shown in Figure 5b and were recorded at the cold side of the sample. The spectrum at the t = 0 presents the chemical composition of the pristine sample and the main vibrations are listed in Table 1. [37-41] The broad background absorption is associated with free electronic carriers present in crystalline domains of semi-metallic character. [42] Figure 5c displays the time evolution of the total integrated intensity of the IR spectra from 1800 to 800 cm-1. After applying ΔT, the background intensity of the spectrum at wavenumbers greater than 1300 cm-1 gradually increases until reaching a maximum (t = 80 s). The
presence of a pronounced IR background at the cold side indicates that PEDOT-PSS possesses a higher charge carrier density at the cold side as compared to the hot side. The electronic carriers are positively charged (holes), thus giving a positive sign of the Voc, which is in agreement with our
measurements. After 80 s, the intensity of the spectrum in the 1300-1800 cm-1 region decreases even when the ΔT is maintained (t =80 – 220 s) and finally becomes constant after the heater is turned off
9
(t = 440 s). However, the final intensity level is higher than that of the pristine film that has not been subjected to a ΔT. It is important to note that the time duration of the process in which the free carrier density varies under the ΔT is of the same order as that of the development of the open circuit voltage in Figure 3a.
To monitor structural changes of the PEDOT-PSS film, under the exposure to the temperature gradient, bands attributed to thiophene rings (1550-1400 cm-1) were examined (Figure
6). After applying ΔT (up to t = 80 s), the position of the asymmetric Cα=Cβ stretching band shifts from 1521 to 1517 cm-1 and a new band also appears at 1471 cm-1, which correlates to the formation of Cβ=Cβ bonds within the thiophene rings. At the same time, the intensity of the symmetric Cα=Cβ
stretching bands at 1492 and 1451 cm-1 decreases. All of these changes can be attributed to a structural transformation from the benzoid to quinoid structure of PEDOT, which is accompanied with the formation of positive (bi)polarons at the cold side. The density of free electronic carriers is thus correlated with the density of quinoid strucutres, i.e. bipolaron species. This further supports the hypothesis to create local a bipolaron networks that then leads to the formation of a semi-metallic electronic structure. [42] After 80 seconds (the maximum intensity reached for free carrier density, Figure 5c), the intensities and positions of bands and peaks start to return to eventually coincide with those of the initial spectrum (t = 0 s), which can be attributed to a compensation of the positive (bi) polarons at the cold side, and the PEDOT structure converts back to the benzoid form. Thus the PEDOT phase in the film is more reduced at the cold side.
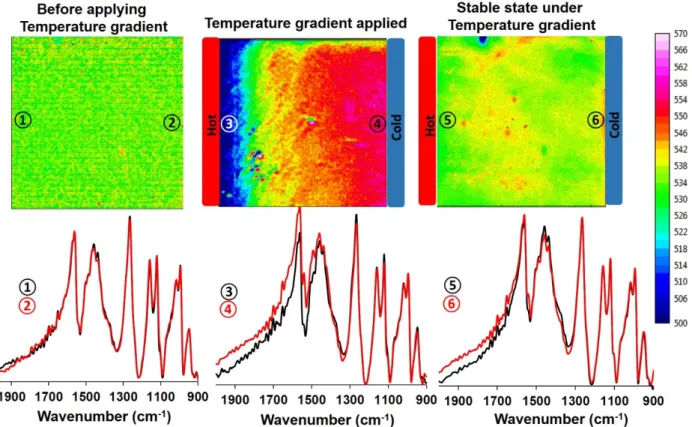
To study the conduction mechanism in PEDOT-PSS films under the exposure to a ΔT, the glass substrate, with the film residing between electrodes, is placed on a pair of Peltier elements under an FTIR microscope. Figure 7 includes FTIR images and the corresponding spectra from the pristine sample, during the build-up of the ΔT, and then finally under the steady-state ΔT. The FTIR images show the integrated intensities in the 2000-800 cm-1 region. The spectra were also integrated over a line parallel to, and close to, the electrodes to provide the averaged spectra of the material closest the edges of the electrodes. The image of the pristine sample demonstrates that the structure
10
of the material is similar across the sample, and the line-averaged spectra (1 and 2 in Figure 7) also confirm the homogeneity. After applying the ΔT (of approximately 1 °C), the intensity increased at the cold side. Comparing the spectra at the hot and cold sides (spectra 3 and 4 in Figure 7) reveals that the intensity of the spectrum at the cold side increases at wavenumbers higher than 1300 cm-1, and supports the formation and accumulation of positively charged bipolarons at the cold side. [43-44] Spectrum 4 also displays a weak new band appearing at 1517 cm-1, which can be related to the benzoid
- quinoid reaction in PEDOT at the cold side. The FTIR image at steady-state shows that most of the bipolarons have disappeared at the cold side, due to neutralization via charge compensation of the PEDOT. The results obtained from the FTIR microscopic imaging are in good agreement with findings from the FTIR-ATR results.
3. Discussion
As already discussed earlier, PEDOT-PSS is a mixed conductor, wherein both electronic (holes) and ionic charge (protons) charge carriers contribute in parallel to the overall charge conduction. In order to stabilize the PEDOT-PSS emulsion in aqueous medium, an excess PSS is added; so that the PSS-to-PEDOT ratio is about 2.5. The PEDOT-PSS emulsion has a low pH, so most of the cations are protons. Only about one tenth of the sulfonate groups are balancing the positive charge on the PEDOT chains. So, the concentration ratio between holes and protons is of the order of 1/10. The electronic conductivity is of the order of 30 S/m; while the ionic conductivity is about 3 S/m. [30, 45] Hence, the hole mobility is estimated to be 100 times higher than the proton mobility in those PEDOT-PSS samples.
Under the presence of a ΔT, holes thermodiffuse towards the cold end at first due to their higher mobility compared to the protons. Voc developed due to this hole concentration gradient
could reach about ~20 µV/K and is found to be instantaneous with the ΔT in the region (i) of the curve in Figure 3b. But, in the presence of humidity, when a ΔT is applied across PEDOT-PSS films,
11
in addition to holes, it is expected that there is a significant thermodiffusion of protons towards the cold end.
The IR spectroscopy analysis reveals that the migration of protons towards the cold side leads to an increased oxidation level in PEDOT at the cold side during the increase in Voc. This is seen as a
pronounced IR background due to a high free charge carrier density at the cold side, as well as a change in the bonding pattern from benzoid (hot side) to quinoid (cold side) structure. Several studies have indeed pointed out that in acidic environment, PEDOT-PSS is getting oxidized. [46] This has been attributed to a reaction between the proton at the alpha position of the EDOT monomer located at the end of the short PEDOT chains; the positive charge of the proton is then injected in the π-electronic system through the formation of a covalent C-H bond. [47]
(1) Hot side at the beginning of the peak: PSSH → PSS- + H+ (thermodiffusion of proton to the cold
side)
(2) Cold side at the beginning of the peak: PEDOT0 + H+→ PEDOT+-H (in response to the proton thermodiffusion)
It is important to note that the high value of Voc caused by the movement of protons creates an electric
field that is leading to a reverse hole current from cold to hot side. Hence, there are internal charge reorganization that can be seen as an internal electrochemical reaction. At the hot side, there is a lack of protons, but the incoming hole current balances the negative charge of PSS- through an oxidation (3) At the cold side, the oxidized PEDOT is giving away the excess of holes to the hot side in response to the internal electric field created by the proton accumulation at the cold side.
(4) Hot side in the peak decay: PEDOT0 + PSS- + h+→ PEDOT+PSS- (oxidation)
(5) Cold side in the peak decay: PEDOT+-H → PEDOT0-H + h+ (reduction)
This is supported by the difference between the IR image recorded at the peak and after the peak. In this process, the IR absorption background as well as the specific vibrational modes (in Figure 5c,
12
Figure 6, and Figure 7) indicate an effective electrochemical reduction of PEDOT at the cold side, and oxidation at the hot side. After the peak, the ΔT is maintained but the IR camera is not able to resolve the tiny difference in oxidation level in the sample after this reorganization since the resulting Voc is small (20µV) and the state of the sample rather close to the pristine state before the temperature
was applied.
4. Conclusions
We demonstrate that the time dependence behavior of the Voc is a way to distinguish
between three classes of polymeric materials: electronic conductor, ionic conductor and mixed electronic-ionic conductor. The time dependence of the Voc in a mixed ionic-electronic conductor,
namely, PEDOT-PSS, shows the contribution of both charge carriers towards the Seebeck voltage. Voc of 380 µV was obtained at 100% RH when a ΔT of 1οC was applied across the film. The electrical
and spectroscopic evidence show that when the conducting polymer PEDOT-PSS is under the ΔT at high humidity, a thermodiffusion of protons takes place, and it is followed by an internal electrochemical reaction. This complex behavior is a result of the mixed nature of the charge carrier conduction. The polymer system behaves like a device in which the power generated by the ionic charges is consumed within the device due to the internal load Ri (electronic shunt).
5. Experimental Section
Glass slides with two thermally evaporated gold electrodes (1 mm wide, 1 mm apart, ~100 nm thick; for the Voc measurement 1.5 cm long, and for the impedance measurement 53 mm
long) were used as substrates. The polymer layers were casted onto these electrode-patterned glass substrates and dried at room temperature. The polymer layer was removed from the area outside that defined by the metal electrodes. The sample was fixed in between a pair of Peltier modules that were programmed to maintain the desired ΔT across the sample. Voltage measuring probes were attached
13
on the gold electrodes. ΔT between the two electrodes was measured using a differential thermocouple arrangement. Both the Voc and the ΔT were measured simultaneously, but independent
of each other using a Keithley Nanovoltmeter 2182A. In order to have the independent voltage and temperature measurement path, each thermocouple was kept on the 1mm × 1mm gold electrode in line, but 1 mm away from the voltage measuring electrode as shown in Figure 2b. The measurements under humidity were carried out in a controlled environment chamber model 5532, electro-tech systems Inc.
The electrical conductivity of the films were measured using an impedance spectrometer (an Alpha high resolution dielectric analyzer, Novocontrol Technologies GmbH) with two-point probe. An ac voltage of 100 mV was applied between the electrodes with a frequency sweep from 1MHz to 0.01Hz. The electrical conductivity of the samples were then calculated as σ = d /(R x A), where d, R and A are the distance between the electrodes, real part of the impedance at zero phase angle, and area of cross-section of the film, respectively.
Attenuated Total Reflectance-Fourier-transform infrared (ATR-FTIR) spectroscopy was combined with temperature gradients to study the conduction mechanism of PEDOT-PSS layers
in situ. Measurements were carried out with a PIKE MIRacle ATR accessory with a diamond prism
in a Vertex 70 spectrometer (Bruker) using a DLaTGS detector, and the system was continuously purged with N2. IR spectra were acquired at 4 cm−1 resolution and 32 scans between 4000 and 800
cm−1. Firstly, IR spectra were recorded from the pristine sample before switching on the heater, after that, the heater was switched on for 200 s at 60°C and each IR spectrum was recorded over a duration of 20s. IR measurements were continued even after switching off and removing the heater. The presented spectra are baseline-corrected using the same rubber.band correction for all spectra.
The FTIR imaging measurements were carried out with a Bruker Hyperion 3000 microscope using a Tensor 27 spectrometer as the light source. The microscope has 128 × 128 pixels focal plane array (FPA) detector, giving a lateral resolution of 2 μm. The system was continuously
14
purged with nitrogen before and during the measurements. FTIR images were captured between 4000 and 800 cm–1 and with a 4 cm–1 spectral resolution and 64 scans. The FTIR images were captured from the sample, with a detective area of 300 × 300 µm² between two planar gold electrodes, and Peltier elements were used to create ΔT across the sample.
Acknowledgements
The authors acknowledge the European Research Council (ERC-starting-grant 307596), the Swedish foundation for strategic research (SSF), the Knut and Alice Wallenberg foundation (KAW), The Swedish Energy Agency and the Advanced Functional Materials Center at Linköping University. Authors would like to thank Mr. Ionut Alexandru Apolozan and Mr. Skomantas Puzinas for their help in setting up the automated Seebeck measurement setup.
[1] J. Maier, Nat. Mater. 2005, 4, 805.
[2] B. Winther-Jensen, O. Winther-Jensen, M. Forsyth, D. R. MacFarlane, Science. 2008, 321, 671. [3] Z. Shao, S. M. Haile, Nature. 2004, 431, 170.
[4] R. W. Baker, Ind.Eng. Chem. Res. 2002, 41, 1393.
[5] H. H. Wang, S. Werth, T. Schiestel, J. Caro, Angew. Chem. 2005, 117, 7066;
Angew. Chem. Int. Ed. 2005, 44, 6906.
[6] G. Milczarek,, O. Inganäs, Science. 2012, 335, 1468.
[7] J. Rivnay, P. Leleux, A. Hama, M. Ramuz, M. Huerta, G. G. Malliaras, R. S. Owens, Sci.
Rep. 2015, 5, 11613,
[8] S-H. Park, H-I. Yoo, Phys. Chem. Chem. Phys. 2009, 11, 391. [9] I. Riess, Solid State Ionics. 2003, 157,1.
15
[10] A.Malti, J. Edberg, H. Granberg, Z. U. Khan, J. W. Andreasen, X. Liu, D. Zhao, H. Zhang, Y.Yao, J. W. Brill, I. Engquist, M. Fahlman, L. Wågberg, X. Crispin, M. Berggren, Adv. Sci. 2016,
3, 1500305.
[11] Y. Lin, S. Fang, D. Su, K. S. Brinkman, F. Chen, Nat. Commun. 2015, 6, 6824.
[12] H. Liu, X. Shi, F. Xu, L. Zhang, W. Zhang, L. Chen, Q. Li, C. Uher, T. Day, G. J. Snyder, Nat.
Mater. 2012, 11, 422.
[13] D. R. Brown, T. Day, K. A. Borup, S. Christensen, B. B. Iversen, G. J. Snyder, APL Mater. 2013, 1, 052107.
[14] H. Liu, X. Shi, M. Kirkham, H. Wang, Q. Li, C. Uher, W. Zhang,L. Chen, Mater. Lett. 2013,
93, 121.
[15] T. W.Day, K. A. Borup, T. Zhang, F. Drymiotis, D. R. Brown, X. Shi, L. Chen, B. B. Iversen, G. J. Snyder, Mater. Renew. Sustain. Energy. 2014, 3, 26.
[16] F. Gascoin, A. Maignan, Chem. Mater. 2011, 23, 2510. [17] M. Ferhat, J. Nagao, J. Appl. Phys. 2000, 88, 813.
[18] T. Day, F. Drymiotis, T. Zhang, D. Rhodes, X. Shi, L. Chen, G. J. Snyder, J. Mater. Chem. C. 2012, 1, 7568.
[19] W. Koch, H. Rickert, G. Schlechtriemen,Solid State Ionics. 1983, 9-10, 1197.
[20] C. Korte, J. Janek, H. Timm, Solid State Ionics 1997, 101-103, 465.
[21] M. A. Korzhuev, A. V. Laptev, Fiz. Tverd. Tela (Leningrad). 1987, 29, 2646. (Sov. Phys. Solid
State. 1987, 29, 1524.)
[22] S-H. Park, H-I. Yoo, Phys. Chem. Chem. Phys. 2009, 11, 391.
[23] P. Andersson, D. Nilsson, P. O. Svensson, M. Chen, A. Malmström, T. Remonen, T. Kugler, M. Berggren, Adv. Mater. 2002, 14, 1460.
[24] Q. Pei, G. Zuccarello, M. Ahlskog, O. Inganäs, Polymer. 1994, 35, 1347. [25] T. Park, C. Park, B. Kim, H. Shin, E. Kim, Energ. Environ. Sci. 2013, 6, 788.
16
[26] O. Bubnova, Z. U. Khan, A. Malti, S. Braun, M. Fahlman, M. Berggren, X. Crispin, Nat.
Mater. 2011, 10, 429.
[27] S. H. Lee, H. Park, S. Kim, W. Son, I. W. Cheong, J. H. Kim, J. Mater.
Chem. A 2014, 2, 7288.
[28] G. H. Kim , L. Shao , K. Zhang , K. P. Pipe , Nat. Mater. 2013, 12, 719.
[29] Q.S. Wei, M. Mukaida, K. Kirihara, Y. Naitoh, T. Ishida, Appl. Phys. Express. 2014, 7, 031601.
[30] H. Wang, U. Ail, R. Gabrielsson, M. Berggren, X. Crispin, Adv. Energy Mater. 2015, 5, 1500044.
[31]. K. E. Aasmundtveit , E. J. Samuelsen , L. A. A. Pettersson ,O. Inganäs , T. Johansson , R. Feidenhans , Synth. Methods. 1999, 101, 561.
[32] O. Larsson, E. Said, M. Berggren, X. Crispin, Adv. Funct. Mater. 2009, 19, 3334
[33] X. Crispin, M. Berggren, H. Wang, (Acreo Swedish ICT AB164 40 Kista (SE)) EP 2 658 003
A1, 2013.
[34] H. J. V. Tyrrell, D. A. Taylor, C. M. Williams, Nature. 1956, 177, 668.
[35] D. Zhao, H. Wang, Z. U. Khan, J. C. Chen, R. Gabrielsson, M. P. Jonsson, M. Berggren, X. Crispin, Energy Environ. Sci. 2016, DOI: 10.1039/c6ee00121a.
[36] M. E. Orazem, B. Tribollet. Electrochemical Impedance Spectroscopy, Chapter 5 -
Electrochemistry. John Wiley & Sons, 2008.
[37] S. Xiong, L. Zhang, X. Lu, Polym. Bull. 2013, 70, 237,
[38] F. Ely, A. Matsumoto, B. Zoetebier, V. S. Peressinotto, M. K.Hirata, D. A. de Sousa, R. Maciel,
Org. Electron. 2014, 15, 1062.
[39]C. Kvarnström, H. Neugebauer, S. Blomquist, H.J. Ahonen, J. Kankare, A. Ivaska Electrochim.
Acta. 1999, 44, 2739.
17
[41] S. Garreau, G. Louarn, J. P. Buisson, G. Froyer, and S. Lefrant , Macromolecules. 1999, 32, 6807.
[42] O. Bubnova, Z.U. Khan, H. Wang, S. Braun, D. R. Evans, M. Fabretto, P. H-Talemi, D. Dagnelund, J-B. Arlin, Y. H. Geerts, S. Desbief, D. W. Breiby, J. W. Andreasen, R. Lazzaroni, W. M. Chen, I. Zozoulenko, M. Fahlman, P. J. Murphy, M. Berggren, X. Crispin, Nat. Mater. 2014, 13, 190.
[43] Z. Q. Li, G. M. Wang, N. Sai, D. Moses, M. C. Martin, M. Di Ventra, A. J. Heeger, D. N. Basov, Nano Lett. 2006, 6, 224.
[44] J. Hwang and D. B. Tanner, Phys. Rev. B. 2003, 67, 115205.
[45] Mark Lefebvre Zhigang Qi Danesh Rana Peter G. Pickup Chem. Mater. 1999, 11, 262. [46] T.-C. Tsai, H.-C. Chang, C.-H. Chen, Y.-C. Huang, W.-T. Whang, Org. Electron. 2014, 15, 641.
[47]. Z.U. Khan, O. Bubnova, M. J. Jafari, R. Brooke, X. Liu, R. Gabrielsson, T.Ederth, D. R. Evans, J. W. Andreasen, M. Fahlman, X. Crispin, J. Mater. Chem. C. 2015, 3, 10616.
18
Table 1: Positions of IR absorption bands, and the corresponding vibrational modes.
Band position (cm-1)
Band assignment References
1636, 1601, 1589 C=C stretching, phenyl side group of PSS [37]
1521 Asymmetric Cα=Cβ stretching, thiophene ring [37, 38]
1492, Symmetric Cα=Cβ stretching, thiophene ring [38]
1451 Symmetric Cα=Cβ(–O) stretching, thiophene ring [38]
1369,1356 C-C stretching, thiophene ring [38]
1294 Asymmetric S=O stretching, PSS; Cα-Cα’ inter-ring
stretching, PEDOT backbone
[37,38, 40]
1190 (shoulder), 1179
Symmetric S=O stretching, PSS [37, 40]
1127, 1068, 1029 C-O-C stretching and ring vibration, ethylenedioxy ring [37-39]
1006 S-phenyl stretching, PSS [38]
964, 834 C-S stretching, thiophene ring [37, 39]
19
20
(a)
(b)
(c)
Figure 2. (a) Electrical conductivity as a function of humidity for PEDOT-Tos, PEDOT-PSS, and PSSNa. (b) Schematic of the device for measuring the open circuit voltage Voc with time
(c) Open circuit voltage vs. time for PEDOT-Tos, PEDOT-PSS, and PSSNa, at 80%RH with ΔT= 1 ºC.
21
(a)
(b)
Figure 3. (a) Open circuit voltage as a function of humidity for PEDOT-PSS. (b) Different regions of the Voc - time curve under a ΔT and the corresponding mechanism.
22
(a)
(b)
(c)
Figure 4. (a) Schematic of the PEDOT-PSS film morphology along with the setup used for the measurement of output voltage across a load. The current calculated from the voltage drop across the
23
load resistor with resistance equal to the internal resistance of the device by applying a ΔT in (b) a single step and with (c) multiple steps, respectively.
(a)
(b)
(c)
Figure 5. (a) Schematic representation of the ATR-FTIR setup for in-situ spectral measurements. (b) ATR-FTIR spectra of PEDOT-PSS recorded as a function of time under temperature a gradient. The spectrum at t=0 s is for pristine sample; t= 80 and 220 s under ΔT; t= 400 s at the cold side after switching off the heater. (c) Variation of the normalized integrated area of spectra from 1800
24
to 800 cm-1, indicative of a change in the density of free electronic carriers with time, under the
temperature gradient
Figure 6. FTIR spectra showing the variation of the bands corresponding to the thiophene with time under the applied ΔT. The inset shows the chemical structure of the monomer units when carrying no charge (benzoid) or positive charge (radical cation or dication) with a quinoid character.
25
Figure 7. FTIR microscopic images of a pristine PEDOT-PSS film (left), a after the application of a ΔT (middle), and under steady-state conditions under an applied ΔT (right), revealing the distributions of bipolarons in the film. The line-averaged FTIR spectra were obtained at the indicated positions (and integrated along lines parallel to the electrodes at the cold and hot edges). The images show an area of 300 by 300 μm2