Price elasticity
- A potential pricing tool at IKEA
© Sophie Hagströmer & Louise Salomonsson
Lund Institute of Technology
Department of Production Management Box 118
SE-221 00 Lund
KFS i Lund AB Lund 2005 Printed in Sweden
Preface
This Master thesis project has been performed during the fall of 2004 for the Business Area Home Organisation, BA10, at IKEA of Sweden, Älmhult. The purpose with the thesis has been to develop a theoretical pricing model that will assist as a quantitative tool for future pricing decisions. During the fall the authors have had the opportunity to work with professionals at IKEA of Sweden, who have contributed with valuable ideas and comments.
The authors would like to express their appreciation to their tutors/supervisors at IKEA of Sweden, Henrik Bergstrand, Mattias Carlsson and Jonathan Catlow, who have guided and assisted the authors throughout the project. Furthermore the authors would like to thank their tutor at Lund Institute of Technology, Ingela Elofsson, for her guidance, coaching and encouragement during the process of writing this Master thesis. Finally the authors would like to thank Jerker Holm, at the Department of Economics at Lund Institute of Economics and Management, for his theoretical advices and recommendations.
Lund, January 25th 2005
Abstract
Title: Price elasticity - A potential pricing tool at IKEA
Authors: Sophie Hagströmer Louise Salomonsson
Supervisors: Henrik Bergstrand, Business Navigator, BA10, IKEA of Sweden
Mattias Carlsson, Supply Planner, BA10, IKEA of Sweden
Jonathan Catlow, Commercial Mangager, BA10, IKEA of Sweden
Ingela Elofsson, Department of Production Management, Lund Institute of Technology
Research questions: How will price altering affect sales volume for IKEA of Sweden Business Area 10’s products? Is it possible to estimate the products’ price elasticities? If so, what data is sufficient and how can these parameters contribute to future pricing procedures at BA10? What product properties are necessary in order to retain a reliable analysis? In which way are sales volumes influenced by macroeconomic factors such as real income, unemployment and business cycles? Is there an appropriate way to define homogenous markets for IKEA? If a model that describes the local behaviour is found, will this model be globally applicable or should it be modified to fit different markets? Are there any microeconomic substitution or complementary effects outside or within the IKEA range? Do internal factors, for example advertising and service levels, affect the demand and therefore sales turnover? How can a model take these effects into consideration?
Purpose: The purpose of this Master thesis is to develop a theoretical pricing model that will assist as a quantitative tool for future pricing decisions. The tool will become a complement to the internal company factors and external environmental factors, which today have the greatest impact on the pricing procedures. In addition the model should preferably be applicable on both existing and new products.
Methodology: In order to estimate the price elasticity for BA10’s products, the authors first had to gain knowledge concerning BA10’s products and the business areas’ current pricing strategies and procedures. Thereafter the authors designed a regression model with the help of academic theory. A demand curve illustrating the relationship between quantity demanded, Q, and the price, P, of a BA10 product was defined. Thereafter additional measurable factors that affect demand were defined, in order to deduct heterogeneity among countries. With the aim to attain reliable regression results the authors finally created a program, which performed all calculations automatically. The research process has been iterative and both quantitative and qualitative methods have been applied.
Conclusions: The authors have designed a regression model that estimates the price elasticities for BA10 products. Products included in the model are currently in the range and have a sales history of at least one financial year. The authors draw the conclusion that price has a statistically significant impact on sales volumes for the majority of BA10’s products. Suitable prices are therefore crucial, in order to maximize turnover. The products belonging to the two lowest price groups have been identified as the most price elastic. In addition the authors have concluded that the demand for BA10’s products is positive correlated with income, i.e. the products should be classified as normal goods. The authors have identified three prior fields of application for the results of this thesis; optimization in price investments, forecasting and prioritisation in range development.
Key words: Price elasticity, pricing strategies, pricing model, regression model, forecasting of sales volumes.
Table of content
1. Introduction...11 1.1 Background ...11 1.2 Problem description...12 1.3 Purpose ...12 1.4 Delimitations ...13 1.5 Target audience ...13 1.6 Confidentiality...131.7 Disposition and outline...14
2. IKEA in brief...17
2.1 The IKEA organisation ...17
2.1.1 Vision and business concept ...17
2.1.2 Ownership structure ...17
2.2 The pricing procedures at IKEA ...20
2.2.1 Price style matrix...20
2.2.2 Pricing new products...21
2.2.3 Activities and time restricted offers ...21
2.2.4 Implementing prices...21
2.2.5 Price meeting ...21
3. Methodology ...23
3.1 Investigations ...23
3.1.1 Explorative, descriptive, diagnostic, explanatory and evaluative study.23 3.1.2 Investigations in this thesis...24
3.2 Sources of information ...24
3.2.1 Primary data...24
3.2.2 Secondary data ...25
3.2.3 Primary and secondary data in this thesis...26
3.3 The research method ...26
3.3.1 Quantitative methods ...26
3.3.2 Qualitative methods ...26
3.3.3 Quantitative and qualitative methods in this thesis ...26
3.4 Inductive, deductive and hypothetic-deductive...27
3.4.1 Hypothetic-deductive approach in this thesis...28
3.5 Creditability...30
3.5.1 Validity...30
3.5.2 Reliability...30
3.5.3 Objectivity...30
3.5.4 Criticism of the sources ...31
3.5.5 The creditability in this thesis...31
4. Theoretical framework...33
4.1 Demand ...33
4.1.2 The price of the good ...33
4.1.3 Prices of related goods ...34
4.1.4 Population...34
4.1.5 Expected future prices ...34
4.1.6 Preferences ...35
4.2 The demand curve ...35
4.3 Elasticity...36
4.3.1 Price elasticity of demand ...36
4.3.2 Income elasticity of demand ...37
4.3.3 Cross-price elasticity of demand ...38
4.4 Price elasticity and different demand curves...38
4.4.1 Elasticity along a straight-line demand curve...38
4.4.2 Elasticity along an exponential demand curve ...39
4.5 Data for economic and econometric analysis...40
4.5.1 Time series data...40
4.5.2 Cross section data...40
4.5.3 Pooled data...41
4.6 The classic linear regression model...41
4.6.1 Assumptions of the classical linear regression model ...42
4.6.2 The unobserved error term ...43
4.6.3 Degrees of freedom...43
4.6.4 The coefficient of determination, R2...44
4.6.5 The ordinary least squares method...45
4.7 Elasticity and the log-linear model...47
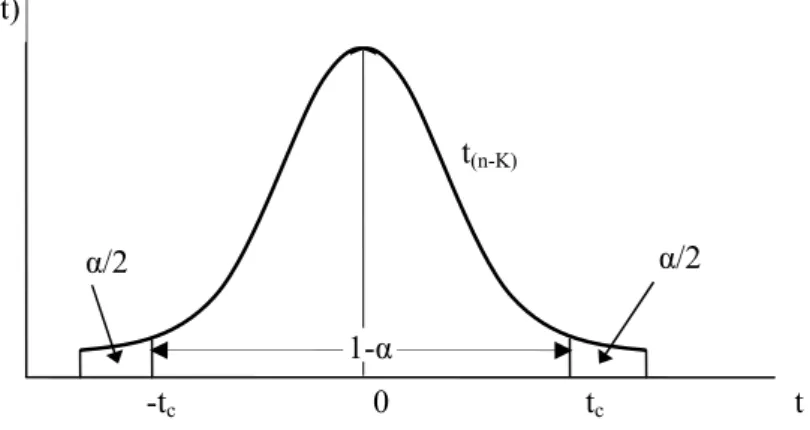
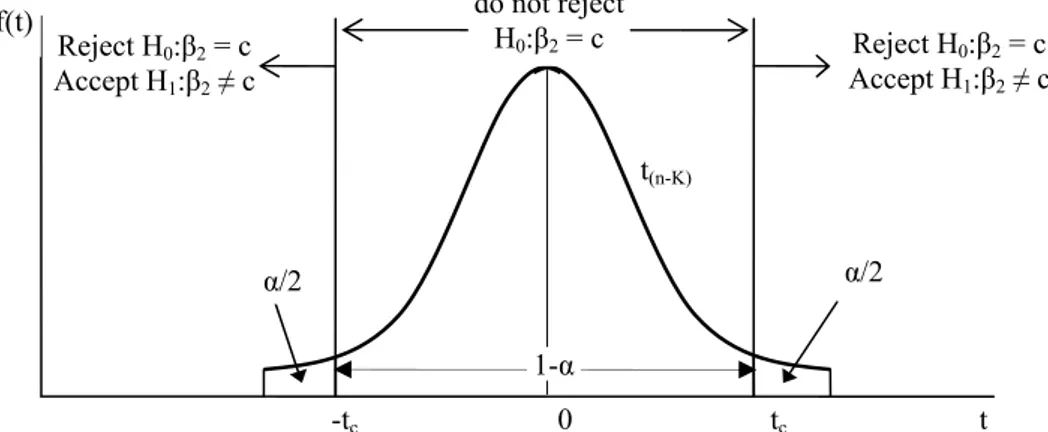
4.8 Hypothesis tests...48
4.8.1 The t-distribution ...48
4.8.2 Interval estimation ...49
4.8.3 Hypothesis testing...50
4.9 Macroeconomic factors ...53
4.9.1 Gross national income...53
4.9.2 Big Mac index ...53
5. Design of model ...55
5.1 Pooled data ...55
5.2 Demand curve ...55
5.3 Regressors and parameters ...56
5.3.1 Derivation of the model’s price elasticity...57
5.4 Justification of ordinary least square...58
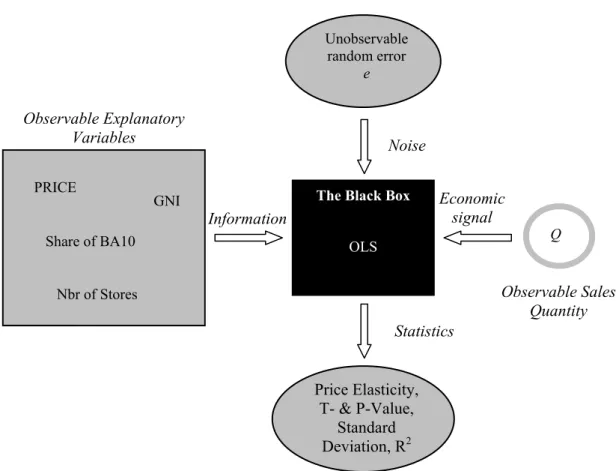
5.5 The regression model as a black box...58
5.6 Substitutes ...60
6. Practical approach ...61
6.1 Preparations...61
6.1.1 Historical sales data ...61
6.1.2 Choice of program...63
6.1.3 Variables...63
6.2.1 Subroutines ...64
6.2.2 Procedures when constructing the subroutines ...64
6.2.3 Record of information...67
6.2.4 Further adjustments...68
7. Preparations for the analysis ...69
7.1 Significance...69
7.1.1 Price and GNI significance...69
7.2 Elasticity...69 7.2.1 Price elasticity ...70 7.2.2 Income elasticity ...71 8. Analysis ...75 8.1 Comments on model...75 8.1.1 Pooled data...75 8.1.2 Choice of regressors ...75 8.1.3 Reliability...76 8.2 Analysis of results ...77
8.2.1 Analysis of overall results...78
8.2.2 Analysis of results obtained for Group West ...83
8.2.3 Analysis of results with respect to GNI classification ...85
8.3 Comments on price setting meeting ...86
9. Conclusions and recommendations ...87
9.1 Conclusions ...87
9. 2 Fields of application ...88
9.2.1 Optimize price investments ...88
9.2.2 Forecasting ...89
9.2.3 Activities and time restricted offers ...90
9.2.4 Prioritisations in range development ...90
9.3 Further research...90 10. Sources ...91 10.1 Published sources ...91 10.2 Internal material ...92 10.3 Electronic sources ...92 10.4 Interviews ...93 Appendix I ...95 Appendix II...97 Appendix III ...99 Appendix IV ...109
1. Introduction
The objective with this chapter is to provide the reader with a background and comprehension for this thesis. The introductory background is followed by the problem description that leads into the purpose. Furthermore the chapter contains selected delimitations, target audience, confidentiality and the thesis’ disposition.
1.1 Background
Price is defined as the amount of money charged for a product or service. More broadly, it is the sum of all values that consumers exchange for the benefits of having or using a product or service. Perhaps the price of a product has a greater influence on the customers in poorer countries, but it is still an important factor in the rest of the world. In addition price is a flexible element since it can be changed quickly. At the same time, pricing and price competition is a great problem facing many marketing executives.1
The price a company charges will be somewhere between one that is too low to attain profitability and one that is too high to create any demand. Therefore product costs set a floor to the price and the consumers’ perceptions set a ceiling. Further the company must consider competitors’ prices and other external and internal factors in order to find the best price between the two extremes.2 But for special
reasons this fundamental theory is not always followed. This is, for example, the case for IKEA of Sweden.3
IKEA of Sweden, IoS, is a company within the IKEA group which was founded 1943 by Ingvar Kamprad.4 Its responsibilities are development, sourcing, supply
and steering of the IKEA product range.5 IoS is divided into ten different Business
Areas, whereas this thesis project takes place at BA10, Home Organisation.6
The business idea of IKEA is “To create good design that works and has a price that everybody can afford to pay”.7 The pricing procedures are therefore crucial
and permeate the whole organisation. In line with the business idea IKEA always aims to offer the lowest market prices. As a consequence the products’ gross margins are not necessarily positive. The absence of any clear pricing method and the high number of articles and countries, in which IKEA is represented, do not make the pricing strategies less complex. In order to facilitate the pricing procedures it would be useful to estimate future effects of price altering.8
1 Armstrong G, Kotler P (2000), Marketing: An Introduction, p289-290 2 Armstrong G, Kotler P (2000), Marketing: An Introduction, p299 3 Bergstrand Henrik, 2004-09-10
4 IKEA Services AB (2003), Facts & Figures 5www.ikea.com, 2004-09-07
6 Bergstrand Henrik, 2004-09-10
7 Inter IKEA systems B.V. (2003), How We Create the Low Price, p1 8 Bergstrand Henrik, 2004-09-10
1.2 Problem description
With the background in mind the most important issue in this thesis is how price altering affects the sales turnover at Business Area 10, IKEA of Sweden. To be able to answer this question several problems have to be considered.
Since sales turnover is a function of price and sales volume, both components must be taken into consideration. One important question, in order to make effective price investments, is to estimate how the quantity sold will change if the price is altered. Is it possible to calculate the price elasticity? If so, what data is sufficient and how can these parameters contribute to future pricing procedures at BA10? What product properties are necessary in order to retain a reliable analysis?
In which way are sales volumes influenced by macroeconomic factors such as real income, unemployment and business cycles? Are social factors significant? Is there an appropriate way to define homogenous markets for IKEA? If a model that describes the local behaviour is found, will this model be globally applicable or should it be modified to fit a different market?
Are there any microeconomic substitution or complementary effects outside or within the IKEA range? Do internal factors, for example advertising and service levels, affect the demand and therefore sales turnover? How can a model take these effects into consideration?
1.3 Purpose
The purpose of this Master thesis is to develop a theoretical pricing model that will assist as a quantitative tool for future pricing decisions. The tool will become a complement to the internal company factors and external environmental factors, which today have the greatest impact on the pricing procedures. In addition the model should preferably be applicable on both existing and new products.
1.4 Delimitations
The dynamic environment and the large number of factors, that affect the demand for IKEA’s articles, made it necessary for the authors to demark their area of study. The vague definition and complexity of complementary products within the IKEA range have implied that present complement effects are not considered in this thesis. In addition, the authors ignore shifts in demand that arise in the presence of competitors.
Since the task is to optimise the total sales turnover the authors do not consider how prices should be set in a cost perspective. Gross margin and gross profit are therefore ignored.
1.5 Target audience
There are two main target groups for this thesis. The first target group is students at Lund Institute of Technology, Lund School of Economics and other universities that have an interest in econometrics, microeconomics and pricing strategies. The second group is the employees at IKEA of Sweden, especially those who have had a tutoring part in this Master thesis, with the ambition to consider estimated price elasticities when setting future prices.
1.6 Confidentiality
Because of the IKEA confidentiality policies not all figures is presented in this version of the thesis and has been replaced by crosses, ×. However, this implication is not considered to affect the informative or academic value of the Master thesis.
1.7 Disposition and outline
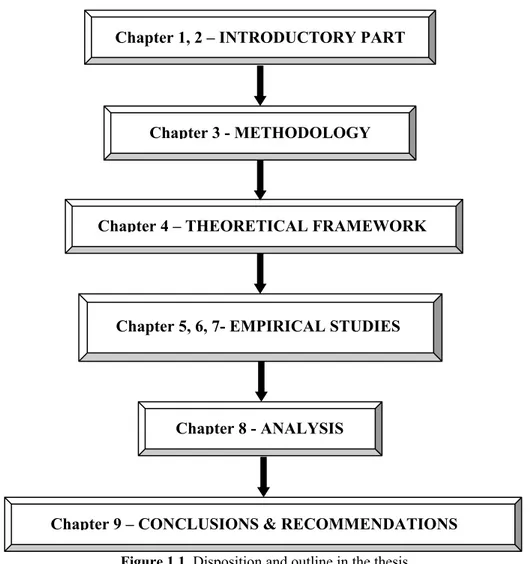
In this section the authors want to introduce the reader to the disposition and outline of this thesis. The project consists of the six parts, which are illustrated in figure 1.1.
Figure 1.1 Disposition and outline in the thesis
Chapter 1, 2 – INTRODUCTORY PART
Chapter 3 - METHODOLOGY
Chapter 4 – THEORETICAL FRAMEWORK
Chapter 5, 6, 7- EMPIRICAL STUDIES
Chapter 8 - ANALYSIS
Chapter 9 – CONCLUSIONS & RECOMMENDATIONS
The first part of this thesis consists of two chapters: the Introduction and IKEA in
brief. The chapter Introduction provides a background and comprehension for this
thesis, in which the reader will get presented to the problem description, purpose and delimitations that forms the basis for the study. In the chapter IKEA in brief, the organization structure of IKEA is outlined The aim with this chapter is to increase the knowledge regarding the Business Area Home Organization’s position and responsibilities. In addition the Business Area’s current pricing strategies and procedures are presented.
In the second part, the Methodology chapter, the authors declare the research methods applied in this thesis. In addition the authors will discuss how these methods have been implemented and interpreted by the authors.
The third part includes the Theoretical framework, which consists of microeconomic and econometric theory. This chapter aims to introduce the reader to necessary theories, in order to follow the empirical studies.
In the first empirical chapter, Design of model, the authors design a regression model based on the theoretical framework in chapter three. The regression model is later applied to selected products by the help of a program, created in Microsoft Excel. The procedures followed when creating this program are described in the second empirical chapter, Practical approach. In the third empirical chapter,
Preparations for the analysis, the authors have defined criterion and tested
hypothesis, which form the basis for the analysis in this thesis.
In the two final chapters, Analysis and Conclusions and recommendations, the regression results will be discussed and interpreted followed by conclusions and recommendations.
2. IKEA in brief
This chapter will give the reader an overview of the IKEA organisation, in order to understand BA10’s position and responsibilities. Furthermore the current pricing strategies and procedures will be presented.
2.1 The IKEA organisation
IKEA is one of the biggest global home furnishing companies with more than 200 stores in over 30 countries. The IKEA concept was founded in 1943 by the 17 year old Ingvar Kamprad. The initial letters in the name of the profounder Ingvar Kamprad, the farm Elmtaryd and the village Agunaryd makes up the company name, IKEA. Elmtaryd and Agunaryd are located in Småland, Sweden. Pencils, Christmas cards and socks formed a part of the initial product range, that today consists of about 10 000 articles9.
2.1.1 Vision and business concept
IKEA’s vision is to “Create a better day for the many people”. To realise their vision IKEA offers a wide range of design- and functional home furnishing products to prices so low that as many people as possible will afford to buy them. This demands close co-operation between designers, product developers, purchasers and suppliers to insure that the IKEA products are designed, manufactured, transported, sold and assembled in the most cost effective manner. IKEA’s customers contribute to keeping prices low, by transporting their purchased items home and assemble them.10,11
2.1.2 Ownership structure
The ownership structure and organisation of IKEA, illustrated in figure 2.1, stand for long-term independence and security. The main owner of the IKEA group is the foundation “Stiching INGKA Foundation” and it is registered in the Netherlands. Stiching INGKA Foundation owns INGKA Holding B.V., which is the parent company of all companies within the IKEA group.
9 IKEA Services AB(2003), Facts & Figures 10 IKEA Services AB(2003), Facts & Figures 11www.ikea.com 2004-09-07
Figure 2.1 0wnership structure and organisation of the IKEA Group
(www.ikea.com, 2004-09-07)
Inter IKEA Systems B.V. is the owner and world-wide franchiser of the IKEA concept. According to a detailed expansion plan Inter IKEA systems B.V. grants new franchises to new or already existing markets/territories. The IKEA group is the biggest franchisee of Inter IKEA systems B.V. 12
2.1.2.1 IKEA of Sweden
IKEA of Sweden is located in Älmhult, Sweden and is responsible for development, sourcing, supply and steering of the product range of IKEA. Furthermore they name all articles. For example, fabrics and curtains are given female names, carpets Danish place names and armchairs Swedish place names.13
IoS is divided into ten different business areas where every business area operates as “a company in the company”. Some examples of different business areas are
Kitchen & Dining, Textiles, Children’s IKEA. This projects takes place at Home Organisation, BA10, which includes storage articles such as shelves, boxes and
folders.14
12www.ikea.com 2004-09-07
13 IKEA Services AB(2003), Facts & Figures 14 Bergstrand Henrik, 2004-09-10
Figure 2.2 Organisation Chart, BA10 (Bergstrand Henrik, 2004-09-10)
In figure 2.2 the organisation chart for BA10 is shown. ISTRA stands for strategically purchasing and is a crucial division within the IKEA organisation. The purchasing mechanism is divided into three different units depending on the material to be bought. The supply planners make the forecast on an 18 months basis and they ensure that the suppliers’ capacity is matched with the demand, in order to retain a good service level. A good service level is essential for BA10, since their customers in general do not visit IKEA with the single aim to purchase BA10 articles. This means that the customer might be lost if the demanded article is out of stock. From year to year the range manager completes a range plan, where both style and price are taken into account. The commercial managers are responsible for implementing the business strategy at the stores and the technicians are responsible for construction and packing.15
In addition to the business areas, every IKEA represented country has a division that is responsible for development, marketing and profitability within all different business areas. This leads to a two-dimension organisation, where communication is important, though IoS has the greatest influence. 16
15 Bergstrand Henrik, 2004-09-10 16 Bergstrand Henrik, 2004-09-10
2.2 The pricing procedures at IKEA
Pricing IKEA’s products is a complex procedure because of the large number of articles. Both internal company factors and external environmental factors affect the pricing decisions17. Costs, marketing objectives, merchandising and marketing mix strategy are example of internal factors whereas the nature of the market and demand, competition and other environmental factors represent external factors.18
2.2.1 Price style matrix
At IKEA, all articles are divided into sixteen different categories considering their style and price. In this thesis the authors have chosen to refer to the four styles as
Style1, Style2, Style3 and Style4 whereas the four price groups are referred to as A,
B, C and D. The products in the price group A are more aggressively merchandised and positioned out in the stores than products belonging to the other price groups. Not all price groups are represented in each style category, for example there might not exist “Style1 and price group C” boxes. A possible style matrix for a group of products is shown in figure 2.3 below, where a cross indicates that there exist products in the corresponding price style group.
D
×
×
C
×
B
×
×
×
×
A
×
×
Price
Style1 Style2 Style3 Style4
Style
Figure 2.3 Example of a price-style matrix
Jonathan Catlow 2004-09-10
17 Bergstrand Henrik, 2004-09-10
2.2.2 Pricing new products
When BA10 decides on developing a new product they examine if there is a market demand for the product. Thereafter the position in the price style matrix and the absolute price-tag are established. When placing a product group into the matrix its target groups’ ability to pay is taken into consideration. An introduction of a new article often results in price adjustments for related products, in order to retain the price balance within the matrix. 19
2.2.3 Activities and time restricted offers
All price altering are not permanent, but restricted for a limited period of time. Activities and time restricted offers are the two existing time limited pricing strategies at IoS. The purpose with the activities is to entice the customers to the stores, by offering low prices. An additional purpose might be to get rid of overage stock. The time restricted offers have the same purpose as the activities, but lasts during a shorter period of time. An example of a time restricted offer could be 0.05 € champagne glasses for New Years Eve.20
2.2.4 Implementing prices
BA10 sets recommended sales prices to all IKEA stores worldwide. These prices are normally followed, but countries can also choose to alter these prices with some restrictions. For example the price-style matrix must be retained.21
Printed in 145 million copies each year, IKEA’s catalogue is the company’s principal marketing channel. The catalogue is given out once yearly and the prices of products presented in the catalogue must not be raised during that year.
2.2.5 Price meeting
The recommended prices are set during an annual three-day meeting in October. Those taking part of the meeting are the controller, commercial managers and product developers. In order to get a better insight and understanding of the pricing procedures at BA10, the authors were invited to attend the pricing meeting fall of 2004. The pricing meeting’s structure is illustrated in figure 2.4.
19 Bergstrand Henrik, 2004-09-10
20 Bergstrand Henrik, Carlsson Mattias, 2004-11-09 21 Bergstrand Henrik, 2004-09-10
First the global commercial manager held a short presentation, in which he mapped IKEA’s current market position, main competitors and pricing strategies. The participants reported if there were any specific products, which prices must be reconsidered. These products were put on the so called “Wish list”. As mentioned earlier, IKEA’s vision and business idea is to “create a better every day for the many people, by offering products to such low prices that as many people a possible can afford to buy them”. Hence IKEA has to lead with the lowest prices and must therefore continually make price investments. The maximum limit for BA10’s total price reductions, FY2006, was five percentages.
Second the pricing team was divided in two subgroups. Each subgroup was responsible for certain product areas within BA10, such as Shelves & Systems, Boxes & Drawers and Bins & Bags. New prices were suggested by using so called “pricing tools”; one measured the effect a price altering would have on margins and turnover and the other mapped the availability and prices of similar products in different countries. The aim with the tools was to set new prices that would increase the turnover and were consistent with the IKEA vision and business idea. In addition to the concrete tools personal values and ideas had a great impact. Once the separate subgroups had agreed on recommended prices for their product areas, these suggestions were presented for the rest of the pricing team. Through discussions and calculations the prices were either changed or approved.
Finally the new recommended prices were added into the records and the estimated effect on turnover and margins were registered.22
22 Bergstrand Henrik, Catlow Jonathan, Hansson Claes, 2004-10-18 – 2004-10-20
Overview Pricing in
separate groups
Presentations,
discussion New prices Figure 2.4 Structure of pricing meeting
3. Methodology
In this chapter the reader will be introduced to the methodology framework used in this thesis. Every section is divided into two parts. The authors start with a description of basic method theories and thereafter explain how these theories will be implemented into following chapters.
3.1 Investigations
Depending on the purpose of an analysis, there are different categories under which an investigation may be classified. These categories include the explorative,
descriptive, diagnostic, explanatory, and the evaluative study.23
3.1.1 Explorative, descriptive, diagnostic, explanatory and evaluative study
If the examiner wants to gain basic knowledge about a topic, an explorative study may be appropriate. The authors should question what needs to be investigated, how they should perform the investigation and which variables that will be of importance. To avoid later confusion it is important do identify what the problem comprises and what it does not.
A descriptive study is often performed to determine the properties of the research object. The descriptive studies are applied when the problem is structured and there is no intention to investigate the relationships between different causes of behaviours. In a descriptive study you gather information and determine the values of the variables.
If the purpose of an investigation is to find the reason for a certain phenomenon a
diagnostic study will be the most appropriate.
An explanatory study may be suitable if the investigator faces problems where several theories may be applied. Explanatory studies are often constructed as hypothesis tests and they determine which explanation that is relevant and why. Finally, if the investigator wants to measure the effect of a certain operation, he may also choose to perform an evaluative study.24
23 Wallén G (1993), Vetenskapsteori och forskningsmetodik, p46 24 Wallén G (1993), Vetenskapsteori och forskningsmetodik, p46f
3.1.2 Investigations in this thesis
When writing this Master thesis the authors initially wanted to get as much information as possible about BA10’s previous pricing methods, product range and pricing strategies, in order to understand the underlying aim with the Master thesis project. For this purpose an explorative study was performed. Secondly, the investigation was descriptive, since it aimed at describing the sales turnover, prices and store statistics for the period FY2000-2004. To realize the descriptive study the authors got access to BA10’s historical sales data for all countries they operate in. These data files were complex and a lot of time was spent in order to select and structure relevant tables. Finally an evaluative study was performed, in order to evaluate how changes in price affect the sales turnover.
3.2 Sources of information
In this session the authors will describe two different sorts of data, primary and secondary. 25 The different methods for finding data that are used in this thesis will
also be described.
3.2.1 Primary data
Primary data have never been used in any study before and must therefore be collected by the authors themselves.26
3.2.1.1 Interviews
Interviews are a method for finding relevant primary data for a research. They make it possible to attain a deeper understanding for the subject, since the questions can be adjusted to special individuals. To make the interviews as efficient as possible, they can be structured with already formulated questions.27
It is important to understand the difference between a conversation and an interview. The most important difference is that, in an interview one part is steering the dialog and its progress against an in advance determined course. The greatest drawback with an interview is that they are time-consuming and that the answering part may answer differently depending on the interviewer. An advantage is that the interviews are flexible and that they do not demand a lot of equipment.28
Interviews can be divided into three different categories: structured,
semi-structured and unsemi-structured interviews. A semi-structured interview implies that the
interviewer controls the questions asked. This interview can be resembled with a 25 Lundahl U, Skärvad P (1999), Utredningsmetodik för samhällsvetare och ekonomer, p52 26 Lundahl U, Skärvad P (1999), Utredningsmetodik för samhällsvetare och ekonomer, p52 27 Denscombe M (2000), Forskningshandboken, p130f
questioner that is answered face to face. A more flexible form is the semi-structured interviews. The method lets the answering part develop the ideas and speak more detailed about the questions. In unstructured interviews the scientist’s role is to speak as little as possible since the answering part’s thoughts are in focus.29
3.2.1.2 Observations
Information obtained by direct observations is characterized by the absence of written sources, interviews or surveys. In contrary all information is entirely based on real events. The observation may be of systematic or participative character. The systematic observation is mostly associated with quantitative data and statistical analysis whereas the participative observation is of a qualitative nature. The main advantage with this research methodology is that the observer will get access to data without disturbing the natural environment and thereby eliminating a wide array of possible misunderstandings and disillusions. A disadvantage is that the data collected will highly depend on the observer’s perception. Possible influences of personal values may therefore reduce the method’s reliability.30
3.2.2 Secondary data
Materials collected by another scientist than the author are called secondary data. Secondary data might be preferable, since it usually is time consuming to find primary data. In addition internet and telecommunication make secondary data easy accessible.31
3.2.2.1 Written sources
Examples of written sources are books and periodicals, internet, newspapers and
official statistics. Books and periodicals are easy accessible and have a high
credibility. Therefore, in the academic point of view, they should be the first source to look for information. Internet has an higher accessibility than books, which makes them a good medium to look for information. The drawback with internet is that there are no restrictions of the information published and therefore a big perusal from the scientist is required. 32
In order to find topical data newspapers is a good source of information. Relevant newspapers should be identified before initiating the information research. Official statistics appears to be highly reliable, impartial and based on facts and is therefore an attractive source of information.33
29 Denscombe M (2000), Forskningshandboken, p134-136 30 Denscombe M (2000) Forskningshandboken, p166-176
31 Lundahl U, Skärvad P (1999), Utredningsmetodik för samhällsvetare & ekonomer, p131f 32 Denscombe M (2000), Forskningshandboken, p187-196
3.2.3 Primary and secondary data in this thesis
In this thesis secondary data constructs the basic framework. In addition primary data is used, in order to describe and clarify assumptions and statements. More details about the data used can be found in section 3.3.3.
3.3 The research method
Data collecting methods can be classified into two separate categories; quantitative and qualitative. These methods can be applied separately, but can also be combined in order to take advantage of the qualities in both methods.34
3.3.1 Quantitative methods
Quantitative methods draw conclusions from measurements of statistical data. Usually this method transforms the information into numbers and quantities. The problem with this kind of survey is the measuring and difficulties in finding the accurate data.35 An advantage with the quantitative method is the high level of
standardization, which makes the data comparable. Standardized interviews and questionnaires are examples of quantitative methods.36
3.3.2 Qualitative methods
Qualitative methods are recognized by the absence of numerical data.37 In a
thorough qualitative study the scientist is not interested in how the world functions, but how it is interpreted.38 This information can not be valued in numbers and can
therefore be influenced by the authors’ objectives. Qualitative methods, such as personal interviews, are working in the depth and have an explaining purpose.39
3.3.3 Quantitative and qualitative methods in this thesis
In this thesis both quantitative and qualitative methods are present. The qualitative method will be applied when understanding and describing the IKEA organisation and the current pricing procedures at IoS. This will be realized with the help of secondary data, such as information at the IKEA website and documents published by IKEA. In order to obtain additional information the authors will utilize primary 34 Holme M, Solvang B (1997), Forskningsmetodik, p76f
35 Lundahl U, Skärvad P (1999), Utredningsmetodik för samhällsvetare & ekonomer, p202 36 Holme M, Solvang B (1997), Forskningsmetodik, p76f
37 Eriksson L, Wiedersheim-Paul F (2001), Att utreda forska och rapportera, p63
38 Lundahl U, Skärvad P (1999), Utredningsmetodik för samhällsvetare & ekonomer, p101f 39 Holme M, Solvang B (1997), Forskningsmetodik, p76f
data, such as unstructured interviews with employees at IoS. In addition qualitative data and methods will be used when constructing the theoretical framework in this thesis. Academic literature and published articles were the two main sources of secondary data.
The empirical part of this project will be written with the quantitative method in mind and will resemble the process illustrated in figure 3.1.
Hypotheses formulation
Research planning
Data
collection Analysis of data Data Collection Phase
Planning Phase Analysis Phase
Figure 3.1 The research process when using the quantitative method
(Lundahl U, Skärvad P (1999), p95)
BA10’s historical sales data will be of quantitative nature and is classified as secondary data.
Furthermore the authors will attend a price meeting, in which they will participate as observers. The aim with the participation is to get an insight in how the Master thesis project may fit into the current pricing routines.
No questionnaires will be used in this thesis. Instead primary data will be obtained through personal interviews. The authors will predominantly use unstructured interviews to let the interviewed persons develop their theories. These interviews will be well prepared, in order to obtain relevant data. Furthermore it is important to understand the objective with each interview. Since there are two authors, one can interview and the other can register the answers. Therefore no tape recorder, which may disturb the interviewed person, will be needed.
3.4 Inductive, deductive and hypothetic-deductive
Conclusions can be drawn either via induction or deduction. If the reality is approached without the support from established theories, the method is called
induction. Generalizations, concepts, premises and hypothesis arise from the data
gathered and the context of the situation.40 In contrary, deduction means that
existing theories are applied to a specific situation in order to examine the validity of the theories.
Induction is often described as moving from the specific to the general and the argument is often based on experience or observations. In contrary deduction is moving from the general towards the specific.41
In addition to the two approaches described above there is a third way of relating theory to reality. This method is a combination of the inductive and deductive approaches and is called the deductive approach. The hypothetic-deductive technique formulates arguments in the form of hypothesis, which consists of statements with a testable validity. Based on the hypothesis a model of the reality, that finally is tested empirically, is constructed. Through such empirical investigations a specific theory can be verified or discarded. 42
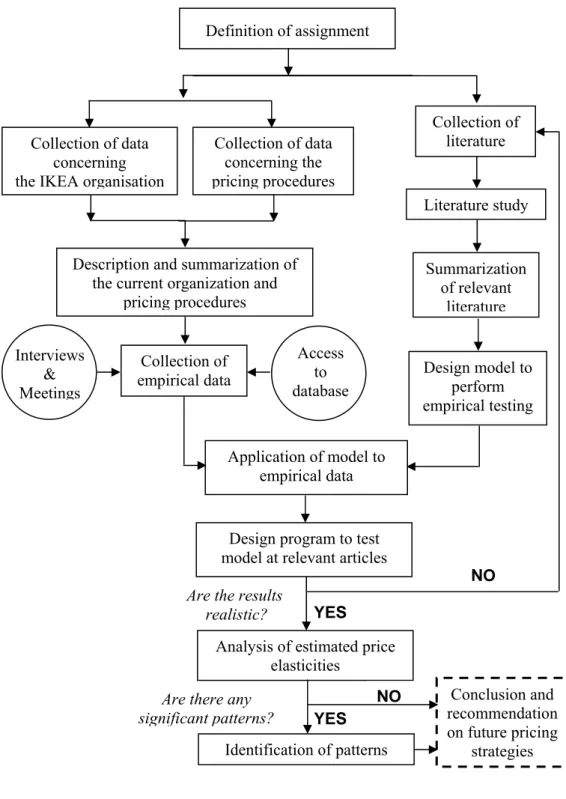
3.4.1 Hypothetic-deductive approach in this thesis
This thesis is characterized by a hypothetic-deductive approach. Both empiric and logic approaches are used. Initially historical sales data for selected markets will be studied and the authors will estimate demand curves for different products. Thereafter generalizations, premises and hypothesis will form a base for different models, which will be tested empirically on new data. Through iterative testing, modelling and investigations a final model will be created. In figure 3.2 the hypothetic-deductive mode of procedure can be followed.
41 Halvorsen K (1992), Samhällsvetenskaplig metod, p43-46
Application of model to empirical data
NO
Design program to test model at relevant articles
Design model to perform empirical testing Summarization of relevant literature Literature study Collection of literature Access to database Interviews & Meetings Collection of empirical data
Description and summarization of the current organization and
pricing procedures Collection of data
concerning the IKEA organisation
Definition of assignment Collection of data concerning the pricing procedures Identification of patterns Conclusion and recommendation on future pricing strategies
Are the results
realistic? YES
Analysis of estimated price elasticities
NO
Are there any
significant patterns? YES
3.5 Creditability
Independent of the chosen mode of procedure, the result always has to be reviewed. The following sections aim to describe the terms validity, reliability,
objectivity, generalization and criticism of the sources. Subsequently the authors
will discuss the creditability in this thesis.
3.5.1 Validity
Validity can be defined as the absence of systematic errors. There is a distinction between internal and external validity. Internal validity is defined as a gauge’s ability to measure what it is supposed to measure. Complete internal validity is rarely obtainable. Therefore it is important to be aware of the risk that the gauge’s measurements may be too small, too large or misleading.43
The external validity is defined as the accordance between the gauge’s response and what was actually supposed to be measured. If individuals are consciously or unconsciously lying, when answering a questionnaire, this would imply incomplete external validity. As a consequence the measurement will be a bad indicator of the factor that was supposed to be measured.44
3.5.2 Reliability
Reliability is defined as the absence of random errors. If the measurement is not influenced by the measurer or the current circumstances, a high reliability will be attained. In order to increase the reliability the measurements should be performed in such an identical way as possible. Furthermore high reliability presumes high validity.45
3.5.3 Objectivity
Objectivity implies that the researcher does not influence the research results.46 It
is difficult to achieve total objectivity. Therefore restricted objectivity is in general desirable and sufficient.47 To attain restricted objectivity the researcher must be
able to distinguish facts from values and be aware of the importance of versatility and completeness, in order to maintain unbiased48.
43 Lundahl U, Skärvad P (1999), Utredningsmetodik för samhällsvetare & ekonomer, p150f 44 Lundahl U, Skärvad P (1999), Utredningsmetodik för samhällsvetare & ekonomer, p150f 45 Lundahl U, Skärvad P (1999), Utredningsmetodik för samhällsvetare & ekonomer, p152 46 Arvidsson P, Rosengren K (1992), Sociologisk metodik, p77
47 Eriksson L T, Finn Wiedersheim-Paul (2001), Att utreda forska och rapportera, p37 48 Lundahl U, Skärvad P (1999), Utredningsmetodik för samhällsvetare & ekonomer, p75
3.5.4 Criticism of the sources
When using sources, primary as well as secondary, it is vital to keep a distance to the information used. The researcher should question whether if the sources of information, are valid, relevant and reliable. The importance of criticism of the sources should not be underestimated since incorrect or misleading information affects the research project’s result.49
3.5.5 The creditability in this thesis
When writing the thesis the authors have had to do several demarcations because of the complexity of the project. The demarcations may have affected the internal validity negatively since the authors have not been able to measure or analysis all data and its implications. The internal validity relies on the knowledge and reminiscence of BA10’s employees.
The factor that greatly determines the reliability in this thesis is the accuracy of the historical sales and range data collected and received at BA10. If the data includes standard errors the conclusions and results will be misleading. The authors’ skillfulness in software programs, programming languages and theoretical knowledge is also essential for this project’s reliability.
The quantitative nature of this thesis made it possible for the authors to remain unbiased and to obtain objectiveness. Conclusions are drawn from numerical models and regressions, which have minimized possible impacts of personal values. The fact that there are two authors, that gather and analyse the sources of information in this thesis, has lowered the risk of biased thoughts and lack of constant awareness.
Historical sales data at BA10 is confidential. Because of this confidentiality the authors did not have any possibility to test and examine its soundness. Academic course books, papers and published articles that the authors refer to in the thesis can be regarded as objective and valid because of their theoretical character. Possible misunderstandings between the authors and the employees at BA10, which may occur during interviews, would have affected the thesis validity negatively.
4. Theoretical framework
In order to provide any numerical measure of the relationship between the demand and price of specific products at BA10, the authors will in this chapter introduce the reader to basic microeconomic and econometric theory. Detailed derivations and proofs will not be treated in this thesis but may be found in references.
4.1 Demand
For an article to be demanded the following three criteria must be satisfied: The purchaser must desire, afford and have a definite plan to buy the item. Sometimes the quantity demanded, which for example is measured in articles per week, is greater than the amount of goods available. This means that the quantity bought will be less than the actual quantity demanded. The main factors in which the quantity demanded depends on are income, the price of the good, the price of
related goods, population, expected future prices and preferences.50 These six
factors will all be discussed in this section. But the focus in this thesis will be on the first four.
4.1.1 Income
The variable income, I, has a significant influence on quantity demanded, Q, but the correlation can be either positive or negative. If the correlation is positive, i.e. ∂Q/∂I is greater than zero, the goods are called normal. For some goods, however, the quantity may decrease as income increases in some range. A good for which ∂Q/∂I is negative is called inferior. Some examples of inferior goods are rotgut whiskey, potatoes and second-hand clothing.51
4.1.2 The price of the good
Two different aspects to look into when discussing the price of a good are the
substitution and the income effect.52
4.1.2.1 Substitution effect
A substitute is a good that serves almost as well as the original article. If the price of the original article increases, other things remaining the same, more of the substitute and less of the original good will be demanded.53
50 Parkin M, Powell M, Matthews K (2003),Economics, p46 51 Nicholson W (1998), Microeconomic Theory, p128-129 52 Nicholson W (1998), Microeconomic Theory, p806 53 Nicholson W (1998), Microeconomic Theory, p806
4.1.2.2 Income effect
A decrease in the price has the same effect as an increase in the purchaser’s real income. After buying equal quantity of the now cheaper good the purchaser will have some income remaining. In case of a normal good the purchaser will use this money to buy more of the product. On the other hand, if an inferior good, a lower price may lead to a decrease in the purchaser’s consumption of the good. 54
4.1.3 Prices of related goods
The quantity demanded also depends on the price of related goods and can be observed in two different aspects: substitutes and complements.55 Since
complements are disregarded in this thesis the authors will only present the relevant theory for substitutes.
• Substitutes: In addition to the example described in section 4.1.2.1 regarding substitutes there is another possible scenario. The case could be that the price of the substitute is altered. This will then, in the same way as before, affect the demand of the good.56
Two goods, Xi and Xj are said to be gross substitutes if:
∂Xi / ∂Pj >0,
where Pj is the price for good j. In other words, a rise in price of one good
causes more of the other good to be bought. 57
4.1.4 Population
The demand depends on the size and the age structure of the population.58 In addition cultural differences also have a significant impact.59
4.1.5 Expected future prices
People substitute over time. This means that they buy less of a good before its price is expected to fall, which implies that the demand for the good decreases. The reverse case will happen if the price is expected to increase.60
54 Schotter A (1997), Microeconomics, p68
55 Parkin M, Powell M, Matthews K (2003), Economics, p48-49 56 Parkin M, Powell M, Matthews K (2003), Economics, p48-49 57 Nicholson W (1998), Microeconomic Theory, p168
58 Parkin M, Powell M, Matthews K (2003), Economics, p48-49 59 Armstrong G, Kotler P (2003), Marketing: An introduction, p141f 60 Parkin M, Powell M, Matthews K (2003), Economics, p48-49
4.1.6 Preferences
Preferences are an individual’s attitude towards and taste for goods and services. These preferences will affect the demand structure. Past experience, genetic factors, advertising information, religious beliefs and other cultural and social factors are factors that will shape individuals preferences.61
4.2 The demand curve
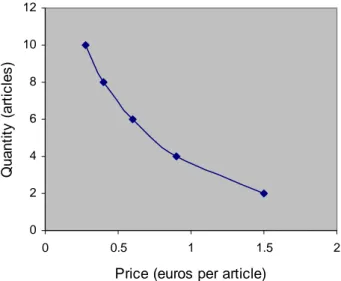
A demand curve shows the relationship between the quantity demanded of a good and its price, when all other influences on consumers’ planned purchases remain the same. Another way of looking at the demand curve is as a willingness-and-ability-to-pay curve that measures marginal benefit. It illustrates the highest price that someone is willing to pay for the last unit bought. The smaller the quantity available the higher price but as the quantity available increases the price decreases. In figure 4.1 an example of a demand curve is shown. All the factors that influence the demand also influence the demand curve.62
0 2 4 6 8 10 12 0 0.5 1 1.5
Price (euros per article)
Q u a n ti ty ( a rti c le s ) 2
Figure 4.1 An example of a demand curve
(Parkin M, Powell M, Matthews K (2003), p46)
61 Parkin M, Powell M, Matthews K (2003), Economics, p48-49 62 Parkin M, Powell M, Matthews K (2003), Economics, p46-48
4.3 Elasticity
In the section below the mathematical implications of the theoretical framework in 4.1 and 4.2 will be represented.
4.3.1 Price elasticity of demand
The demand for a product is, as mentioned in section 4.2, a function of the related price. Therefore a price altering does affect the sales turnover. An instrument to measure this effect is the price elasticity of demand, which is defined by:
First, assume that the two variables Q and P stand for demanded quantity respectively price. Second, suppose that the demand variable Q depends on the price variable P, so that Q=f(P,…..), where the dots in the equation indicates that Q may depend on additional variables than P.63 The elasticity of Q with respect to P, eQ,P, is a units- free measure of the responsiveness of the quantity demanded of a
good to a change in its price when all other variables remain the same.64 The
measure is units-free because the percentage change in each variable is independent of the units in which the variable is measured, hence it does not matter if the price is in Euro or in US Dollars.65
Price elasticity of demand = Percentage change in quantity demanded Percentage change in price
0
when
/
/
,∂
∗
Δ
→
∂
→
Δ
Δ
=
Q
P
P
Q
P
P
Q
Q
e
QPSince a positive percentage change in price usually results in a negative percentage change in quantity demanded, eQ,P is mostly negative.66 To measure how elastic the
demand is only the absolute value may be considered.67 A distinction is often made
among absolute values of eQ,P that are less than, equal to or greater than one. The
terminology used is shown in table 4.1.68
Absolute value of eQ,P at a point Terminology curve at this point |eQ,P | > 1 Elastic
|eQ,P|= 1 Unit elastic
|eQ,P| < 1 Inelastic
Table 4.1 Terminology for a demand curve to distinguish values of eQ,P
(Nicholson W (1998), p191)
63Nicholson W (1998), Microeconomic theory, p189 64 Parkin M, Powell M, Mattews K (2003), Economics p74 65 Parkin M, Powell M, Mattews K (2003), Economics p75 66 Nicholson W (1998), Microeconomic theory, p190 67 Parkin M, Powell M, Mattews K (2003), Economics, p75 68 Nicholson W (1998), Microeconomic theory, p191
For an elastic curve a price increase implies by a more than proportional quantity decrease, or increase if eQ,P>1, which indicates that price has a great affect on
demand. If the demand curve is unit elastic the increase in price and quantity are of identical proportional magnitudes. An inelastic demand curve is less responsive to price changes than the elastic and unit elastic demand curves.69
4.3.2 Income elasticity of demand
Price is not the only variable that affects the demand for a particular good. The income levels vary in business cycles and have an impact on the public purchasing power and demand. The income elasticity of demand, eQ,I, is a measure of the
responsiveness of demand to a change in income, when all other variables remain the same.70
Income elasticity of demand = Percentage change in quantity demanded Percentage change in income
0
when
/
/
,∂
∗
Δ
→
∂
→
Δ
Δ
=
Q
I
I
Q
I
I
Q
Q
e
QIThe values of eQ,I can be positive or negative and can be categorized into three
ranges shown in table 4.2.
Value of eI,P Good classification eQ,I > 1 Normal good, income elastic
0< eQ,I <1 Normal good, income inelastic
eQ,I < 0 Inferior good
Table 4.2 Terminology to distinguish values of eQ,I
(Parkin M, Powell M & Mattews K (2003),p80f)
69 Nicholson W (1998), Microeconomic theory, p190-191 70 Parkin M, Powell M & Mattews K (2003), Economics, p80
4.3.3 Cross-price elasticity of demand
Cross elasticity of demand measures the responsiveness of demand for one good to a change in the price for another good, P’. It captures the change in demand that occurs if a substitute or complement good rises or falls in price.71
Cross price elasticity of demand = Percentage change in quantity demanded Percentage change in price of related good
0
when
'
'
'
/
'
/
' ,∂
∗
Δ
→
∂
→
Δ
Δ
=
Q
P
P
Q
P
P
Q
Q
e
QP4.4 Price elasticity and different demand curves
In this section the reader will get an overview of the implications different demand curves have on the properties of the corresponding price elasticity of demand.
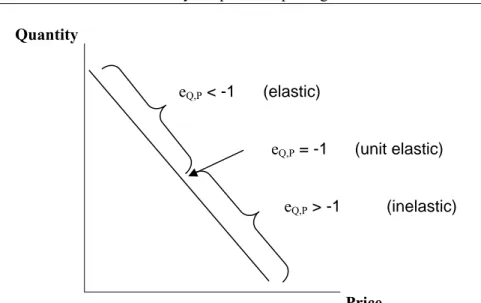
4.4.1 Elasticity along a straight-line demand curve
The simplest form of recording the relationship between quantity demanded Q, the price of the good P, income I and the price of other goods P’ is by means of a linear function of the form:72
' dP cI bP a Q= + + +
where a, b, c and d are parameters.
It is important to distinguish elasticity from the slope of the demand curve although they are related. Along a linear demand curve the derivative ∂Q/∂P, the slope, is
constant. For example if ∂Q/∂P equals –3 that would imply that a rise in price with
one dollar always decreases demand with three units. The price elasticity is therefore a constant, b, times P/Q and obviously varies along a linear demand curve. Demand is unit elastic at the midpoint of the demand curve, elastic above the midpoint and inelastic below, which is illustrated in figure 4.2.73
71Parkin M, Powell M & Mattews K (2003), Economics, p87 72Nicholson W (1998), Microeconomic theory, p198
Quantity eQ,P < -1 (elastic) eQ,P = -1 (unit elastic) eQ,P > -1 (inelastic) Price
Figure 4.2 Elasticity along a straight-line demand curve (Nicholson W (1998), p199)
4.4.2 Elasticity along an exponential demand curve
The exponential demand curve also implies certain properties on the price elasticity of demand. Here the elasticity is constant over a range of prices. The definition for an exponential demand curve is:
d c b
I
P
aP
Q
=
'
where a, b,c and d are parameters.
If we are to study the price elasticity, i.e. for particular values of I and P’, the equation can be written as
b
P
a
Q
=
'
where a’= a
I
cP
'
d. The equation can alternatively be written as a linear function in the natural logarithms of Q and P.P b a Q ln ' ln ln = +
b
P
a
P
P
ba
Q
P
P
Q
e
b b P Q=
∂
∂
∗
=
∗
=
−/(
'
)
'
/
/
1 ,Hence the parameter b, which is the exponent of P, is the price elasticity of demand. Note that the price elasticity of demand is constant for an exponential demand curve. In addition exponential demand curves exhibit constant income and cross-price elasticity.
In this case: 74
d
e
c
e
P Q I Q=
=
' , ,4.5 Data for economic and econometric analysis
The success of any econometric study depends highly on the availability of the appropriate data. There are three types of data that may be available for empirical analysis: time series, cross section and pooled data.75
4.5.1 Time series data
A time series is a set of observations on the values that a variable takes at different times. Such data may be collected at regular time intervals such as daily, weekly, monthly, quarterly, annually etc. Although time series are frequently used in econometrics they present a special problem. Most empirical work assumes that the underlying time series is stationary, i.e. its mean and variance do not vary systematically over time. An example of such a time series is the temperature measured in Celsius in a specific city during a year. It is stationary because the mean and variance only depend on the month and day the measurement has taken place, not which year. A rising problem is that trends can often be observed out of time series data and hence the series is not stationary.76
4.5.2 Cross section data
Cross section data is data on one or more variables collected at the same point in time.An example is sales figures for a company, in different countries. As with time series, cross sectional data have their own problems where heterogeneity often is the biggest issue. Size and scale effects must be taken into account in order to compare data.77
74 Nicholson (1998), Microeconomic theory, p199-201 75 Damodar N. Gujarati (2003), Basic econometrics, p26 76 Damodar N. Gujarati (2003), Basic econometrics, p26 77 Damodar N. Gujarati (2003), Basic econometrics, p27-28
4.5.3 Pooled data
Pooled or combined data is a combination of both time series and cross sectional data. For example sales data in different countries for several time periods is a set of pooled data.78
4.6 The classic linear regression model
Regression analysis is concerned with the study of the dependence of one variable, the dependent variable, on one or more other variables, the explanatory variables. The analysis aims to estimate and/or predict the mean or average value of the dependent variable, y, in terms of the known values of the explanatory variables,
X.79 The analysis includes estimation of regression coefficients, their standard
errors and some of their properties. There exist several regression models whereas the Classical Linear Regression Model is the most common. 80 Note that further on
in this thesis following notations hold:
• xi, β and b are vectors of 1×K elements. • y,
yˆ
, ε and e are vectors of n×1 elements. • X is a n×K matrix.• ’denotes the transpose of a vector or matrix.
• xij, yi,
yˆ
i, bi, ei, εi and βi denote single 1×1 elements from the corresponding matrix and vectors X, y,yˆ
, b, e, ε and β.The CLRM assumes a linear relationship between the dependent variable, y, and, either the explanatory variables, X, or the parameters, β. Linearity in the variables means that the conditional expectation of y, E(y|X) is a linear function of X. In this interpretation the power of the elements in X may only be of the order one or zero, in order for the definition of linearity to hold. The second interpretation, linearity in the parameters, implies that the conditional expectation of y, E(y|X) is a linear function of the parameters, the elements in β. It may or may not be linear in the variable X. In this interpretation the population regression function, E(y|Xi)= β1+
β2Xi2 , is a linear regression model.81 When using the term linearity in this thesis,
the authors refer to the linearity in the parameters.
78 Damodar N. Gujarati (2003), Basic econometrics, p28 79 Damodar N. Gujarati (2003), Basic econometrics, p18 80 Damodar N. Gujarati (2003), Basic econometrics, p42 81 Damodar N. Gujarati (2003), Basic econometrics, p42
4.6.1 Assumptions of the classical linear regression model
In order to use and to draw conclusions from the CLRM as an econometric model, the following assumptions must hold:
1. Linearity: The regression model is linear in the parameters:
y = Xβ + ε, yi = β1xi1+β2xi2+β3xi3+ εi
2. No multicollinearity: The rank of the n×K data matrix of explanatory variables, X, is K with probability 1. K is the number of unknown parameters and n is the number of observations.
3. Strict exogeneity: Given the value of X, the expected value of the random disturbance term εi is zero. In other words the conditional mean value of ε is zero, E[εi|X]=0, i=1.2….n
4. Spherical error variance: Given the values of X, the variance of εi is the same for all observations. This property is also called homoscedasticity. In addition there must be no correlation between observations, that is the conditional variance of εi is identical for all i=1,2….n ⇒ Var[ε|X]= E[εε’|X]=σ2I, where ε’ denotes the transpose of ε. 82 That is Var[ε|X] is a
n×n matrix, in which all diagonal elements equal σ2 and all other elements
equal zero.
5. X values are fixed: Values taken by the regressor X are considered fixed in repeated sampling, i.e. X is a nonstochastic matrix.83
6. Normality of the error term: ε|X∈N[0,σ2I], given the value of X, the
random disturbance term ε is assumed to be normal distributed with mean zero and variance σ2. This assumption is optional when solely estimating
the parameters.84
82 Hayashi F (2000), Econometrics. p4-12
83 Damodar N. Gujarati (2003), Basic econometrics, p66