November 24-26, 2014
OZONE-BASED ADVANCED OXIDATION
PROCESS AS PRE-TREATMENT OF
WASTEWATER FROM THE WOOD-BASED
INDUSTRY
Alexandre Amaro
1; Henrik Hanson
2; Fabio Kaczala
2;
Marcia Marques
1& William Hogland
2 1Rio de Janeiro State University-UERJ, Brazil
2
Linnaeus University-LNU, Sweden
ABSTRACT
Three ozone-based advanced oxidation treatments (O3; O3 with initial pH adjustment and;
O3/UV with initial pH adjustment) were compared for the treatment of a recalcitrant
wastewater generated during washing/cleaning of surfaces and equipment used in filling and gluing processes (urea-formaldehyde and phenol-formaldehyde resins) in a wood-floor industry in Sweden. The wastewater (initial COD 3,400-4,000 mg/L) was obtained at the outlet of a sedimentation tank, which receive an inflow with an average COD of 45,000 mg/L. The experiments were performed in a semi-batch microbubble column reactor connected to a UV reactor, where 2.5 L samples of wastewater were submitted to the maximum dose of 2 g of O3 per gram of initial COD. For the full-factorial design, the independent variables were
O3 concentration (g O3/Nm3); recirculation flow (L/min); and initial pH (pHi). The evaluation
of the treatment performance was based on COD and TOC reductions (in %), and the effluent obtained was used in respirometric assays with activated sludge obtained at a municipal wastewater treatment plant to assess biodegradability/inhibitory effects. The results showed that ozonation at the original low pH promoted a reduction of 65% and 31% of COD and TOC respectively, but made the effluent less biodegradable. The highest COD and TOC reductions were achieved when O3 /UV treatment with pHi = 9.3 were applied (93% e 56%
reductions for COD and TOC respectively). The results with the respirometry tests suggest that application of O3 only at higher pH values promoted biodegradability enhancement of the
effluent, making it treatable by microbiota obtained with activated sludge from a municipal wastewater treatment plant.
KEYWORDS: Advanced oxidation processes; Industrial wastewater; Respirometry; Ozone;
UV.
1 INTRODUCTION
Forestry has always been one of the major industries in Sweden, having registrations of negative impacts to the environment varying from physical alteration of rivers to facilitate logs driving, to runoff of toxic stormwater generated during rain washing of logs in open door
storages [1]. In order to reach the ambitious goals set by the Water Framework Directive (2000/60/EC), great effort has been made to neutralize possible negative effects on water bodies’ integrity, especially the ones caused by industrial wastewater discharge. Among forestry industries, water consumption and wastewater generation is diversified. Pulp and paper mills, for example, are known for its large water consumption and generation of toxic wastewater [2,3,4] while wooden furniture and floor industries are characterized as dry-process industries since water is not required in their production dry-processes [5,6]. Yet, wastewater is generated during cleaning and washing procedure of surfaces and equipment used for wood sizing, gluing, filling and surface coating [7], and contains significant amounts of pollutants such as urea- and phenol-formaldehyde, ammonium sulfate, wood filler, lacquer and detergents [8]. Despite the small amount generated (2.0 – 2.5 m3/week) this wastewater contains COD values varying from 3,200 mg L-1 to 50,000 mg L-1 [7,8] and it has been shown to be toxic to microalgae [5], brine shrimp and plant species [9].
Since the construction, operation and maintenance of on-site conventional industrial wastewater treatment plant is not appropriated from economical and operational points of view due to the low volumes of wastewater generated by these “dry industries”, the common practice has been dilution with potable water (50 times or more) before discharging this wastewater into the sewage system [6, 8]. To avoid this unsustainable practice, different treatment techniques have been tested at Linnaeus University during recent years. However, [6] and [7] reported unsatisfactory COD removal by anaerobic biological treatment and sorption/filtration process, respectively, whereas [8] observed that efficiency of electrocoagulation treatment decays considerably in the presence of hardener wastewater, which is typically produced by wooden floor and furniture industries.
Advanced Oxidation Processes (AOPs) are based on the generation of highly reactive species of oxidants, mainly hydroxyl radicals, which are capable of unselectively and quickly oxidizing a wide range of recalcitrant, toxic and non-biodegradable compounds into inert or more biodegradable compounds, or even to promote complete mineralization [10,11,12,13]. The literature[14] refers to ozonation as an intrinsic AOP once °OH generation always occurs within ozonation of natural waters or wastewater, as a product of chain reactions initiated by reaction between O3 and some organic molecules e.g. phenols, secondary and tertiary amines.
Other ways to generate °OH in aqueous media are ozonation under basic conditions [15] and in the presence of UV-C light [11,14]. Besides oxidation via °OH generation (indirect reaction), O3 can also react directly with some inorganic and organic groups (e.g. double
bonds, aromatics, sulfur compounds) [14,16]. Another important characteristic of O3 is its
instability, which makes it impossible to store in tanks, hence demanding in situ generation for ozonation processes. On the other hand, this instability imparts O3 a low residual effect,
once unreacted ozone rapidly decomposes to O2 [17,18].
The main objective of this study was to assess the efficiency of ozone-based AOPs on the treatment of process water from a wood-floor industry, applying processes optimization approach, at the same time, assessing the biodegradability enhancement of the treated effluent in view of coupling AOP with biological treatment in the future.
2 MATERIALS AND METHODS 2.1 Studied wastewater
The wastewater studied was supplied by a wood floor factory located in southeastern of Sweden, with a production ranging from 110,000 to 250,000 m2 of laminate wood floor per
November 24-26, 2014
week. For this study, the wastewater samples were collected after on-site primary treatment in a sedimentation tank that receives wastewater generated by machinery washing (gluing, filling and blade sharpening) and cleaning of the factory floor. This primary treatment step delivers wastewater with COD of approx. 5000 mg L-1 and TOC of approx. 1500mg L-1, from which 200 L of sample were collected onsite and transported to the Linnaeus University laboratory where it was stored at 4°C.
2.2 Chemical analyses
Hach Lange kits (Hach Lange, Dusseldorf) were used to analyze Chemical Oxygen Demand (LCK 114), Total Organic Carbon (LCK 386) and Carbonates (LCK 388) using a DR 5000 UV-Vis Spectrophotometer (Hach Lange, Dusseldorf). The pH was measured with pHmeter Mettler Toledo SG2.
2.3 Ozonation system setup
The system (Figure 1) consists of two reactors: one O3 reactor, built up in stainless steel
(diameter = 8.5 cm, height = 59 cm) equipped with stainless steel diffuser with a 20 µm pore size (length = 8 cm, diameter = 1.9 cm) (SD-3; Ozone Solutions, USA); and one UV reactor, glass-jacket immersion-type (diameter = 10 cm, height = 25 cm) equipped with a medium-pressure 150W lamp (TQ150 UV-Consulting Peschl, Germany). Between the two reactors, continuous recirculation flow was kept by two peristaltic pumps (520SN, Watson-Marlow, United Kingdom) countercurrent to gas. The O3 was generated from 99.5% pressurized
oxygen (O2) by a water-cooled corona discharge ozone generator (ICT-10; Ozone Tech
Systems, Sweden), and its concentration in gas phase was measured by an ozone monitor (BMT 964; BMT Messtechnik GMBH, Germany). Unreacted O3 in the off-gas was destroyed
in a catalytic ozone destructor (OD-0100; Ozone Tech Systems).
Figure 1. Bench-scale O3-based AOP System: (1) O2 pressure tank; (2) O3 generator; (3) O3 reactor; (4) needle valve; (5) O3 monitor; (6) O3 destructor; (7) UV reactor; (8) peristaltic pumps.
In each experiment the system was filled with 2.5 L of wastewater, with predetermined COD and TOC. Samples were collected once the ratio “O3 injected (g)/COD of the batch (g)”
reached 0.25; 0.5; 1.0; 1.5 and 2.0 to 1.0, and left resting for 24 h at 4°C to avoid interference of residual O3 over the subsequent analysis.
2.4 Experimental design
Due to the number of independent variables studied, full-factorial Rotational Central Composite Designs were adopted [19]. For the first treatment, ozonation at natural low pH (O3+pHlow), a 2-variables 5-level design was used (Table 1) with a total of 11 runs, whereas
for the second and third treatments (O3+pHadj and O3/UV+pHadj) a 3-variables 5-level design
was used (Table 2) with a total of 17 runs. For both designs, triplicate of central point was adopted.
Table 1. Variables and levels used in the first treatment: O3 + pHlow
Independent Variables Levels of variables
-1.41 -1 0 +1 +1.41 X1 ([O3]) 40 50.98 77.5 104.02 115
X2 (RF) 0.3 0.7 1.65 2.6 3.0
[O3] = O3 concentration in the feed gas (g/Nm³); RF = recirculation flow between reactors (L min-1)
In the first treatment (O3+pHlow) levels were determined according to equipment capacity,
while in the second and third treatments [O3] levels were based on results from the first
treatment.
Table 2. Variables and levels used in the second and third treatments (O3+pHadj and
O3/UV+pHadj)
Independent Variables Levels of variables
-1.68 -1 0 +1 +1.68 X1 ([O3]) 40 50.13 65 79.87 90
X2 (RF) 0.3 0.85 1.65 2.45 3.0
X3 (pHi) 3.0 4.62 7.0 9.38 11
[O3] = O3 concentration in the feed gas (g/Nm³); RF = recirculation flow between reactors (L min-1); pHi = initial pH of the batch (adjusted)
Statistica 12 software was used for the experimental design and data analysis. The relationships between independent variables and the targeted responses (% COD and % TOC reduction) were analyzed through a model that follows a quadratic pattern described by the following equation: 𝑌𝑌 = 𝛽𝛽0+ � 𝛽𝛽𝑗𝑗𝑋𝑋𝑗𝑗 𝑘𝑘 𝑗𝑗=1 + � 𝛽𝛽𝑗𝑗𝑗𝑗𝑋𝑋𝑗𝑗2 𝑘𝑘 𝑗𝑗=1 + � � 𝛽𝛽𝑖𝑖𝑗𝑗 𝑘𝑘 <𝑗𝑗=2 𝑖𝑖 𝑋𝑋𝑖𝑖 𝑋𝑋𝑗𝑗 + 𝑒𝑒𝑖𝑖
Where: Y is the response; Xi and Xj representcoded independent variables; β is the regression
coefficient; k is the number of factors studied and; e is the random error.
Analysis of variance (ANOVA) was used to determine the existing interactions between independent and dependent variables and their respective significance within 95% of confidence interval (p < 0.05). The fit of the polynomial models was evaluated through the
November 24-26, 2014
coefficient of determination (R2). Statistica 12 software was used for the experimental design and data analysis.
2.5 Respirometry test setup
Respirometry tests were conducted using a pulse-flow headspace respirometer and accompanying software (PF-8000, Respirometer Systems and Applications, Fayetteville, AK, USA) allowing up to 16 simultaneous individual batch tests (Figure 2).
Figure 2. Schematic of respirometer set-up showing eight bottles, instead of the 16 bottles used in the present study. KOH was used as CO2 scrubber.
For each batch test, activated sludge from a municipal wastewater treatment plant was collected and used as inoculum. Once collected, the sludge was aerated for 48 h prior to use to minimize the amount of substrate that was added by the sludge. For all respirometry experiments, 500 mL bottles were used.
The samples submitted to respirometry tests were the ones with highest reduction of COD and TOC in each treatment. Preparation of samples for respirometry followed pH adjustment to 7.0 and dilution with tap water (free of chlorine) to achieve similar TOC concentration in all samples. Tap-water was chosen as the diluent since it would have less effect on the osmotic pressure and it has showed to work well in previous studies conducted by the authors [20]. Samples of 320 mL were added to each bottle with 90 mL of activated sludge. Minerals and nutrients were then added to each bottle to achieve equal conditions for all experiments, minerals and a buffer solution were added according to [21]. All respirometry studies were conducted for 50 h and the oxygen uptake and the oxygen uptake rate (OUR) were registered. The oxygen uptake is measured over time and when summed up it gives the cumulative oxygen consumption; the slope of the cumulative oxygen uptake curve gives the OUR [21].
3 RESULTS AND DISCUSSION
3.1 Effects of independent variables on treatment efficiency
The coefficient of determination of the quadratic theoretical models describing the reduction variation as a function of the selected independent variables were as high as 0.88, 0.74, 0.84 for COD and 0.75, 0.70, 0.83 for TOC for each O3/pHlow, O3/pHadj and O3/UV respectively
independent variables on reduction (in %) of COD and TOC are illustrated through 3D surface plots hereinafter.
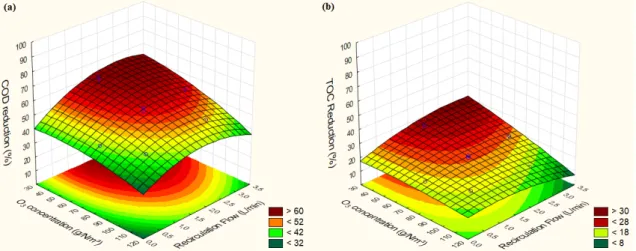
The efficiency of ozonation at natural low pH (O3/pHlow) showed to be affected by both
concentration of O3 supplied in the feed gas (p<0.05, effect= -10.8) and recirculation flow
between reactors (p<0.05, effect= 8.6), being [O3] the variable with stronger influence over %
COD reduction, and the only variable affecting % TOC reduction.
Figure 3. 3D surface plots of COD and TOC reduction (in %) as a function of the independent variables for O3/pHlow.
As can be seen in Figure 3a, the highest reduction of COD was achieved with high recirculation flow (L/min) combined with low concentrations of O3 (g/Nm³). This is likely to
occur due to lower losses of ozone in the off-gas, as slower feeding of oxidant plus higher mixing (high recirculation flow) results in more efficient consumption of O3. This hypothesis
is reinforced by specific O3 consumption models (R² = 0.77 for both COD and TOC)
illustrated in Figure 4, that shows O3 was more efficiently consumed when it is supplied in
November 24-26, 2014
Figure 4. 3D surface plots of specific O3 consumption per COD and TOC reduced (in gO3 consumed/gCOD or g/TOC reduced) as a function of the independent variables for O3/pHlow.
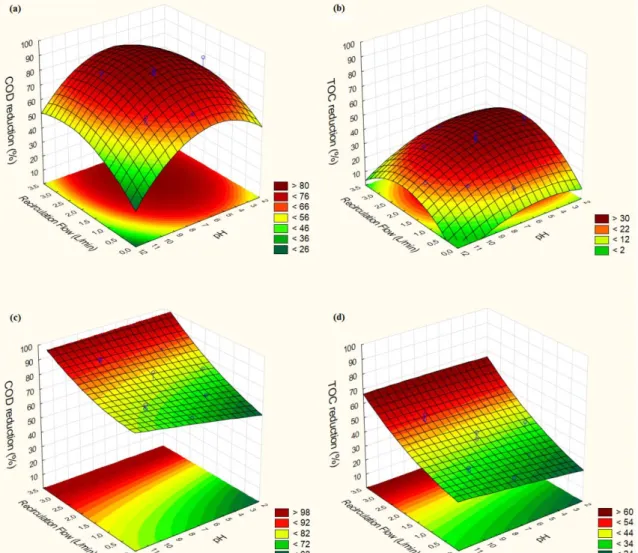
In the treatments with pH adjustment (O3/pHadj and O3/UV), the variable [O3] showed to
exert no significant effect on COD and TOC reduction (p > 0.05). For this reason, the 3D graphs for these experiments are presented only for the significant independent variables (recirculation flow and pH0) as shown in Figure 5.
Figure 5. 3D surface plots of COD and TOC reduction (in %), as a function of the independent variables for O3/pHadj (a, b) and O3/UV (c,d). Graphs (a) and (c) show % COD
reduction, while (b) and (d) show % TOC reduction.
With the treatment O3/pHadj, the COD reduction was significantly affected by both
Recirculation Flow (l/min) (p<0.05, effect = 10.1) and pH0 (p<0.05, effect = -11.2). In the
predicted model for %COD reduction , the quadratic term of the variable pH0 showed to be
significant (data not shown) and to have a negative coefficient value (data not shown), meaning that there is a value of pH0 from which any variation starts to affect the COD
reduction, and Figure 5a shows that this value lies around neutral pH. It is known that higher pH leads to higher generation of °OH from reaction between O3 anions OH-, but in this case
it’s possible that this increase in reaction rate is counteracted by the greater ozone requirement due to loss of oxidants by increased self-decomposition [22] and by increased availability of carbonates, which are strong °OH scavengers [14]. On the other hand, lower efficiency at lower pH can be associated to lower oxidation capacity of O3 direct reactions, since less °OH
is generated, O3 has slower kinetics and attacks selectively specific molecular groups [23, 24]
that may not be abundant in the wastewater under investigation.
The TOC reduction achieved with the O3/pHadj treatment was only significantly affected by
the recirculation flow (p < 0.05, effect = 8.9), showing that though pH0 variation caused some
decay in oxidation potential of the treatment, it makes no significant difference to mineralization potential of the treatment.
For O3/UV treatment, % COD and % TOC reductions were significantly affected only by
Recirculation Flow (p < 0.05, effect = 15.2 and 16.9). Figures 5c and 5d show the clear influence of UV-C exposure (RF) and the way it compensates efficiency decay caused by high and low pH values. It is interesting to notice however, that at neutral pH the amount of O3 consumed per COD reduced (g/g) in the central points (pH = 7) was practically the same,
being ≈ 3,05 without UV and ≈ 3,06 with UV (84.2% and 81.43% COD reduction, respectively), showing that at neutral pH, UV-C irradiation caused no enhancement of % COD reduction at all. For TOC reduction the compensation effect of UV at higher and lower pH also happens, but again less efficiency enhancement is observed at pH=7.
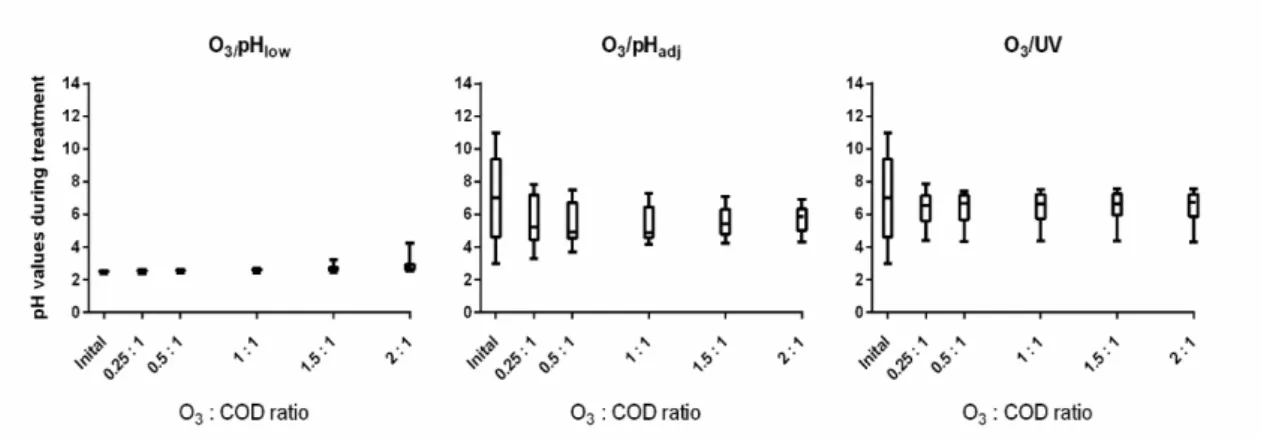
3.2 pH variation along treatment
For O3/pHadj and O3/UV treatment, pH adjustment showed to cause an average increase in
the % COD and % TOC reduction of 24% and 8%. However, it is important to notice that regardless of the wide range tested, there was a clear trend of pH to converge towards an average value with smaller variations. Whereas during the O3/pHlow treatment no variation or
convergence towards an average value was observed (see Figure 6), during the O3/pHadj and
O3/UV treatments, pH0 of 7.0 ± 2.2 shifted to final pH of 5.7 ± 0.8 and 6.5 ± 0.8 respectively,
which corresponded to a shift from 32% of pH0 variation down to 14% in both cases (see
Figure 6).
Figure 1. Development of pH during the treatments. Whiskers show max/min values; the horizontal lines within the boxes indicate the median values.
November 24-26, 2014
This is likely due to the buffer formed from the carbon dioxide (CO2) production when the
carbon is degraded [25,26], which is confirmed by the fact that it is seen for O3/pHadj and
O3/UV, the most effective treatments. Figure 7 shows carbonates concentration development
along the best treatments of O3/pHadj and O3/UV, and confirms that treatment with higher
mineralization capacity also promotes higher buffer effect due to carbonate generation.
Figure 7. Development carbonates concentration, in mgCO2/L, during the best runs of
O3/pHadj ([O3] = 50.13 g/Nm3; VR = 2.45 L/min; pHi = 9.38), and O3/UV ([O3] = 40.0
g/Nm3; VR = 1.65 L/min; pHi = 7.0).
4 RESPIROMETRIC TESTS
In order to verify the possibility of reducing toxic/inhibitory effects after treatment with ozone-based AOPs, activated sludge was exposed to untreated and treated wastewater (effluents from O3/pHlow only, O3/pHadj and O3/UV treatments) and the oxygen up-take rate
was monitored as an indication of biological aerobic activity. The experimental results have shown that ozonation at low pH (O3/pHlow) resulted in increased inhibitory/toxic effects in
comparison to the untreated wastewater. This negative effect decreased when higher dose of O3 was applied (Figure 8). On the other hand, ozonation at neutral pH range (O3/pHadj) and
with the use of UV (O3/UV) the inhibitory/toxicity effects were decreased in comparison to
untreated wastewaters, as indicated by the higher oxygen uptake rates (OURs) observed, mainly when considering the lower dose of O3 (O3/COD of 1:1). With O3/UV treatment,
inhibitory/toxicity effects were the lowest in comparison to untreated wastewaters, with readily available COD as high as 736 mg/l and 673 mg/l with O3/COD of 1:1 and 3:1
respectively, in comparison to readily available COD of 419 mg/l before treatment (Figure 8). Even though O3/pHadj was not as effective as O3/UV, an increase in the readily available
COD was also observed with O3/pHadj, mainly with the O3/COD ratio of 1:1.
Concerning the period that activated sludge took to achieve the peak of oxygen uptake, a much longer period was observed in samples treated at low pH (O3/pHlow) in comparison to
those treated with O3/pHadj or O3/UV. Whereas the peak of oxygen uptake was reached after
39 h (1:1) and 25 h (3:1) in wastewater treated without pH adjustment, it took less than one hour for the microbial metabolic processes to reach its peak in the effluent of O3/pHadj or
O3/UV treatment (Figure 8).
0 50 100 150 200 250 300 350 0 0,5 1 1,5 2 M G CO2 /L O3/CODI O3/pHadj O3/UV
These results suggest the generation of toxic and/or hardly biodegradable oxidation by-products during O3/pHlow treatment, a common effect reported in the literature when applying
O3 treatment at acid pH [27,28,29,30]. On the other hand, the O2 consumption peaks reached
in the initial stages of the biological treatment of the effluent generated by O3/pHadj and
O3/UV treatments indicate the potential use of these treatment configurations before sending
these wastewaters to the MWWTP, since a substantial part of the pollutants in the wastewater could be readily available for microorganisms.
Figure 8. Cumulative oxygen consumption (a, b) and oxygen uptake rate (c, d) per liter of untreated and treated wastewater by O3/pHlow, O3/pHadj and O3/UV [31].
5 CONCLUSIONS
Though ozonation at low pH (O3/pHlow) resulted in reductions of 65% and 31% of COD and
TOC respectively, respirometry tests showed that this is not a proper pre-treatment before discharge to municipal WWTP once increased effluent toxicity could affect the WWTP efficiency. However, results showed that simple pH adjustment to neutral range could make ozonation a feasible pre-treatment, reaching even higher reduction rates (85% for COD and 31% for TOC) and biodegradability enhancement.
It is true that ozonation with pH adjusted and UV irradiation resulted in most effective treatment (93% of COD and 43% of TOC reduction) and that this technique is much less sensitive to possible pH variation of the wastewater, but it is important to realize that enhancements caused by UV, both in biodegradability enhancement and COD and TOC
November 24-26, 2014
reduction, may not justify the electricity consumption of UV lamps. Under these circumstances, it is likely that for this wastewater the better pre-treatment option would be single ozonation under neutral pH.
REFERENCES
[1] Svensson, H., 2014. Characterization, toxicity and treatment of wood leachate generated outdoors by the wood-based industry. Ph.D. Thesis in Environmental Science, Linnaeus University, Kalmar. 37p plus papers.
[2] Pokhrel, D., Viraraghavan, T., 2004. Treatment of pulp and paper mill wastewater - a review.
The Science of the Total Environment. 333, 37-58.
[3] Balcioğlu, I. A., Tarlan, E., Kivilcimdan, C., Saçan, M. T., 2007. Merits of ozonation and catalytic ozonation pre-treatment in the algal treatment of pulp and paper mill effluents. Journal of Environmental Management. 85, 918–926.
[4] Bierbaum, S., Öeller, H-J., 2009. Cost Savings in the Ozone Treatment of Paper Mill Effluents Achieved By a Closed-Loop Ozone Control System. Ozone: Science & Engineering. 31, 454-460.
[5] Laohaprapanon, S., Kaczala, F., Salomon, P. S., Marques, M., and Hogland, W., 2012. Wastewater generated during cleaning/washing procedures in a wood-floor industry: toxicity on the microalgae Desmodesmus subspicatus. Environmental Technology. 33, 2439-2446. [6] Kaczala, F., Marques, M., and Hogland, W., 2010. Biotreatability of wastewater generated
during machinery washing in a wood-based industry: COD, formaldehyde and nitrogen removal. Bioresource Technology. 101, 8975-8983.
[7] Laohaprapanon, S., Marques, M., and Hogland, W., 2010. Removal of Organic Pollutants from Wastewater Using Wood Fly Ash as a Low-Cost Sorbent. CLEAN - Soil, Air, Water. 38, 1055-1061.
[8] Hansson, H., Marques, M., Laohaprapanon, S., Hogland, W., 2014. Electrocoagulation coupled to activated carbon sorption/filtration for treatment of cleaning wastewaters from wood-based industry. Desalination and Water Treatment. 52, 5243-5251.
[9] Laohaprapanon, S., Marques, M., and Hogland, W., 2013. Anaerobic baffled reactor coupled with chemical precipitation for treatment and toxicity reduction of industrial wastewater. Environmental Technology. 35, 154-162.
[10] Comninellis, C., Kapalka, A., Malato, S., Parsons, S. A., Poulios, I., Mantzavinos, D., 2008. Advanced oxidation processes for water treatment: advances and trends for R & D. Journal of Chemical Technology and Biotechnology. 83, 769-776.
[11] Gottschalk, C., Libra, J. A., Saupe, A., 2009. Ozonation of Water and Waste Water: A Practical Guide to Understanding Ozone and its Applications (2nd Edition), Hoboken, NJ, USA: Wiley-VCH.
[12] Durán-Moreno, A., García-González, S. A., Gutiérrez-Lara, M. R., Rigas, F., Ramírez-Zamora, R. M., 2011. Assessment of Fenton's reagent and ozonation as pre-treatments for increasing the biodegradability of aqueous diethanolamine solutions from an oil refinery gas sweetening process. Journal of Hazardous Materials. 186, 1652-1659.
[13] Feng, L., van Hullebusch, E. D., Rodrigo, M. A., Esposito, G., Oturan, M. A., 2013. Removal of residual anti-inflammatory and analgesic pharmaceuticals from aqueous systems by electrochemical advanced oxidation processes. A review. Chemical Engineering Journal. 228, 944-964.
[14] Sievers, M., 2011. Advanced Oxidation Processes. Earth Systems and Environmental Sciences: Treatise on Water Science. 4, 377-404.
[15] Kurniawan, T. A., Lo, W.-H., Chan, G. Y. S., 2006. Radicals-catalyzed oxidation reactions for degradation of recalcitrant compounds from landfill leachate. Chemical Engineering Journal. 125, 35-57.
[16] Lucas, M. S., Peres, J. A., Puma, G. L., 2010. Treatment of winery wastewater by ozone-based advanced oxidation processes (O3, O3/UV and O3/UV/H2O2) in a pilot-scale bubble column reactor and process economics. Separation and Purification Technology. 72, 235-241. [17] Preethi, V., Kalyani, K. S. P., Iyappan, K., Srinivasakannan, C., Balasubramaniam, N.,
Vedaraman, N. 2009. Ozonation of tannery effluent for removal of cod and color. Journal of Hazardous Materials. 166, 150-154.
[18] Pophali, G. R., Hedau, S., Gedam, N., Rao, N. N., Nandy, T., 2011. Treatment of refractory organics from membrane rejects using ozonation. Journal of Hazardous Materials. 189, 273-277.
[19] Rodrigues, M. I., Iemma, A. F., 2009. Planejamento de experimentos & otimização de processos. 2nd ed. Campinas: Casa do Espírito Amigo Fraternidade Fé & Amor, 358p.
[20] Svensson, H., Hansson, H., Hogland, W., 2014. Determination of Nutrient Deficiency in Stormwater from the Wood Industry for Biological Treatment. CLEAN – Soil, Air, Water.
DOI: 10.1002/clen.201300621 online.
[21] Young, J. C., Cowan, R. M., 2004. Respirometry for Environmental Science and Engineering: SJ Enterprises.
[22] Alvares, A. B. C., Diaper, C., Parsons, S. A., 2001. Partial Oxidation by Ozone to Remove Recalcitrance from Wastewaters - a Review. Environmental Technology. 22, 409-427.
[23] Hoigné, J., Bader, H., 1983a. Rate constants of reactions of ozone with organic and inorganic compounds in water—I: non-dissociating organic compounds. Water Research, 17, 173–183. [24] Hoigné, J., Bader, H., 1983b. Rate constants of reactions of ozone with organic and inorganic
compounds in water—II: dissociating organic compounds. Water Research, 17, 185–194. [25] Panizza, M., Bocca, C., Cerisola, G., 2000. Electrochemical treatment of wastewater
containing polyaromatic organic pollutants. Water Research. 34, 2601-2605.
[26] Vlyssides, A. G., Loizidou, M., Karlis, P. K., Zorpas, A. A., Papaioannou, D., 1999. Electrochemical oxidation of a textile dye wastewater using a Pt/Ti electrode. Journal of Hazardous Materials. 70, 41-52.
[27] Petala, M., Samaras, P., Zouboulis, A., Kungolos, A., Sakellaropoulos, G. P. 2008. Influence of ozonation on the in vitro mutagenic and toxic potential of secondary effluents. Water Research. 42, 4929–4940.
[28] Rosal, R., Gonzalo, M. S., Boltes, K., Letón, P., Vaquero, J. J., García-Calvo, E., 2009. Identification of intermediates and assessment of ecotoxicity in the oxidation products generated during the ozonation of clofibric acid. Journal of Hazardous Materials. 172, 1061– 1068.
[29] Souza, S. M. A. G. U., Bonilla, K. A. S., Souza, A. A. U., 2010. Removal of COD and color from hydrolyzed textile azo dye by combined ozonation and biological treatment. Journal of Hazardous Materials. 179, 35–42.
[30] Illés, E., Szabó, E., Takács, E., Wojnárovits, L., Dombi, A., Gajda-Schrantz, K., 2014. Ketoprofen removal by O3 and O3/UV processes: Kinetics, transformation products and ecotoxicity. The Science of the Total Environment. 472, 178–184.
[31] Hansson, H. 2014. Treatment of wastewater generated by wood-based dry industries: Advanced Oxidation Processes and Electrocoagulation. 2014. PhD Thesis (Environmental Science) - Linnaeus University.


![Figure 7. Development carbonates concentration, in mgCO 2 /L, during the best runs of O 3 /pH adj ([O 3 ] = 50.13 g/Nm 3 ; VR = 2.45 L/min; pHi = 9.38), and O 3 /UV ([O 3 ] = 40.0 g/Nm 3 ; VR = 1.65 L/min; pHi = 7.0)](https://thumb-eu.123doks.com/thumbv2/5dokorg/3685769.45524/9.892.203.693.232.495/figure-development-carbonates-concentration-mgco-best-runs-phi.webp)
![Figure 8. Cumulative oxygen consumption (a, b) and oxygen uptake rate (c, d) per liter of untreated and treated wastewater by O 3 /pH low , O 3 /pH adj and O 3 /UV [31]](https://thumb-eu.123doks.com/thumbv2/5dokorg/3685769.45524/10.892.134.760.292.755/figure-cumulative-consumption-oxygen-uptake-untreated-treated-wastewater.webp)
