Technical Note
Further modelling and sensitivity study using
the GEMA-Site “alternative biosphere models”
and review of material from SKB’s RFI response
Main Review Phase
2015:22
SSM perspektiv
Bakgrund
Strålsäkerhetsmyndigheten (SSM) granskar Svensk Kärnbränslehantering AB:s (SKB)
ansökningar enligt lagen (1984:3) om kärnteknisk verksamhet om uppförande,
inne-hav och drift av ett slutförvar för använt kärnbränsle och av en inkapslings anläggning.
Som en del i granskningen ger SSM konsulter uppdrag för att inhämta information
och göra expertbedömningar i avgränsade frågor. I SSM:s Technical note-serie
rap-porteras resultaten från dessa konsultuppdrag.
Projektets syfte
Det övergripande syftet med projektet är att utföra modellerings jämförelser mellan
alternativa biosfärsmodeller och SKB:s LDF modeller för att undersöka osäkerheten i
nyckelparametrar, huvudsakligen flödesfaktorer, objekts storlek och alternativa
data-värden för Kd och CR.
Författarens sammanfattning
Denna rapport har upprättats som en del av SSM:s huvudgranskning av SKB:s
säker-hetsanalys av den långsiktiga säkerheten för KBS-3 (SR-Site), en geologisk
slutförvars-anläggning, som SKB planerar uppföra i Forsmark. Granskningen tar upp de metoder
som används för dosberäkningar i SR-Site, speciellt vad gäller transporter,
ackumule-ring och överföackumule-ring av radionuklider i ytnära miljö och på vilka sätt doser till framtida
populationer av människor och djur kan uppstå.
Tidigare forsknings- och granskningsrapporter (Kłos, m.fl., 2014a; Kłos och Wörman,
2015) har fokuserat på den metod som SKB valt för att modellera radionuklidtransport
och ackumulation i biosfären och har även beskrivit utvecklingen och tillämpningen
av en alternativ dosmodell - GEMA-Site som utformades för att matcha kapaciteten hos
SKB:s SR-Site modell som används för att generera s.k. Landskap Dos Faktorer (LDF).
LDF används av SKB för att skala utsläpp från geosfären för att uppskatta potentiella
framtida radiologiska effekter av utsläppen från det planerade slutförvaret.
Denna rapport fokuserar på tre frågor i detalj:
• Den tidigare granskningen (Kłos, m.fl., 2014a) ledde till att SSM skickade en begäran
om ytterligare information (RFI) till SKB för att få klargörande detaljer om SR-Site
modelleringen. SKB:s svar på dessa RFI granskas här.
• Tillämpningen av GEMA-Site i en känslighetsanalys för att bestämma vilka de
vikti-gaste parametrarna är som påverkar dosen i biosfärsmodelleringen.
• Jämförelse av resultat från GEMA-Site med de numeriska resultaten från SR-Site
LDF.
RFI formulerades med avsikten att informationen skulle kunna användas för att bättre
karaktärisera hydrologiutvecklingen i bassänger som sannolikt kommer att utvecklas i
det framtida Forsmarkslandskapet. Radionuklidtransportmodellen i SR-Site bygger på
en genomsnittlig hydrologi baserad på hydrologin i sex sjöar i dagens terrestra
bio-sfär, och på uppskattade flöden år 5000 AD framtagna utifrån resultat från MIKE-SHE
modellering.
Den begärda kompletterade informationen besvarade de flesta frågorna, men
analy-sen av flödessystemen för de sex sjöarna vid tidpunkterna 2000, 3000 respektive
5000 AD gav inte någon tydlig bild av hur hydrologin utvecklas i systemet. I
rappor-ten konstateras därför att tillgång till MIKE-SHE resultat på djupare nivå behövs för
att bättre kunna formulera en adekvat representation av utvecklingen av hydrologin
i systemet.
GEMA-Site modellen har använts för att utföra en serie känslighetsanalyser.
Analy-serna (PSA) har genomförts med hjälp av sannolikhetsfördelningsfunktioner från
SR-Site dokumentationen med information om fysiska egenskaper hos aktuell
bassäng tolkade utifrån den platsbeskrivande modelleringen i SR-Site.
Slutsatserna från den här sista delen av huvudgranskningen är:
1. Kombinationen av de sex olika sjöarna i SR-Site för att generera ett
”genom-snittligt objekt” är varken försvarbar eller reproducerbar;
2. Resultat från känslighetsanalysen visar att bassängernas geometri spelar en stor
roll för dosuppskattningen;
3. Bättre integration av detaljer i grundvattenmodelleringen (till exempel med hjälp av
MIKE-SHE) krävs för att radionuklidtransportmodellen ska ge en mer rätt visande
och fullständig beskrivning av viktiga delar av hydrologin som påverkar dos;
4. De statistiska resultaten från tillämpningen av GEMA-Site tyder på att LDF för
radionuklider med låga kd värden sannolikt inte kommer att vara underskattade
men att LDF för radionuklider med högre kd värden, särskilt de i
226Ra kedjan
(inklusive
210Pb och särskilt
210Po) kan vara underskattade, potentiellt några
stor-leksordningar, beroende på antaganden om exploatering av lokala vattenresurser.
5. De LDF värden som redovisas i SR-Site är lämpliga för det ändamål som de är
avsedda för. Men det finns reservationer beträffande LDF värden för radionuklider
med högre k
dvärden och de är relaterade till tolkningen av hydrologin i bassängen
(inklusive antaganden om vattenanvändning). Framtida säkerhetsutvärderingar bör
använda en förbättrad tolkning av vattenflöden och det bör finnas en bättre
inte-grering av resultaten från MIKE-SHE liknande modeller.
Projekt information
SSM perspective
Background
The Swedish Radiation Safety Authority (SSM) reviews the Swedish Nuclear Fuel
Company’s (SKB) applications under the Act on Nuclear Activities (SFS 1984:3) for the
construction and operation of a repository for spent nuclear fuel and for an
encapsu-lation facility. As part of the review, SSM commissions consultants to carry out work in
order to obtain information and provide expert opinion on specific issues. The results
from the consultants’ tasks are reported in SSM’s Technical Note series.
Objectives of the project
The general objective of the project is to perform modelling comparison between
alternative biosphere models an SKB’s LDF modelling approach to explore
uncertain-ties in key parameters, mainly, flow scaling factors, basin size, and alternative data
values for Kds and CRs.
Summary by the author
This report has been prepared as part of the SSM’s Main Review Phase of SKB’s
SR-Site performance assessment of the long-term safety of the KBS-3 geological
disposal facility (GDF) proposed for construction at Forsmark. The review addresses
the methodology employed in the dose assessment calculations of SR-Site;
specifi-cally issues of transport, accumulation and transfers of radionuclides in the near
surface envi ronment and the way in which doses to future human and non-human
populations can arise.
Earlier reports have focussed on the approach taken by SKB to model radionuclide
transport and accumulation in the biosphere and have described the development
and application of an alternate dose assessment model – GEMA-Site – designed to
match the capabilities of the SR-Site dose assessment model as used to generate the
Landscape Dose Factors (LDFs) that SKB use to scale release from the geosphere in
order to estimate potential future radiological impact of the release from the planned
repository.
This final report considers three issues in greater detail
• The earlier review prompted the SSM review team to send Requests for Further
Information (RFIs) to SKB in order to clarify details of the SR-Site modelling. SKB’s
response to these RFIs is reviewed here.
• The application of GEMA-Site in a sensitivity analysis to determine the key
parameters influencing dose in the biosphere dose assessment.
• Comparison of results from GEMA-Site with the numerical results SR-Site LDFs.
The RFIs were formulated with the intention of used the response to better
charac-terise the evolving hydrology within basins likely to develop in the future Forsmark
landscape. The SR-Site radionuclide transport model is based on an average of the
hydrology of six lakes in the present-day terrestrial biosphere, using fluxes estimated
at the year 5000 CE in results from the MIKE-SHE hydrological modelling code.
Most of the requested details were forthcoming but analysis of the flow systems for the
six lakes at each of 2000, 3000 and 5000 CE did not provide a clear indication of the
evolution of the system. It was concluded that access to the deeper level MIKE-SHE
results is needed to better formulate an adequate representation of the evolving system.
The GEMA-Site model was used to carry out a series of probabilistic sensitivity. The
analyses (psa) were executed using probability distribution functions from the SR-Site
documentation with details of physical characteristics of the basin interpreted from
the site-descriptive modelling in SR-Site.
Conclusions from this final part of the main phase review study are:
1. The combination of the six different lakes in SR-Site to generate an “average
object” is neither justifiable nor reproducible;
2. Results from the sensitivity analysis indicate that the geometry of basins plays
a large role in determining dose;
3. Better integration of details of groundwater modelling (for example, using
MIKE-SHE) is required so that the radionuclide transport model provides a more
accu-rate and comprehensive expression of key parts of the hydrology that influence
dose;
4. The statistical results from the application of GEMA-Site suggest that the LDFs for
low k
dradionuclides are not likely to be underestimates but that doses from higher
k
dradionuclides, particularly the
226Ra chain (including
210Pb and
210Po explicitly)
might be underestimates, potentially by some orders of magnitude, depending on
assumptions for exploitation of local water resources.
5. The LDFs reported in SR-Site are suitable for the purpose for which they are
intended. There are reservations concerning the LDFs for higher kd radionuclides
and these are related to the interpretation of basin hydrology (including
assump-tions for water usage). Future assessments should use an improved interpretation
of water fluxes and there should be better integration of results from
MIKE-SHE=class models.
Project information
2015:22
Author: Ryk Kłos
Aleksandria Sciences Ltd, Sheffield, United Kingdom
Further modelling and sensitivity study using
the GEMA-Site “alternative biosphere models”
and review of material from SKB’s RFI response
Main Review Phase
This report was commissioned by the Swedish Radiation Safety Authority
(SSM). The conclusions and viewpoints presented in the report are those
of the author(s) and do not necessarily coincide with those of SSM.
Contents
1. Introduction ... 2
2. Requests for Further Information and SKB’s response ... 4
2.1. Summary of requirements ... 4
2.2. Interpretation of SKB’s RFI response ... 4
2.2.1. Parameterisation of water fluxes ... 4
2.2.2. Reconstructing the "average object" fluxes ... 6
2.2.3. Evolution of ecosystems – areas within the basin ... 6
2.3. Discussion and summary... 12
3. Overview of the GEMA-Site model ... 14
3.1. Key features ... 14
3.2. GEMA-Site for probabilistic sensitivity analyses ... 18
4. Probabilistic Sensitivity Analysis results ... 21
4.1. Implementation ... 21
4.2. Analysis ... 21
4.2.1. Rank Correlation Coefficients (RCC)... 21
4.2.2. Interpretation of results ... 23
5. Synthesis - uncertainties in the SR-Site dose assessment modelling 26 5.1. Overall uncertainty ... 26
5.2. Sources of uncertainty ... 27
5.2.1. Transition to agriculture ... 27
5.2.2. Basin geometry ... 29
5.2.3. Use of water resources ... 31
5.3. Discussion ... 32 6. Conclusions... 36 7. References ... 38 APPENDIX 1 ... 40 APPENDIX 2 ... 41 APPENDIX 3 ... 50
1. Introduction
In 2011 the Swedish Nuclear Fuel and Waste Management Company (SKB) submit-ted an assessment of the long-term safety of a KBS-3 geological disposal facility (GDF) for the disposal of spent nuclear fuel and high level radioactive waste in For-smark, Sweden. This assessment, the SR-Site project, supports the licence applica-tion of SKB to build such a final disposal facility.
The initial phase of SSM’s review of SR-Site by the Swedish Nuclear Fuel and Waste Management Company (SKB) was completed at the end of 2013. SSM con-cluded that SKB’s reporting was sufficiently comprehensive and of sufficient quality to justify a continuation of SSM’s review to the main review phase. While the over-all goal of the initial review phase was to identify issues for deeper review with a broad coverage of SKB’s safety assessment, assignments carried out during the main review phase are targeted on tasks and issues prioritized by SSM with the intention to indirectly or directly support SSM’s compliance judgements. This includes de-tailed analysis of a range of specific issues for which SSM has judged that further input from SSM’s external experts would be helpful.
The task reported here constitutes a further and deeper evaluation of the suitability of SKB’s biosphere dose assessment model through comparison with the alternative biosphere modelling approach developed in the preliminary stage (Kłos et al., 2014a). Both analysis and review have been undertaken as part of the task. The anal-ysis involved implementation of the GEMA-Site alternative biosphere dose assess-ment model (Kłos, 2015) that focused on alternate interpretations of the most im-portant transport and accumulation processes. This is carried out as a sensitivity study to determine the model parameters having the most impact on the Landscape Dose Factor (LDF) used by SKB to determine the radiological impact of release to the biosphere in SR-Site.
The review element of this task involves an interpretation of the information re-quested from SKB by SSM at the end of the initial phase of the review. This mate-rial concerns interpretation of the hydrological parameterisation of surface water flows in the regolith in the Forsmark region. Material in the relevant SR-Site reports:
Landscape dose model – SKB report TR-10-06 (Avila et al., 2010) Element and radionuclide specific data, SKB Report TR-10-07 (Nordén et
al., 2010),
Terrestrial ecosystems description – SKB Report TR-10-01; Löfgren, 2010, Limnic ecosystems description – SKB Report TR-10-02; Andersson, 2010, Landscape description – SKB Report TR-10-05 (Lindborg, 2010) and Surface hydrological description – SKB Report R-10-02 (Bosson et al.,
2010)
was found to be insufficient and a detailed Request for Further Information (RFI) was submitted to SKB. Appendix 1 lists the RFI and appendix 2 is a compilation and summary if SKBs response. Accordingly, the material reported here is broken down as follows.
Chapter 2 – Review and discussion of SKB’s RFI response
Chapter 3 – Summary and conceptual discussion of the GEMA-Site (alter-nate) model used in the probabilistic sensitivity study reported in Chapter 4, including a description of the updates required for the probabilistic model-ling
Chapter 4 – Results and discussion of the sensitivity study carried out using the GEMA-Site model
Chapter 5 brings together the elements of the review to assess the potential uncertainty in the calculated LDFs and discusses the sources if uncertainty. Focus here is upon four of the five radionuclides which contributed most to the cal-culated annual effective human dose presented by SR-Site for the shear failure sce-nario (SKB, 2011): 79Se, 94Nb, 129I and 226Ra. (the fifth - 14C is reviewed separately as the modelling approach used is less dependent on the hydrological interpretation of the sites.)
2. Requests for Further Information and
SKB’s response
2.1. Summary of requirements
The near surface hydrology is the main driver of the radionuclide transport model. The parametrisation of the hydrological description in Bosson et al., (2010) was based on detailed MIKE-SHE modelling of past, present and future conditions at the site. Data from six lakes in the present-day terrestrial landscape were then used to determine the characteristics “average object” in the landscape that was carried for-ward to the parameterisation used in the Avila et al. radionuclide transport model. Although details for “snapshots” of the hydrology at several timepoints were availa-ble, the flux map used in the transport calculations used only the results at 5000 CE. Bosson et al. (2010) is a comprehensive report, including some description of the MIKE-SHE model. Given the scope of the main-phase review, however, the focus has been on understanding the origin of details translated to the dose assessment modelling. In terms of the structure of Bosson et al., this means that the discussions in Chapter 8, detailing the information delivered to the dose calculations has been of prime concern. It is here that the definition of the average lake-mire object is psented. The detailed MIKE-SHE results (Chapters 5 to 7) have, consequently, re-ceived less attention.
Nevertheless, there is a great deal of information potentially available from the MIKE-SHE modelling. Water balance for each of the six lakes used to describe the “average object” could have been evaluated at any time. It is implicit that similar in-formation could have been provided for any basin at any time but that only results these six lakes and the three times had been calculated and so were readily available for further investigation.
The request for the water fluxes for each of the six lakes at three times was intended to allow the evolutionary sequence of the different lakes to be understood and to de-termine if the six lakes were sufficiently representative that the “average object” had practical utility in describing features in the landscape. The requests set out in Ap-pendix 1, and the response (ApAp-pendix 2) were only partially successful in this. Nev-ertheless some useful insight into the translation of site-descriptive detail into the dose assessment model has been gained.
2.2. Interpretation of SKB’s RFI response
2.2.1. Parameterisation of water fluxes
The justification for the parameterisation of key water fluxes in the radionuclide transport model was raised in the first part of the main phase review (Kłos et al., 2014a). The request for detailed reasoning behind the parameterisation was not an-swered in the RFI response. The response stated that a detailed response would be provided by September 2014. At time of completing this report the material has not been forthcoming. Confidence in the SR-Site radionuclide transport model is there-fore not as high as might be.
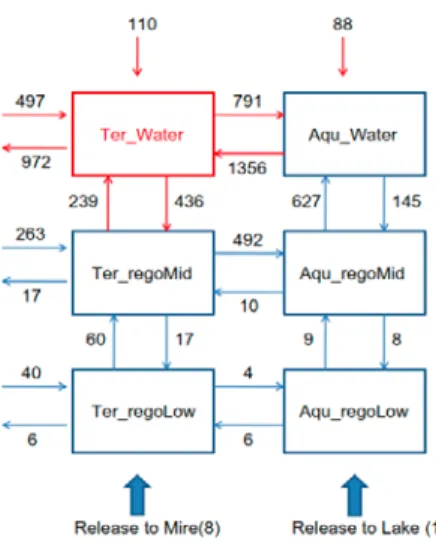
(a) SR-Site model, taken from TR-10-06 (Avila et al. (2010)
(b) Excel implementation of the same data showing mass balance
(c) Average for the six lakes at 5000 CE
Figure 1: Water fluxes maps for the representative object in the SR-Site radionuclide transport model. “Average object” derived by Bosson et al. (2010). The Excel format illus-trates balance for each of the compartments in the model’s structure. Also shown is the same scheme derived from the average of the six lakes at 5000 CE (See Appendix 2).
geosphere sub-catchment Ter_ regoLow Ter_ regoMid Ter_ Water Aqu_ regoLow Aqu_ regoMid Aqu_ Water Atm Down- stream
geosphere 7 3 sub- catchment 40 263 497 Ter_ regoLow 60 4 6 Ter_ regoMid 17 239 492 17 Ter_ Water 436 791 972 Aqu_ regoLow 6 9 Aqu_ regoMid 10 8 627 Aqu_ Water 1356 145 Atm 110 88 Upstream Inflow 0.0 0.0 70.0 769.0 2202.0 15.0 646.0 1506.0 0.0 995.0 Outflow 10.0 800.0 70.0 765.0 2199.0 15.0 645.0 1501.0 198.0 0.0 Balance -10.0 -800.0 0.0 4.0 3.0 0.0 1.0 5.0 -198.0 995.0
geosphere sub-catchment Ter_ regoLow Ter_ regoMid Ter_ Water Aqu_ regoLow Aqu_ regoMid Aqu_ Water Atm Down- stream
geosphere 8.5 1.0 sub- catchment 40.0 487.7 603.0 Ter_ regoLow 66.7 4.0 11.5 Ter_ regoMid 27.5 400.3 544.8 27.5 Ter_ Water 441.3 729.2 1275.5 Aqu_ regoLow 6.0 7.7 Aqu_ regoMid 5.2 8.7 649.5 Aqu_ Water 1320.3 110.7 Atm 137.7 61.8 Upstream Inflow 0.0 0.0 82.0 1000.8 2461.3 13.7 663.2 1440.5 0.0 1314.5 Outflow 9.5 1130.7 82.2 1000.2 2446.0 13.7 663.3 1431.0 199.5 0.0 Balance -9.5 -1130.7 -0.2 0.7 15.3 0.0 -0.2 9.5 -199.5 1314.5
2.2.2. Reconstructing the "average object" fluxes
Water fluxes in the TR-10-06 radionuclide transport model (Avila et al. 2010) are all quoted in terms of mm year-1. The water fluxes used in the transport model are illus-trated in Figure 1, as taken from Bosson et al. (2010) with the reconfiguration into Excel so as to better illustrate mass balance in the modelled system. Also illustrated is the same detail translated to Excel to assess mass balance in the average object". The “average object” is reported as having been generated by combining the veloci-ties generated by the MIKE-SHE mass balance tool from the six objects cited in Ap-pendices 1 and 2 at 5000 CE to give an average scheme (page 304 of Bosson et al.). This is then assumed to be representative of objects in the landscape as a whole. Fig-ure 1 also shows the balance scheme for the average of the six objects at 5000 CE using the data in SKB’s response. There are noticeable differences in the numerical values and while the balance figures used by SKB are not perfect, the combined re-sults from Appendix 2 where the SKB data have been reanalysed for this report, are further from balance. It has not been possible to reproduce the numerical details of the water balance in the “average object” as used in SR-Site. The method used to produce the “average object” remains obscure.
2.2.3. Evolution of ecosystems – areas within the basin
A criticism of the approach taken by SKB to modelling the hydrology of basins in the future landscape is that the flux maps (such as Figure 1) do not change as the system evolves. This is potentially a key difference between the SKB radionuclide transport model and GEMA-Site. One of the aims of the RFIs was to understand the evolution of the system both in terms of water fluxes as well as changes to the areas within the basins that are classed as terrestrial and aquatic ecosystems.
Figure 1 illustrates that the SKB approach used advective velocities rather than fluxes. Kłos et al. (2014a) noted the importance of understanding the fluxes and the areas involved. This was the reason for the request that both velocities and fluxes be provided. Also requested were details of how the terrestrial and aquatic areas changed as the lake/mire system evolved.
Although the Request 1 clearly stated that areas of catchment, lake, mire and lake + mire should be provided at the three times 2000 CE, 3000 CE and 5000 CE, data for only a single time were provided (2010 CE), as were reported in the original Bosson
et al. report. This suggests either that the information was not available or that the
areas did not change significantly during the relatively short period from 2000 CE to 5000 CE. Nevertheless, since the velocities and fluxes are related by Fij A v , norm ij
the normalising area between each compartment can be found. Using the flux and velocity maps shown at the end of Appendix 2 it is possible to determine how the terrestrial and aquatic areas change in time for each of the six lakes. To do so re-quires setting some rules-of-engagement, concerning what may be assumed: 1. Each basin in the landscape is defined by its topographic boundary. Effectively
this boundary is the watershed between basins. Sedimentation does not change the boundaries between basins. The total area of each of the basins is constant. 2. Precipitation (P) and evapotranspiration (E) in the calculations are constant are 560 mm year-1 and 410 mm year-1 respectively. The values in the Chapter 8 of Bosson et al. (2010) are P = 560 mm year-1, E = 400 to 410 mm year-1 and these are the values used here. Net “runoff” (the difference P – E) is 150 to 160 mm year-1. In the regional groundwater modelling with MIKE-SHE the values were
583 and 410 mm year-1. The reason for this difference is not immediately clear and it may also be noted that the net infiltration at the surface of the terrestrial and aquatic objects in Figure 1 does not correspond to any of the figures. This is why working with volumetric fluxes is more reliable and transparent.
3. Total inflow to terrestrial side is runoff from outer basin (sub-catchment):
,
totTer in subCatch subCatch subCatch subCatch
terLow terMid terWat
F F F F P E A
Referring to Figure 1, the terrestrial and aquatic areas are explicit (with surface areas AterrWat m2 and AaquWat m2 respectively. These areas correspond broadly to wetland and lake ecosystems at the lower elevations of the basin’s topography. Implicit therefore is the area of the rest of the basin – the sub-catchment in SKB’s terminology, with area AsubCatch m2. The total accumulated infiltration in the sub-catchment is conserved and partitioned into flows to the terrestrial lower, mid- and upper regolith compartments.
4. Input to terrestrial and aquatic water reflects difference in area,
atm terrWat terrWat F P E A , atm
aquWat aquWat F P E A5. As a compartment description, the “average object” model implies a similar re-lation for the base of the regolith:
geo geo terrWat terLow
F v A , geo geo aquWat
aquLow
F v A ,
where the advective velocity at the base of the basin is v mm yeargeo -1. 6. Since
loss geo geo subCatch atm atm
terLow aquLow aquWat terWat
basin geo geo terLow aquLow
F F F F F F
P E A F F ,
the total basin area is given by
loss geo geo
terLow aquLow basin
F F F
A
P E .
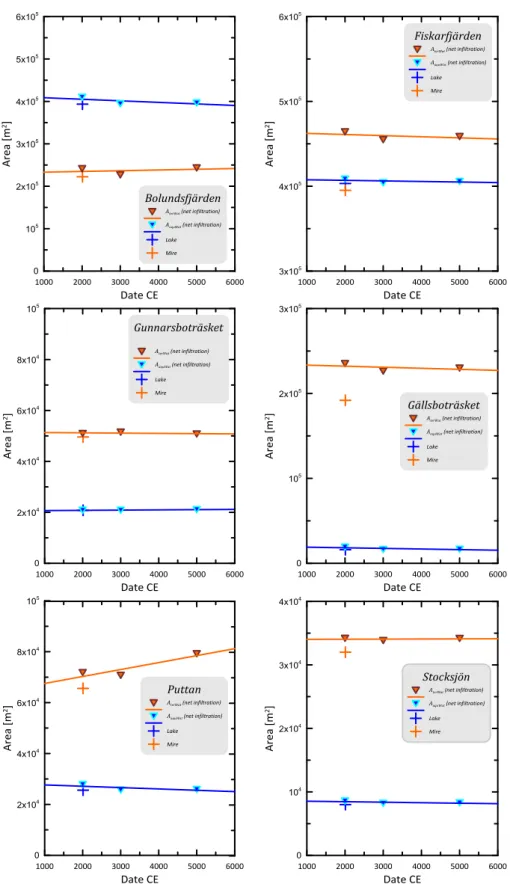
Figure 2: Lakes in the present-day terrestrial landscape near the Forsmark site. Taken from Bosson et al., Figure 8-3, with (inset) area data taken from Table 8-1.
Bolundsfjärden Fiskarfjärden
Gunnarsboträsket Gällsboträsket
Puttan Stocksjön
Figure 3: Comparison of derived areas for the six lakes at three times. also shown are the figures cited in Avila et al. (2010) for total catchment and lake, mire and lake + mire.
This method allows all the areas to be estimated and also allows for consistency checks. The lakes included in the definition of “average hydrology” are shown in Figure 2. Figure 3 illustrates the calculated areas for terrestrial, aquatic and terres-trial and aquatic combined. As these are derived from fluxes at both the upper and lower boundaries, a range is implied. The derived values are compared with the nu-merical values taken from Bosson et al. (2010).
Given the multiple steps separating the MIKE-SHE details and the derivation of ar-eas, the results are informative. Three of the lakes have total catchment and derived basin sizes broadly consistent (Fiskarfjärden, Gällsboträsket, Puttan) and three have Total Catchment > derived basin size (Bolundsfjärden, Gunnarsboträsket,
Stocksjön).
The “good” lakes, where the estimated basin area is similar to the quoted area, have limited upstream inflow (from outside the basin), Puttan & Fiskarfjärden appear to have none and Gällsboträsket seems to have stream inputs that are likely to be small compared to the total basin. In contrast, Bolundsfjärden has input from both
Gälls-boträsket and Stocksjön, complicated by the inflow to the small Stocksjön being
aug-mented by the outflow a much larger large lake (unnamed) to the southwest of
Stocksjön itself (see Figure 2). The source of water flows into Gunnarsboträsket
ba-sin is not clear. Cases where the area estimated from the total throughflow is larger than the “total catchment” imply that the lake’s basin does not provide all the water discharged from the basin. In such cases the “excess” flow is in the stream dis-charge.
The main hope for the RFI responses was that the evolution of the flow systems for the six lakes would be discernible in the results for the three times. Figure 4 shows the evolutionary trends of the sizes of the derived areas for lake and mire. A linear fit is included. The results indicate that there is little change to the areas. Only for
Puttan is there are clear trend (below) with the area of the wetland increasing and
the area of open water decreasing. The gradients (linear fits) are, respectively, 2.7 m2 year-1 and -0.53 m2 year-1. For Bolundsfjärden there are small gradients: 1.7
m2 year-1 and -3.7 m2 year-1 for mire and lake respectively. These are the two lakes closest to the shoreline at 2010 CE and it might be expected that the rates of change decrease with age from isolation and with profile. The other four lakes show barely discernible gradients that, in some have, show the opposite trend to what might be expected in that the lake area increases and the mire shrinks. Clearly there are diffi-culties in interpreting the data as used for the lakes’ water balance.
The flux map in Figure 1 shows that SKB divide their model into aquatic and terres-trial parts. These are the parts where radionuclides released from the bedrock can ac-cumulate and so give rise to dose. The “outer” basin (sub-catchment) is not included in this interpretation. This can be understood since any accumulations in the outer basin will be at low concentrations. Nevertheless the effect of the “outer” basin is in-cluded in that it contributes water fluxes. This is done using “normalising” factors that effectively partition the net infiltration on the outer basin between the upper and mid-regolith of the wetland.
In the GEMA-Site model all parts of the basin are explicitly included. Sub-horizon-tal flows from the Outer basin to the Inner basin are characterised by the partitioning factors, i, in a similar fashion the SKB model:
, , , ,
subCatch i i subCatch i i Low Mid WatF F
Figure 4: Estimates of changes to ecosystems areas for six lakes. Areas derived from wa-ter fluxes and wawa-ter velocities supplied by SKB in response to RFI1 using the rules of en-gagement set out above. Also plotted are the quoted areas of the lakes at 2000 CE (Bos-son et al., 2010 as provided by SKB in the response to RFI1). Linear fits to the mire and lake areas are indicated to highlight trends in ecosystem development.
Figure 5: Division of the captured inflow to the regolith layers of the six lakes as a func-tion of time., Results are compared to the “average object” (dashed lines). The fluxes are calculated using: , , , , subCatch i i subCatch i i Low Mid Wat
F F
.Most of the captured “runoff” flows into the upper regolith (~ 60 to 65%), with around 30 - 35% into the mid-regolith. Typically less than 5% flows into the lower regolith. This analysis therefore has implications for the implementation of GEMA-Site.
Figure 5 shows the plots of the changes in the partitioning of sub-surface flow for the six lakes at the three times. This puts the i in their successionary context. Of
the six, Puttan and Bolundsfjärden are nearest to the coast line and are just emerging – presumably undergoing the most rapid change. Fiskarfjärden is similarly close the coastline. Bolundsfjärden and Fiskarfjärden are the two largest lakes and have a similar distribution between water and terrestrial areas1. Their equivalent
i
are sim-ilar to the “average object”, despite the temporal variation, with Bolundsfjärden hav-ing a slightly higher flows into the upper regolith.
For the other three lakes there is a marked difference however. For
Gunnars-boträsket, Puttan and Stocksjön there is more flow into the mid regolith compared to
the upper regolith. Clear trends are not readily identified. Nevertheless, it is clear that the average object is not a good representation of the six lakes and so is unlikely to be representative of anything useful in the landscape. The high relative flux in the upper regolith inflow of Gällsboträsket model may reflect the maturity of the lake/mire system there. a range of values for the i is suggested by this analysis.
2.3. Discussion and summary
The aims of the RFI were to:
better understand the basis for the “average object” used by Bosson et al. (2010) to provide water flux parameterisation to the radionuclide transport model (Avila et al., 2010);
use the water balance description for the six lakes at 2000, 3000 and 5000 CE to inform the evolution of the flow model in GEMA-Site.
The analysis in the previous section prompts comments in respect of:
the transparency and reproducibility of elements of the SR-Site radionu-clide transport model, namely the “average object”;
the suitability of the “average object” approach as a way of populating the dataset for the landscape model of radionuclide transport;
implications for alternate modelling
Transparency and reproducibility of the “average object”
Although the “average object” is quoted by Bosson et al. as being based on an aver-age water fluxes in the basins of the six lakes existing in the present-day biosphere, estimated at 5000 CE by MIKE-SHE, it has not been possible to reproduce the nu-merical values used to express the generic hydrology and water balance of the basins by SKB (see Figure 1).
SKB provided most of the requested numerical data for the six lakes at the three times. The other request – for a detailed derivation of parameters in the TR-10-06 radionuclide transport model – has not been answered. Taken together the numerical
1 “Large is relative” Though large in the context of the six lakes, the topography of the bed of
Öregrundsgrepen to the northeast of the site suggests that there will be several lakes
basis for the “average object” and the rationale behind the parameterisation of “aver-age object” are therefore somewhat lacking in the model description and us“aver-age in SR-Site.
Confidence in the radionuclide transport model is therefore less than sufficient. Un-derstanding of the potential radiological consequences arising from release to the fu-ture Forsmark landscape therefore requires application of the SSM-sponsored alter-nate model, GEMA-Site.
Suitability of the “average object” approach
As noted above, the focus on the usage of MIKE-SHE results in the dose assessment model meant that a detailed review of the MIKE-SHE modelling itself, particularly in respect of the evolving hydrology of the future Forsmark landscape, was not car-ried out at a sufficient level of detail. This means that the review of SR-Site is de-pendent on a numerical results (from MIKE-SHE) that have not been subject to the same scrutiny as the dose assessment model. This is understandable, the aim of the review was to determine the adequacy of the assessment of potential radiological impacts. A better understanding of the workings of, and results from, the MIKE-SHE model would have helped the reviewers to form a clearer picture of the
poten-tial for alternate interpretations of the evolution of the flow system in the regolith
over the period of the assessment. It is likely that there is more that could be done to link the evolving flux maps for the landscape objects (ie, the basins) directly to the landscape model. Certainly a single non-evolving flux map is insufficient, the three time points of 2000, 3000 and 5000 CE are too few and the six lakes are not repre-sentative of the morphology of lakes anticipated from the topographic maps of the bed of the Öregrundsgrepen to the northeast of the planned repository location: there will be significantly larger lakes that will form over the next ten kyear. The “average object” approach is very-much a snapshot of average conditions in six widely different lakes at different stages of maturity. The question is: would alter-nate flow systems (with evolutionary sequences) significantly change the values of the Landscape Dose Factors (LDFs) calculated by SKB as there surrogate for radio-logical impact? This is, in part, addressed by the sensitivity analysis carried out us-ing GEMA-Site in the Chapters 3 and 4 below.
Implications for alternate modelling
Much of the analysis in section 2.2 is carried out to produce practical details for in-clusion in the GEMA-Site modelling below. In requesting details of the flow sys-tems for the six lakes at 2000, 3000 and 5000 CE it was hoped that the evolution of each of the lakes would be discernible so that an improved understanding of the flow system in GEMA-Site could be implemented.
Figure 3 shows that for four of the lakes there is little change in the areas of the ter-restrial and aquatic system in the 3 kyear between 2000 and 5000 CE. Access to (and understanding of) the MIKE-SHE results (or similar) for the evolving flow sys-tems in the landscape would be required to adequately characterise the evolutionary nature of the basins in the landscape. Consequently the hydrology in the GEMA-Site must remain restricted to the first approximation described by Kłos (2015).
There are some practical details that emerge from the analysis. Primarily, the inter-action of the sub-catchment (SKB terminology) = Outer basin (GEMA-Site) is use-ful since it implies the range of values that might be expected for the distribution of vertical and sub-horizontal flows in basins.
3. Overview of the GEMA-Site model
3.1. Key features
Kłos (2015) gives a complete description of the basis for the model taking into ac-count evolution in the system caused by landrise with an interpretation of the evolu-tion of the flow system in the basin as different areas of the basin emerge from the sea during the modelled period with the consequence that hydrologic inputs to the system interact with different parts of the system at different times.
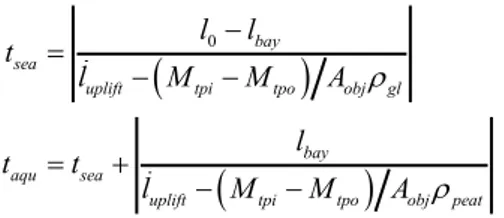
Figure 6 shows a simple interpretation of the evolving flow system for a basin mod-elled as three modules: Outer, Inner and Central. Transitions are treated as step changes related to land rise and sedimentation the lake phase and continued organic deposition in the wetland phase. Note that the wetland phase (Figure 6d) is the hy-drologic configuration that most closely matches the situation as modelled in the SR-Site “average object” and thereby the SR-Site radionuclide transport model. Appendix 3 provides further detail concerning the configuration of the model, in-cluding the numerical values for the water fluxes in the Reference Case model de-scribed by Kłos (2015). This illustrates how the flow system changes according to the transition times for each module:
tsea – transition from sea to bay (when the water column in the module no longer exchanges parcels of water with the rest of the Öregrundsgrepen) t – end of the aquatic period (no standing water in the module: water com-aqu
partment disconnected and inventory redistributed). For each of the modules, these times are given by
0 bay seauplift tpi tpo obj gl bay aqu sea
uplift tpi tpo obj peat
l l t l M M A l t t l M M A
Which includes the initial depth of the module below the Baltic (l0 m) the depth of
the water column on transition to bay conditions (l m). The main driver for this bay
transition is the land uplift rate (luplift m year-1). Sedimentation also plays a role,
de-pending on the net sedimentation rate as the balance between the mass input at the
top of the compartment (sedimentation M kg yeartpi -1) and the output (resuspension,
tpo
M ). During sea and lake stages the composition of the deposited material
changes as reflected in the density parameters for sea and lake (glacial/post-glacial clay and peat respectively).
Transition to agriculture occurs at a time chosen by the human population. In the reference model the time of transition is tagri = 19000 years after the start of the
simulation. Only the Central basin is assumed to be converted to agriculture. This is the receiving compartment for the release and where the highest concentrations are likely to arise. There are accumulations in other parts of the basin but these are much lower than in the Central basin (Kłos & Wörman, 2015).
a. Sea stage b. Bay/lake stage
c. Lake/wetland stage d. Wetland stage
e. Agriculture stage
Figure 6: Evolution of hydrology during land uplift. Outer, inner and central basins are shown from left to right. With uplift and sedimentation the water level drops in each mod-ule. Release is to the lowest part of the basin with a small upward flux at all times. As wa-ter levels fall, flow from the ouwa-ter, then inner basin is directed sub-horizontally towards the central basin contributing to increased upward fluxes. Change to agricultural condi-tions necessitates a modified and maintained drainage system. Radionuclide input is in groundwater in the bedrock to the lower regolith of the Central basin (red arrow).
Outer basin Inner basin Central basin Outer aqu
t
t
Outer basin Inner aqut
t
Inner basin Central basin Central aqut
t
Outer basin Inner basin Central basin Central Central aqu agrit
t
t
Outer basin Inner basin Central basin To d raina ge syst em Central agrit
t
Outer basin Inner basin Central basin Sea water Lake/bay water Upper regolith Mid-regolith Lower regolith Compartment typeRelease of radionuclides to the basin is assumed to be to the lowest part of the to-pography and to be driven by toto-pography-controlled gradients at the surface. For the flow system defined in the Reference Case, any dispersed release of groundwater to the Inner and Outer basins only acts to reduce the calculated doses. For this reason only the Central basin release is considered further.
The Reference Case dataset for the hydrological model is reproduced in Appendix 3 here. Variants and parameter distributions used in the probabilistic sensitivity analy-sis (psa) are discussed in Section 3.3 below.
From this data description, a clear difference between the GEMA-Site approach and the SR-Site transport model is seen. Water fluxes in SR-Site are defined by constant fractional parameters, linked to net infiltration according to evolving areas in the system. In GEMA-Site the flow system’s fluxes change as different areas within the system become exposed as their water cover recedes. The fractional flows in the sub-horizontal domain are, again, linked to net infiltration in but the fractional are not constant. In one respect the SR-Site model better reflects the evolution of the lake/wetland system than the GEMA-Site model: the areas of terrestrial and aquatic ecosystems vary in time and the wetland grows while the lake shrinks. To obtain a similar feature in GEMA-Site would require a higher degree of lateral discretisation with more than the three modules included here. Nevertheless, the models give com-parable results (Kłos, 2015) with increases confidence in the two modelling ap-proaches.
In each model the fluxes in the modelled systems are linked directly to the inputs to the system and distinct ecosystem areas within the basin. The Reference Case pa-rameters in the GEMA Site are listed in Table 1. Numerical values for the Reference Case model are listed in Table 2. Water fluxes are written in terms of the input pa-rameters, for example, the water fluxes out from the top and bottom faces of the Outer basin’s upper regolith compartment (Fupp dnoOuter, and Fupp btoOuter, m3 year-1) are
, , 1 Outer Outerupp dno upp obj
Outer Outer
upp bto upp obj
F P E A
F P E A ,
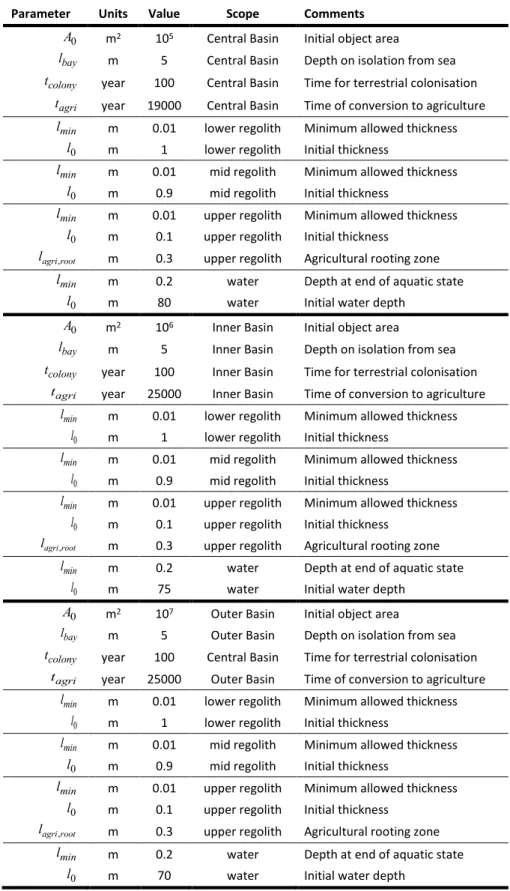
Table 1. Parameters governing water fluxes in GEMA-Site. Reference Case taken from Kłos (2015).
Parameter Value Module Description
P m year-1 0.56 all basins Precipitation (Lindborg, 2010)
E m year-1 0.4 all basins Evapotranspiration (Lindborg, 2010)
geo
v m year-1 0.01 Central basin Bedrock adv. velocity sea stage (Bosson et al., 2010)
wat year-1 0.017 all basins Residence time of water parcels in grepen (Aquilonius, 2010)
uplift
l m year-1 -0.006 all basins Isostatic uplift rate, interpreted from SKB (2010)
Table 2: Numerical values for the GEMA-Site Reference Case model (Kłos, 2015).
Parameter Units Value Scope Comments
0
A m2 105 Central Basin Initial object area
bay
l m 5 Central Basin Depth on isolation from sea
colony
t year 100 Central Basin Time for terrestrial colonisation
agri
t year 19000 Central Basin Time of conversion to agriculture min
l m 0.01 lower regolith Minimum allowed thickness
0
l m 1 lower regolith Initial thickness
min
l m 0.01 mid regolith Minimum allowed thickness
0
l m 0.9 mid regolith Initial thickness
min
l m 0.01 upper regolith Minimum allowed thickness
0
l m 0.1 upper regolith Initial thickness ,
agri root
l m 0.3 upper regolith Agricultural rooting zone
min
l m 0.2 water Depth at end of aquatic state
0
l m 80 water Initial water depth
0
A m2 106 Inner Basin Initial object area
bay
l m 5 Inner Basin Depth on isolation from sea
colony
t year 100 Inner Basin Time for terrestrial colonisation
agri
t year 25000 Inner Basin Time of conversion to agriculture
min
l m 0.01 lower regolith Minimum allowed thickness
0
l m 1 lower regolith Initial thickness
min
l m 0.01 mid regolith Minimum allowed thickness
0
l m 0.9 mid regolith Initial thickness
min
l m 0.01 upper regolith Minimum allowed thickness
0
l m 0.1 upper regolith Initial thickness
,
agri root
l m 0.3 upper regolith Agricultural rooting zone
min
l m 0.2 water Depth at end of aquatic state
0
l m 75 water Initial water depth
0
A m2 107 Outer Basin Initial object area
bay
l m 5 Outer Basin Depth on isolation from sea
colony
t year 100 Central Basin Time for terrestrial colonisation
agri
t year 25000 Outer Basin Time of conversion to agriculture
min
l m 0.01 lower regolith Minimum allowed thickness
0
l m 1 lower regolith Initial thickness
min
l m 0.01 mid regolith Minimum allowed thickness
0
l m 0.9 mid regolith Initial thickness
min
l m 0.01 upper regolith Minimum allowed thickness
0
l m 0.1 upper regolith Initial thickness ,
agri root
l m 0.3 upper regolith Agricultural rooting zone
min
l m 0.2 water Depth at end of aquatic state
0
where the area of the module is A mobj 2 and precipitation and evapotranspiration are
P and E respectively. The distribution of the flux between lateral and vertical flow is
Outer
upp (see Section 2.2). Similar relations hold for the mid and lower regolith com-partments. Appendix 3 lists all such expressions, taken from the Ecolego implemen-tation of the model, including the timing parameters used to switch the state of the flow system.
The radionuclides considered are those from the original modelling (Kłos et al., 2014a); the release is 1 Bq year-1 of 79Se, 94Nb, 129I and 226Ra (for which the daugh-ters 210Pb and 210Po grow in). These are significant radionuclides in the SR-Site as-sessment. Both 129I and 226Ra have high LDFs and the highest early releases (SKB, 2011).
A range of exposure pathways are considered in the model. These include consump-tion of marine and freshwater organisms, natural foodstuffs during the wetland (nat-ural ecosystem) period as well as a comprehensive range of agricult(nat-ural pathways. These pathways are switched in and out of the model according to the state of the ecosystem in the modules at different times. Also calculated are inhalation and ex-ternal exposure doses arising from accumulation in the upper regolith and according to different patterns of human behaviour in the different ecosystems.
Since the initial modelling the use of local freshwater resources has been included for all terrestrial stages. When freshwater lakes exist these can be used for water consumption by humans and livestock. During the wetland period alternative (non-contaminated) water bodies are assumed. During the agricultural phase there are three water usage scenarios:
Water from the surface drainage system (see Figure 6e);
Water from a shallow well in the lower regolith of the Central Basin;
Irrigation, where crops are irrigated from the well water (drainage system water could be used but leads to lower doses).
As the RFI response was not able to give additional detail as to the evolution of the flow field in the basin it was decided that this initial formulation of the evolving flow system would be used to investigate the range of dose-response and at the same time to assess the parameters in the model description that have the most influence on dose.
3.2. GEMA-Site for probabilistic sensitivity analyses
Since the initial modelling with GEMA-Site (Kłos et al., 2014a) the model has been reviewed and updated (Kłos, 2015). Deterministic results have been presented to the 2015 IHLRMWC (Kłos & Wörman, 2015; Kłos et al., 2015). The version of the model used here is GEMA-Site 1.3c.
The parameters sampled fall into two categories, those that affect radionuclide accu-mulation and uptake – the regolith kds and concentration ratios in foodstuffs; and
those that affect water fluxes directly (and so the flow system). The former are taken from the database of the SR-Site radionuclide transport model (Nordén et al., 2010). The latter – the areas of modules within the basin and so forth are based on the anal-ysis of characteristics discussed by Kłos (2015).The values used here are listed in Appendix 3.
The assumed areas of the three module in this lateral discretisation of the basin are known to have an important influence om the dose arising from the release (Kłos et
al., 2015). Figure 7 gives an illustration of how results can vary with different
as-sumptions. The plots compare the reference case model (the “7-6-5 geometry” with outer, inner and central basins having areas 107, 106 105 m2 respectively) and a vari-ant with “5-4-4 geometry” (105:104:104 m2). The former has conversion at the refer-ence value of 19000 years from the start of the release and the second has the impo-sition of the managed drainage system at the end of the lake period of the central ba-sin at year 13148. Well water is the source of domestic and agricultural water sup-plies. Further analysis is discussed in Chapter 5 below.
Combined with the analysis of basin areas in the future Forsmark landscape (Kłos, 2015) these results this justifies the set of pdfs assumed for module sizes in the prob-abilistic analysis here:
Central basis: uniform, with bounds (5×10³, 105) m2, Inner basin: uniform, (103, 106) m2
Outer basin: uniform (104, 107) m2.
As this is a sensitivity analysis rather than a full probabilistic dose assessment, no correlations are assumed so that it is possible to have small outer and inner basins combined with a large central basin.
In addition to the nuclide specific parameters noted above, the effect of soil charac-teristics has also been included. Soil particulate densities (corrected from SKB’s quoted bulk densities; Löfgren, 2010; Aquilonius, 2010) are also sampled as are the soil/sediment porosities in the same source. The time of conversion to agriculture is also sampled in the range 11200 to 20000 years.
Most sampled parameters can be implemented directly. The deterministic version re-quires some modification to allow the parameters and processes investigated in the
(a) Reference basin (“7-6-5 geometry”),
agri
t = 19000 year tagri(b) Small basin (“5-4-4 geometry”), 13148year (conversion as soon as possible)
probabilistic sensitivity analysis to be adequately represented. Interdependencies in the model require the following parameters to be introduced:
Water fluxes in the Outer basin. The parameters Outer
upp and midOuter partition the infiltrating water flux at the top of the upper regolith at times after the aquatic period. The factors determine the lateral and vertical fluxes from the upper and mid regolith compartments respectively. The proportions are
1j
i flows lat-erally and j
i vertically. It is not practical to sample both the upper and mid-regolith fractions, instead they are assumed to be related by the sampled param-eter fmid , so that midOuter
1 fmid
uppOuter. A factor describing the volumetric moisture content of agricultural soils. Poros-ity of the compartments is included in the psa. Because of the proximPoros-ity of the water table to the surface it is assumed that all but agricultural soils are satu-rated. Sampling both the porosity and volumetric moisture content of the agri-cultural upper soil without correlation could lead to unphysical results. As a simple expedient it is therefore assumed that the volumetric moisture content is given by agri pagri, with the sampled parameter being p.
Time of the imposition of agriculture in the Central basin. The basic resolution of the dose assessment model is 1 year. The time of transition from natural drainage to managed agriculture drainage is sampled. However, the sampled pa-rameter is a real, rather than integer number. for this reason the sampled param-eter is p and this is converted to an integer number to give the date of transi-agri tion: tagri int
pagri .4. Probabilistic Sensitivity Analysis results
4.1. Implementation
With the model outlined in the preceding chapter three sets of calculations have been run using the Ecolego modelling framework. Each of the three assumptions for local water usage (drainage system, well, well with irrigation) are evaluated. The model is run in probabilistic mode with 1000 Latin Hypercube Samples with no cor-relations.
The output quantity calculated is the annual individual dose arising from the release of the four radionuclides, 79Se, 94Nb, 129I and 226Ra (contribution of daughters grow-ing-in in the biosphere included). Doses are calculated for each of the years from 10000 to 20000 after the simulation begins. Before this time, because of the choice of the initial depth of the sea, all basins remain covered by the Baltic and doses from the marine ecosystem are low.
The peak dose is evaluated for each radionuclide in the release. This differs from the 50 year average dose calculated by SKB in their generation of the LDF values (ie, lifetime averaged dose)2. Figure 7 suggest that agricultural doses are likely to domi-nate the results and that annual doses can remain reasonably constant over 50 years or so. Use of the peak annual individual dose simplifies the analysis here. The fac-tors that influence peak dose are also those that influence the 50-year average dose. Ecolego allows sensitivity analysis to be performed. The Spearman rank correlation coefficient is used to determine sensitivity. Scatter plots of key parameters are also used to illustrate trends.
4.2. Analysis
4.2.1. Rank Correlation Coefficients (RCC)
Table 3 lists the results for the three water usage scenarios for each of the four radio-nuclides released to the base of the Central Basin lower regolith. Only those results for which the absolute value of the RCC ≥ 0.1 are shown. Below this value the cor-relation is too low to be meaningful.
Looking at Table 3 the factors that influence dose can be classified as Sorption characteristics
o strongly and weakly nuclide behave differently – 79Se and 129I cf. 94Nb and the members of the 226Ra chain
2 The fifty year average dose,
50
50 1 50
t tot t D t D t dt , is allowed by the SSM (2008) guidance. If there are any short term transients with high peak annual doses during the period, this quantity smooths them out to give a representative annual dose over the adult lifetime of the exposed individual.Table 3: Results of the sensitivity analysis for the three water usage cases (|RCC| ≥ 0.1).
79Se RCC 129I RCC
OuterBasin.A_obj -0.58 kd_organic (129I) 0.65
kd_organic (79Se) 0.45 OuterBasin.A_obj -0.33
CR_fish_fw (79Se) 0.25 CR_root (129I) 0.18
CentralBasin.t_agri -0.20 TF_milk (129I) 0.15
kd_inorganic (79Se) 0.19 CR_pasture (129I) 0.13
CR_cereal (79Se) 0.18 kd_inorganic (129I) 0.12
CR_root (79Se ) 0.12 CR_cereal( 129I ) 0.11 CentralBasin.t_agri -0.11 94Nb RCC 226Ra chain RCC kd_organic (94Nb) 0.68 CentralBasin.A_obj -0.51 OuterBasin.A_obj -0.26 OuterBasin.A_obj 0.42 kd_inorganic (94Nb) -0.14 kd_inorganic (210Pb) -0.28
CentralBasin.t_agri -0.11 kd_inorganic (210Po) -0.28
CentralBasin.A_ob0 -0.08 kd_organic (210Po) -0.20
kd_inorganic (226Ra) -0.18
CR_game (210Po) 0.10
OuterBasin.phi_upp -0.10
(a) drainage system
79Se RCC 129I RCC
OuterBasin.A_obj -0.54 kd_organic (129I) 0.69
kd_organic (79Se) 0.47 OuterBasin.A_obj -0.44
CR_fish_fw (79Se) 0.28 CR_root (129I) 0.16
CentralBasin.t_agri -0.20 CR_cereal (129I) 0.16
CR_cereal (79Se) 0.19 CentralBasin.t_agri -0.13
kd_inorganic (79Se) 0.14 TF_milk (129I) 0.12
CR_pasture (129I) 0.12
94Nb RCC 226Ra chain RCC
kd_organic (94Nb) 0.67 CentralBasin.A_obj -0.52
OuterBasin.A_obj -0.28 kd_inorganic (210Po) -0.51
kd_inorganic (94Nb) -0.17 kd_organic (210Po) -0.25
kd_inorganic (210Pb) -0.20 OuterBasin.A_obj 0.19 kd_organic (226Ra) 0.14 kd_inorganic (226Ra) -0.10 CR_game (210Po) 0.10 (b) well water 79Se RCC 129I RCC OuterBasin.A_obj -0.51 kd_organic (129I) 0.64
kd_organic (79Se) 0.47 OuterBasin.A_obj -0.48
CR_cereal (79Se) 0.25 CR_pasture (129I) 0.17
kd_inorganic( 79Se) 0.21 CR_root (129I) 0.16
CR_fish_fw (79Se) 0.21 TF_milk (129I) 0.14
CentralBasin.t_agri -0.17 CR_cereal (129I) 0.12
CentralBasin.A_obj 0.11 kd_inorganic(I-129) 0.11
94Nb RCC 226Ra chain RCC
kd_organic (94Nb) 0.67 kd_inorganic( 210Po) -0.75
OuterBasin.A_obj -0.21 CentralBasin.A_obj -0.37
kd_inorganic (94Nb) -0.17 kd_inorganic (210Pb) -0.14
o the relative strength of sorption in the upper regolith (organic material) compared to the inorganic kd (material in mid and lower regolith)
Basin characteristics
o The areas of the modules often rank highly and the size of the outer basin can have a greater influence than the size of the central basin (the place where the release, accumulation and exposure take place).
o The time of transition to agriculture weakly influences of peak dose Concentration ratios and transfer factors
o These also show a variance between strongly and weakly sorbing radionu-clides. Where they have influence it principally seen thorough the agricul-tural pathways though the concentration of 79Se in fish during the lake pe-riod is also indicated as a sensitive parameter.
4.2.2. Interpretation of results
Basin geometry (areas of outer, inner and central basins) feature in the top two most influential parameters for each of the radionuclides and water use variants. The In-ner basin has no significant influence and the Central Basin area has the expected negative correlation on account of spatial dilution in the area from which agricul-tural produce is derived. However, this is primarily for the 226Ra chain, with a rela-tively low signal, for 94Nb. These are both examples of the more strongly sorbing ra-dionuclides.
For the weakly sorbing radionuclides (79Se and 129I here) it is the area of the Outer
basin that has the strongest influence. The greater the collecting area for net
infiltra-tion in the basin as a whole, the lower the dose. The key factor here that of
through-put of contaminated water. Because the kds are relatively low the high throughput
rapidly washes contaminants from the system with little accumulation. This feature also affect dose from 94Nb. Higher doses for 94Nb arise for combinations of lower kd in the lower and mid-regolith layers (negative correlation with inorganic kd) and
higher sorption in the organic layers (positive correlation). The importance of reten-tion in the lower regolith for the low kd nuclides is seen in the results that both 79Se
and 129I have positive correlations of dose with inorganic kd. This acts to counter the washing out of the radionuclides by the high throughflow, delaying loss for dose to arise from the upper regolith.
A related effect is seen for the 226Ra chain. In this case, however, there is a strong positive correlation of doses with area of the Outer basin. There is a significant neg-ative correlation between inorganic kd and dose for each of the radionuclides in the
chain. In the modelling of the chain there are opposite influences from the kds of
226Ra and 210Po. A positive correlation for the organic kd of 226Ra acts to retain 226Ra in the upper regolith where is has longer to decay to 210Po (via 210Pb). Doses from the release of 226Ra are dominated by daughters, particularly 210Po. The role of the Outer basin’s area in this case is to wash the highly sorbing 226Ra (and 210Pb) into the upper regolith where ingrowth of 210Po is important.
Figure 8 shows scatter plots of dose vs. module size for the released radionuclides in the case of well water usage. These plots support the results from the RCCs. Trends in the data are illustrated using a fitted power-law for each of the scatter plots. The strongest signals come from the effect of the area of the Outer basin for lower kd
for 94Nb though the trend is less pronounced. For the 226Ra chain the effect is re-versed. The strongest influence on the 226Ra chain is the spatial dilution effect of the Central basin’s area. It is not believed that the slight positive relation for the Central basin area for 79Se and 129I is meaningful, although the slight negative slope of the results for 94Nb is consistent with that from the 226Ra chain. The RCC values corre-sponding to these results are below the 0.1 threshold. The influence of the area of the Inner basin is seen to be similar to that of the Outer basin, suggesting that the three module discretisation may not be necessary.
(a) 79Se (b) 129I
(c) 94Nb (d) 226Ra chain
Figure 8: Scatter plots indicating the influence of module areas on annual individual dose. Case with well water usage. Results for each module area are shown. Fitted lines are power-law fits to illustrate data trends. This is similar to the RCC but is less indica-tive.