VTI meddelande
No. 774A +- 1996
Ring Analysis of Nordic Road Simulators
Proposal for a common test method for determination of the wear resistance of concrete pavements
Bengt-Ake Hultqvist and Bo Carlsson
Swedish Road and
VTI meddelande
No. 774A - 1996
Ring Analysis of Nordic Road Simulators
Proposal for a common test method for determination of the wear resistance of concrete pavements
Bengt-Ake Hultqvist and Bo Carlsson
Swedish National Road and | Transport Research Institute Cover: P. Y¥dringer
Publisher: Publication:
Meddelande 774 A
Published: Project code:
Swedish National Road and 1996 60084
A Transport Research Institute
S-581 95 Linkoping Sweden Project:
Test method for the determination of wear resistance of concrete pavements
Author: Sponsor:
Bengt-Ake Hultqvist and Bo Carlsson Swedish National Road Administration, Cementa, Development Fund of the Swedish Construction Industry (SBUF), VTI
Title:
Ring analysis of Nordic road simulators and proposal for a common test method for determination of the wear resistance of concrete pavements
Abstract
Pavement wear from studded tyres is mainly a Nordic problem. Consequently, the development of durable concrete pavements has mainly been carried out in Norway, Sweden and Finland. Since the middle of the '80s, the wear resistance of concrete pavements has been tested in Norway in a circular road simulator "Veislitern'". Similar road simulators are also found in Sweden and Finland. The simulators and test procedures differ since they have in part been adapted to the conditions in the countries concerned. In the European Committee of Standardisation, CEN, road simulators have been proposed as test equipment when determining the wear resistance of concrete pavements to studded winter tyres. The aim of this ring analysis was to study the relations between three Nordic road simulators and to produce a proposal for a common test method. The results were reported as relative SPSp values (specific wear when tested in a road simulator) according to an original proposal for a CEN method. Equivalent results are obtained in the Norwegian and Swedish road simulators. The results of the Finnish road simulator differ slightly from the results of the two other road simulators. Alternatively, the result was reported with the RWI (Relative Wear Index). An evaluation of the result according to the RWI offers better conformity between simulators. Concrete pavements with high compressive strength and porphyry aggregates had the best wear resistance. Generally, concrete pavements with a maximum aggregate size of 16 mm had better wear resistance than the corresponding concrete pavements with 8 mm aggregate. Based on this study, an alternative proposal was drawn up to produce a test method for the wear resistance of concrete pavements. This proposal can be used as a basis when producing a revised CEN method.
ISSN: Language: No. of pages:
Foreword
This VTI Bulletin describes a ring analysis carried out in the spring of 1995 between three Nordic road simulators. The tests in the analysis mainly followed the original proposal for "CEN method for determination of the wear resistance of concrete pavements". On the basis of the results of the ring analysis, an alternative proposal for a test method has been drawn up. This proposal can be used as the basis in revising the original CEN proposal.
The tests were performed at the Norcem road simulator in Norway, the VTI road simulator in Sweden, and the VTT road simulator in Finland. The work was coordinated by a Nordic group comprising
Ronny Andersson, Cementa, Sweden
Sten Petersson, Swedish National Road Administration, Sweden
Orjan Petersson,
Cement & Concrete Research Institute,
Sweden
Tore Ekholt,
Norcem,
Norway
Kyosti Laukkanen,
VTT,
Finland
Bo Carlsson,
VTI,
Sweden
Bengt-Aka Hultqvist,
VTL,
Sweden
Project management, evaluation of results and production of the report were
performed by VTI within the joint r&d project "Cement bound layers in road
pavements" which was jointly financed by the Swedish National Road
Admini-stration, Cementa, SBUF and VTL
The test slabs used in the analysis were made by Skanska under the direction of
UIf Jonsson.
Linkoping, December 1995
Bengt-Ake Hultqvist
CONTENTS Summary 1 2 3 3.1 3.2 3.3 4 5 5.1 5.2 5.3 5.4 5.5 6 6.1 6.2 10
Background and aim
Concrete grade and aggregates
Description of road simulators VTI in Sweden Norcem in Norway VTT in Finland Test method Results Wear/rutting
Relative SPS, according to the original draft CEN method Relative SPS, at 50 % wet wear and 50 % dry wear
Ratio of wet to dry wear Relative wear index (RW!1)
Regression relations for the road simulators Statistical analysis of the results of the ring analysis Extended tests in Sweden and Norway
Conclusions
Road condition studies in Sweden
Alternative proposal for a common test method for determination of the wear resistance of concrete pavements
Bibliography
Appendix No 1: Results of tests in the Finnish road simulator Appendix No 2: Results of tests in the Norwegian road simulator Appendix No 3: Original draft CEN method
Appendix No 4: Road condition studies, winter 1993-94
VTI meddelande 774 A Page 11 12 14 14 15 16 17 18 18 20 21 23 24 28 28 31 35 39 M 43
Ring analysis of Nordic road simulators and proposal for a common test method for determination of the wear resistance of concrete pavements
by Bengt-Ake Hultqvist and Bo Carlsson
Swedish National Road and Transport Research Institute $-581 95 LINKOPING, Sweden
Summary
Pavement wear from studded tyres is mainly a Nordic problem. Consequently, de-velopment of durable concrete pavements has mainly been carried out in Norway, Sweden and Finland. Since the middle of the '80s, the wear resistance of concrete pavements has been tested in Norway in a circular road simulator "Veislitern''. Similar road simulators are also found in Sweden and Finland. The simulators and test procedures differ since they have in part been adapted to the conditions in the countries concerned. In the European Committee of Standardisation, CEN, road simulators have been proposed as test equipment when determining the wear resistance of concrete pavements to studded winter tyres.
The aim of this ring analysis was to study the relations between three Nordic road simulators and to produce a proposal for a common test method. In parallel with the ring analysis, tests were also carried out in connection with the prequalifi-cation prior to the contract for a concrete section of the E6 at Falkenberg, between Fastarp and Heberg. These results have been included separately in the report.
The results were reported as relative SPSp values (specific wear when tested in a road simulator) according to an original proposal for a CEN method. An evaluation according to the original proposal for a CEN method produced equi-valent results in the Norwegian and Swedish road simulators. The results of the Finnish road simulator differ slightly from the results of the two other road simu-lators. Alternatively, the result can be reported with the RWI (Relative Wear Index). An evaluation of the result according to the RWI offers better conformity between simulators. A linear regression analysis of the results from road simu-lators offers better correlation for the RWI than for the SPSp.
The tested concrete pavements were classified according to an original proposal for a CEN method. The classification is carried out in five different wear classes designated 0-4 depending on the relative SPSp value of the pavement. An alternative proposal is given for the classification according to the RWT. Concrete pavements with high compressive strength and porphyry aggregates had the best wear resistance. Generally, concrete pavements with a maximum aggregate size of 16 mm had better wear resistance than the corresponding concrete pavements with 8 mm aggregate. Currently, there is no statistically proved basis for the relation between results in the road simulator and actual wear on the road. Wear measurements are carried out on various concrete roads in Sweden and are planned to be increased in Norway and Finland. These results will be compared with the corresponding results obtained in road simulators.
Based on this study, an alternative proposal was drawn up to produce a common test method for the wear resistance of concrete pavements. This proposal can be used as a basis when producing a revised CEN method. After revision, a new ring test should be carried out in order to verify the revised test method. Such a ring test should also include concrete pavements with poorer wear resistance
than the concrete reference, thus making it possible to improve the classification into various wear classes.
1 Background and aim
Pavement wear due to studded tyres is mainly a Nordic problem. The work on producing wear resistant concrete pavements has therefore mainly been performed in Norway, Sweden and Finland. Since the middle of the eighties, tests to deter-mine the wear resistance of concrete pavements have been made in Norway in a circular road simulator "Veislitern" [Ba&rland, T, 1989]. Similar road simulators are also to be found in Sweden and Finland. There is however a difference between machinery and test procedures since these had to a certain extent been adapted to the conditions in each country.
In Sweden the VTI road simulator was earlier used to test asphalt pavements. In recent years work has gone on with a view to developing competence and test procedures so that tests to determine the wear resistance of concrete pavements could also be carried out [Hultqvist, B-A, and Carlsson, B, 1996]. In Finland also road simulators are used to test concrete pavements.
In contracts for concrete pavements, it is increasingly common for performance based specifications regarding wear resistance, riding comfort, strength and friction. The requirement concerning wear resistance is usually specified on the basis of tests in road simulators.
In European standardisation work within CEN/TC 227/WG3/TG1, road simu-lators have been proposed as test methods for the determination of the resistance of concrete pavements to wear by studded winter tyres. A preliminary proposal for a CEN method has been drawn up (see Appendix No 3). In principle, this follows the test programme used in the Norwegian road simulator "Veislitern".
The aim of this ring analysis was to find what relationship there is between the three Nordic road simulators and to draw up a proposal for a common test method. The method must also be verified in relation to real conditions. Measurements on the Swedish test sections of concrete are one of the ways in which material for this is obtained. An increase in the number of measurements of real wear on concrete roads by studded tyres is also planned in the Nordic countries. The results are in-tended for use in a future rut prediction model. This will also take account of initial wear and the effect of the increase in concrete strength in time.
Parallel with the ring analysis, tests were also made in conjunction with the prequalification procedure for the contract for the concrete road E6 Falkenberg, section Fastarp-Heberg. The results of these are included separately in the report (see Clause 6.2).
The object is to produce a common test method for the Nordic road simulators. Since monopoly testing is not permitted, it is important that all Nordic simulators should be able to use the method which is proposed as CEN method for the determination of the wear resistance of concrete pavements.
The results of tests in the Finnish road simulator have been published in VTT Research Report No YKI 347/95 (see Appendix No 1), and the results of tests in the Norwegian road simulator "Veislitern" in Norcem Report No 9D4/R95011 (see Appendix No 2).
2 Concrete grade and aggregates
In this ring analysis which comprises tests in the road simulator of VTI, the road simulator of Norcem "Veislitern" and the road simulator of VTT, six different concrete mixes were tested. The aggregates were porphyry, Durasplit and Dalsland quartzite. The maximum size of aggregate and concrete grade were other parameters which were varied. Concrete grade, aggregate and maximum size of aggregate are set out in Table 1.
The reference concrete stated in the original proposal for a CEN method was used as a reference and has also been used for testing in the Norwegian road simulator "Veislitern" for a couple of years. The reference concrete contains aggregates of hornfels with a maximum aggregate size of 16 mm.
Table 1 Concrete mixes used in the ring analysis
Concrete grade Aggregate Max. size of
MPa aggregate
K80 Alvdal porphyry 16
K100 Alvdal porphyry 16
K8O Alvdal porphyry 8
K100 Alvdal porphyry 8
K80 Durasplit 16
K80 Dalsland quartzite 16
Reference concrete
(not tested in Finland) 16 accordance with
CEN-proposal TC227/NG3/ TG1. See Table 3.
Durasplit is in actual fact the name of a product. The aggregate which is from Norway consists of quartzitic diorite. The porphyry is from the quarry "Kultmott" in Alvdalen, and the Dalsland quartzite is supplied by Rassjokross AB.
The concrete mixes were made with the following aggregate fractions:
Fraction Concrete Concrete
8 mm 16 mm
0-2 mm 35 %
0-4 mm 35 %
4-8 mm 65 %
8-16 mm 65 %
The fractions 0-2 mm and 0-4 mm are uncrushed material.
Cement Std P Degerhamn was used in all concrete mixes. Silica amounting to 5 % of the weight of cement was added. Flyt 92 M was used as plasticiser and Cementa L 16 as air entraining agent.
The compressive strengths, air contents and water/binder ratios are set out in Table 2.
Table 2 Compressive strengths, air contents and water/binder ratios
Concrete grade compres- Air content Water/binder
sive strenth ratio
28 days
MPa %
K80 87-88 4,0 0,35
K100 107-108 2,5 0,35
All the test slabs included in the ring analysis had exposed aggregate on the surface. The reference slabs were not exposed and had a smooth surface. They were made by Norcem in the same way as in previous tests, in accordance with the mix specification in the original draft CEN method. The composition of the reference concrete is given in Table 3.
Table 3 Mix specification ofreference concrete
Cement ~ Type 1 Portland HS cement 390 kg/m*
Silica 15 kg/m"
Sand Nenset 0-4 mm 797,5 kg/m3
Crushed aggregate Hornfels 8-12 mm 582 kg/m" Crushed aggregate Hornfels 12-16 mm 582 kg/m" Water reducing admixture Scancem SP40 2,82 kg/m3 Water reducing admixture Scancem P 3 kg/m
Water/binder ratio 0,40
Slump 20-60 mm
Material < 4 mm 32-25 %
Fineness modulus FM, aggregate ca 5,5
Compressive strength 85 + 2 MPa
The compressive strength was determined on cubes of 100 mm side which were made at the same time as the reference slabs. The cubes which were aged 2-4 months had been stored in the same environment as the reference concrete slabs. The test procedure conformed to Norwegian standard, i.e. a rate of loading of 0.25 MPa/s.
Norway Sweden Finland
MPa MPa MPa
90,2, (93,6*) 97,9, 99,9 94,6, 94,8 * Cubes stored in water
The compressive strength of the reference concrete was higher than that quoted in the CEN method, and this may have affected the level of wear.
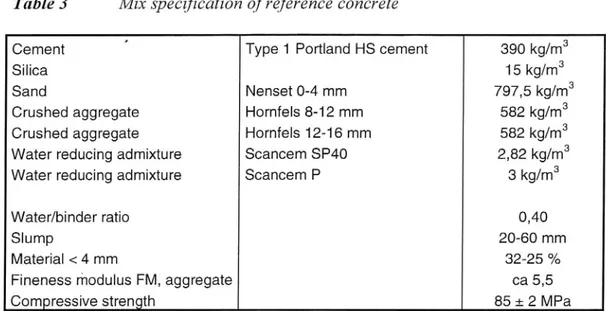
3 Description of road simulators 3.1 VTI in Sweden
The road simulator of VTI is an apparatus for accelerated testing which is mainly used to determine the resistance of different types of surfacing to wear by studded car tyres. The simulator has six wheels but normally only four are used. Each wheel has an individual drive motor. The mean diameter of the circular track is 5.25 m, and the mean length of a revolution is 16.5 m.
The tyres used are ordinary winter tyres, 185/70 R14, made by Gislaved Nord Frost, and have approx 110 studs in each tyre. The tyres are fitted with steel studs (tungsten carbide studs) each of which has a weight of 1.8 g. The tyre pressure in these tests was 250 kPa and the wheel load 4.5 kN. Prior to the test the tyres were run in by driving about 500 km on country roads at a speed of 70-90 km/h.
During the test the wheels are displaced about 60 mm sideways by an eccenter device. The sideways movement is important when studded tyres are tested since otherwise they leave distinct ruts in the surfacing along each row of studs in the tyre.
...
Figure 1 The VTI road simulator
The test track accommodates 28 test slabs, at least 2 of which are reference slabs. The test slabscan be sprinkledwithwaterto simulaterainfall.
In the room where the road simulator is located the temperature can be regu-lated fromapprox +30°Cto approx -10°C.
The speed of the simulator can be varied up to a maximum of about 85 km/h for the wheel load of4.5 kN. In this test the temperature was +5°C andthe speed 75 km/h.
Wear is measured by a computer controlled profilometer which applies contact-less distance measurement by laser technology. The laser profilometer consists of
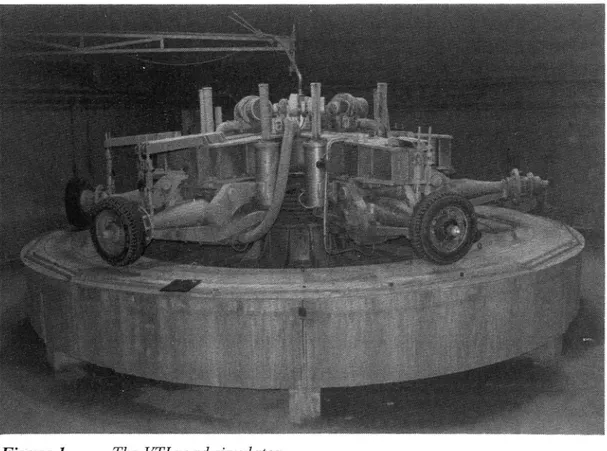
3.2 Norcem in Norway
The Norwegian road simulator "Veislitern" is located in the Norcem factory area at Brevik. "Veislitern" consists of a circular track of 6 m diameter. Twelve test segments, two of which are reference slabs, can be installed duringeach test.
Figure 2 The Norcem road simulator "Veislitern"
"Veislitern" has four conical lorry tyres each of which have approx 400 lorry tyre studs of 8 g weight. In normal testing the simulator has a speed of 60 km/h and a wheel load of approx 25 kN. The test segments can be sprayed with water to simulate rainfall. The temperature during the test is between +10 and +25°C.
Wear is measured across the track using a measuring bridge with 16 probes which are pressed down towards the track. Wear is calculated as the mean of the readings given by the eight central probes. The measuring bridge is placed in pre-mounted fixtures to ensure that the measuring equipment is in exactly the same position for each measurement. On each test segment three cross profiles are measured. A normal test comprises 70,000 revolutions, with measurements after each 10,000 revolutions.
VTI meddelande 774 A
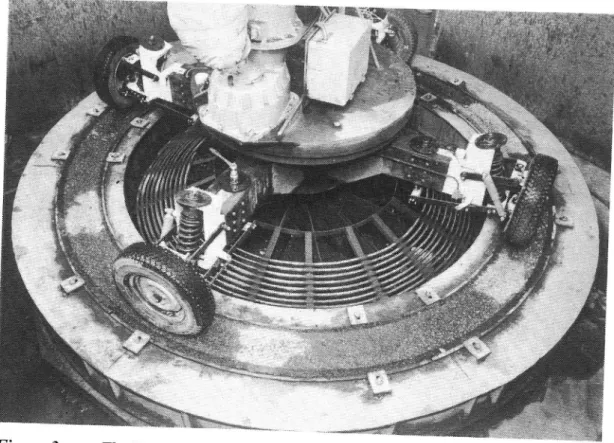
3.3 VTT in Finland
The Finnish road simulator is located at VTT in Espoo. The simulator consists of a circular track of 3.1 m internal and 3.7 m external diameter which is traversed by four wheels. Six test segments can be tested at a time. The segments can be sprayed with water to simulate rainfall. The tyres used are ordinary car tyres of 165 R13 82Q dimension which are fitted with 90 Kometa P8-110/1.8 studs. The stud weight is 1.8 g and the wheel load is 4 kN. The speed during the test is 31 km/h and the temperature is between 0 and +10°C.
Figure 3 The VIT road simulator
A laser profilometer is used to measure wear. The cross profile is measured with a density of 4 points/mm. Texture can also be measured with the same laser profilometer. The rut is measured over a width of 240 mm.
16
4 Test method
Tests in this ring analysis mainly followed the original draft CEN method. A deviation was made with respect to initial wear which, according to the original draft, was to be measured after 10,000 revolutions on a dry track. In these tests the number of revolutions in the Swedish and Finnish road simulators was changed so as to make the initial wear the same as in the Norwegian road simulator "Veislitern". In the Swedish simulator this represented 30,000 revolutions on a dry track. In Finland the run was started as wet wear since the simulator there pro-duces very little wear on a dry track. This is probably due to the low speed (31 km/h) of the road simulator. On a wet track the wear is greater and at the same time the tyres last longer. In the Finnish road simulator 30,000 revolutions on a wet track were needed in order to make the initial wear the same as those obtained in the other two simulators.
The original draft CEN method "General Standard for Concrete Pavements, Draft 3.1", CEN/TC227/WG3/TG1, May 1995, is reproduced in Appendix No 3.
In the Swedish and Finnish road simulators more and longer test periods were run than in the Norwegian simulator. This was necessary since wear in these simu-lators develops more slowly. Wear was measured after each period.
According to the original CEN draft, the test shall be continued until the rut depth is 15 mm.
The Swedish road simulator was accordingly run for a total of 270,000 revolutions and the Finnish simulator for 1,230,000 revolutions. The total number of revolutions in the Norwegian simulator "Veislitern" was 70,000.
The test programmes for the three road simulators are set out in Table 4.
Table 4 Test programmes in the ring analysis.
VTI VTT Norcem Period No No of revs No of revs No of revs
Speed 75 km/h 31 km/h 60 km/h Running-in 1000 1000 1000 Zero measurement
Initial wear 30 000 dry 30 000 wet 10 000 dry 1 30 000 dry 60 000 wet 10 000 dry 2 30 000 wet 60 000 dry 10 000 dry 3 30 000 dry 120 000 wet 10 000 dry 4 30 000 wet 120 000 dry 10 000 wet 5 30 000 dry 180 000 wet 10 000 wet 6 30 000 wet 180 000 dry 10 000 wet 7 30 000 dry 240 000 wet 8 30 000 wet 240 000 dry 9 Total number of
revolutions 270 000 1230 000 70 000
5 Results
5.1 Wearlrutting
According to the original draft CEN method, development of wear is to be illustrated on a graph with wear along the vertical axis and the number of revolu-tions along the horizontal axis.
Wear in the three road simulators is however reported in different ways. In the Swedish road simulator the mean wear measured across the whole rut width of 300 mm is shown, in the Norwegian simulator the mean wear is shown across 150 mm at the centre of the rut, and in the Finnish simulator wear is measured across the whole rut width of 240 mm and is reported as cross sectional area re-moved, expressed in terms of cm'.
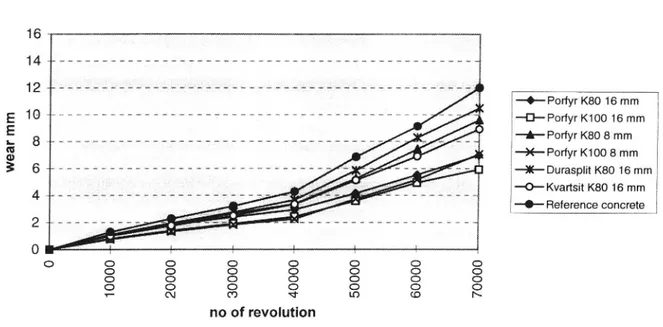
Fig. 4 shows development of wear in the Swedish road simulator.
Development of wear in the VTI road simulator
10 |
Q esgece ccc eke -->>
g
& A4 ~ ose se weiss wens ike we ime Shoue he Whe be cabs meee el ne nec nh ee ae ne ae be mnie ime an ae wk ne oe k > |
J A+ ie in hind e Bie mie To ticing By tn a gy ws pe ain sip aap RD ih anaas Th he sng cae op lon ge ipo ian Heed pge a asig
#»
K80 16 mm
W e
'
- # - - Porfyr K100 16 mm
g 6 p94 4 fe hair f eee e H i o o o aaa
--&- Porfyr K80 8 mm
Fu & fo -one ai m lam m p on p an man ag apwh me wl peting Al adhesion al
--J¥- Porfyr K100 8 mm
CG0
--K-- Durasplit K80 16 mm
*
.
- - O - -«Kvartsit K80 16 mm
%
e*- sal ~ 5
--@©-- Reference concrete
3
If _ (32 {== ~~~ ~~ ~~Z .M ***
AT pools $
1+" "UG .-- ~s sali isan nala sl aln a.
I
z t And
-0 ar + ( P 4 i 4 i i |
O & O O & & O & & & & O O&O O O O O O O & O&O fa» & & & & & &
O O & O O O O O O
C) (O O) O LC) CO «- <I I-r- r- r- OU CO ed no of revolutions
Figure 4 Development of wear in the Swedish road simulator.
Development of wear in the Norwegian road simulator is set out in Fig. 5.
Development of wear in the Norcem road simulator 16 E Je C& 0 <
O && && && [ap]& && &O (a»)&
O O & O & O O
O O [ap] O [ap] a» O
r- COJ C) T L0) CO
I-no of revolution
Figure 5 Development ofwear in the Norwegian road simulator.
-- Porftyr K80 16 mm -Q- Porfyr K100 16 mm -&- Porfyr K80 8 mm -- Portyr K100 8 mm -K- Durasplit K80 16 mm -O- Kvartsit K80 16 mm -©- Reference concrete
Development of wear in the Finnish road simulator, expressed as cross
secti0-. pe s s
nal area removed in terms of ecm, is set out in Fig. 6.
Development of wear in the VTT road simulator
25 Io O moc k Un woh O Ar ea re mo ve d, cm 2 Un no of revolution*1000
Figure 6 Development of wear in the Finish road simulator.
It is seen from the figures that, in all road simulators, wet wear is
--®&--K80 Porfyr 16mm T - - { - -K 100 Porfyr 16mm --i#&--K80 Porfyr 8mm Porfyr 8mm --K--K80 Durasplit 16 mm --@-- Reference concrete greater than dry wear. In the Finnish road simulator tests are started with 30,000 revolutions of wet wear, which is equivalent to 30,000 revolutions of dry wear in the Swedish
road simulator and to 10,000 revolutions of dry wear in the Norwegian road simulator.
5.2 Relative SPS, according to the original draft CEN method
According to the original draft CEN method, wear shall be reported in the form of a relative SPS, value (specific wear in tests in a road simulator) which is calcu-lated on the assumption that the reference concrete has the SPS, value = 9.0.
The calculated SPS, value is a material parameter and is not to be confused with SPS values obtained during wear measurements on the road.
Since wear in the Finnish road simulator is reported in terms of removed cross sectional area, the values have been converted into a comparable mean rut depth across the whole rut width of 240 mm.
In the report from the Norwegian road simulator (Appendix No 2), the relative SPS, values of the reference slabs were put at 9.5. The results of the Norwegian simulator have therefore been converted in accordance with the draft CEN method to give the reference slabs a relative SPS, value of 9.0 as in the other simulators.
SPS, values calculated in accordance with the original draft CEN method are set out in Table 5.
Table 5 Relative SPS, values from the ring analysis.
Test slabs VTI Norcem VTT
Porphyry K80 16 mm 4,6 5,2 3,9 Porphyry K100 16 mm 4,1 4,6 5,6 Porphyry K80 8 mm 6,7 7,1 5,4 Porphyry K100 8 mm 5,7 5,0 5,8 Durasplit K80 16 mm 8,3 7,8 12,6 Quartzite K80 16 mm 5,7 6,8 Reference concrete 9,0 9,0 9,0
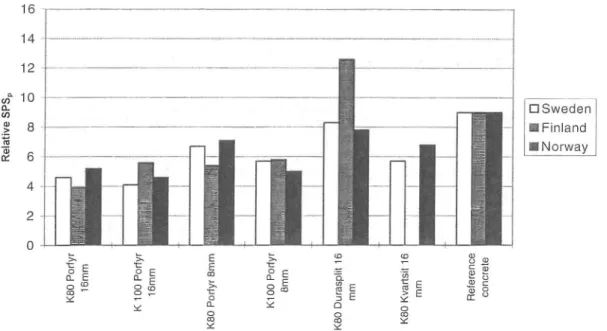
Values of SPSp for the different concrete mixes tested in the ring analysis are set out in Fig. 7. The three road simulators can be compared.
Comparison of the three Nordic road simulators SPS, in accordance with the original draft CEN method 16 14 FA ae ws 10 5 OA Sweden $ 8 -| |EFinland 3 W Norway m 6 m LIL .-| .-| WA M f I t l e l l AM H hi n K8 0 Po rt yr 1 6 m m K 10 0 Po rf yr 1 6 m m K1 00 Po rf yr 8 m m m m Re fere nc e co nc re te K 8 0 Po rf yr 8 m m K8 0 Du ra sp li t 16 m m K8 0 Kv ar ts it 16
Figure 7 Relative SPS,, values (20 % wet wear and 80 % dry wear) for diffe-rent concrete mixes tested in the three road simulators.
5.3 Relative SPS, at 50 % wet wear and 50 % dry wear
In calculating relative SPS, values in accordance with the original draft CEN method, 20 % of the wet wear properties and 80 % of the dry wear properties are aggregated. In parts of the Nordic countries where concrete roads are likely to be constructed, there is a higher proportion of wet carriageways over long periods of the winter when studded car tyres are used (see Chapter 8). It would therefore be more realistic to aggregate 50 % of wet wear properties with 50 % of dry wear properties.
Values of calculated SPS, based on equal proportions of wet and dry wear are set out in Fig. 8.
Relative SPSp 50% wet wear, 50% wet wear Norway 70 000, Finland 1230000 and Sweden 270 000 revolutions
16 14 12 _f _L $- = a. 10 = 5
f-0
=
S
a
.> 8
=]
==
==
=
fay
(
~
5
rm
s
.
=>.
37,
=>
-
3
.
co
co
co
co
o
co
® o
o
o
co
as
x.
o
5 E
co
o
x C
x
- E
co
2 5
v E
w £
a =
%
a-
Pal E
v E
_ E
3 E
-
¥ g
spout
g &
o 0
k=
6
>a
A
O
"T
0
&
=A
<
©
Q
a? Q Q §Figure 8 Relative SPS,, values (50 % wet wear and 50 % dry wear) for diffe-rent concrete mixes tested in the three road simulators.
During the tests, especially in the Finnish road simulator, a very large number of revolutions were run. The costs of testing are affected by the number of revolutions, and it is therefore interesting to see how a reduction in the number of revolutions affects the results. Relative SPSp values calculated for 50 % dry wear and 50 % wet wear after a reduced number of revolutions, 210,000 in the Swedish road simulator, 750,000 in the Finnish simulator and 70,000 in the Norwegian simulator, are set out in Fig. 9.
O Sweden § Finland W Norway
Comparison of the Nordic road simulators 50% wet, 50% dry
Norway 70 000, Finland 750 000 and Sweden 210 000 revolutions 16,0 14,0 12,0 10,0 8,0 Re la tive S P S t t t T l t t U U U K8 0 Po rf yr 16 mm K 10 0 Porf yr 16 mm K8 0 Po rf yr 8 m m K1 00 Po rf yr 8 m m K8 0 Du ra sp li t 16 m m Re fe re nc e co nc re te K8 0 Kv ar ts it 16 m m
Figure 9 Relative SPS, values (530% wet wear and 50% dry wear) for diffe-rent concrete mixes after a reduced number ofrevolutions.
A comparison of Fig. 8 and Fig. 9 shows that there are only minor changes for some of the test slabs. It should therefore be possible to reduce the number of revolutions without affecting the test results.
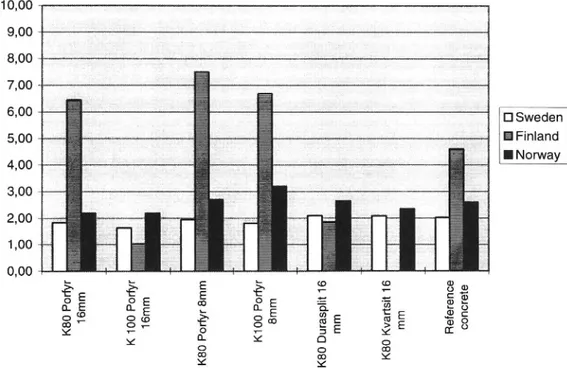
5.4 Ratio of wet to dry wear
It is seen from Fig. 10 that there are large differences between the road simulators with regard to the ratio of wet to dry wear. In most cases, the Finnish simulator has a greater proportion of wet wear. This can be explained by its low speed, be-cause of which dry wear is relatively small.
VTI meddelande 774 A 23
OSweden EB Finland Norway
Ratio of wet to dry wear 10,00 9,00 8,00 7,00
-.
6.00
iii i: OA Sweden 5,00 {--< s 5 E Finland . _ 5 < M Norway 4,00 = s G 3,00.
_:
E
'.
2,00 | -G
£
|
A
1,00 {{
E
e
_
_
<
e
0,00
L-
-
e
\
__
_
P
2 E
&
9 e
i
5 ®
3 *~
3 to
g
S ©
a E
o 2
5 6
¥
o-
x
Ao
o
G
&
co
x
C
nC
Figure 10
Ratio ofwet to dry wear in the three road simulators.
In the Norwegian and Swedish road simulators, the ratio of wet to dry wear is
normally about 2-3. In the Finnish simulator the ratio of wet to dry wear, exclusive
of initial wear, varies between 1 and 7.5 depending on concrete type and aggregate
content.
In evaluating the results in accordance with the original draft CEN method, the
relative SPS, value for the reference concrete is put at 9.0 for 80 % dry and 20 %
wet wear. This calculation presupposes that the ratio of wet to dry wear is the
same in the road simulators. Otherwise the calculated values of relative SPS, will
be different for the other test slabs.
In this study the mean value of the wet to dry wear ratio for the reference
concrete slab is approx 4.5 in the Finnish road simulator; it is approx 2 in the
Swedish simulator and approx 2.5 in the Norwegian simulator.
5.5 Relative Wear Index (RW!)
Another way of reporting and evaluating the results from the road simulators is to
compare total wear (inclusive of initial wear) for the test slabs with the total wear
for the reference slabs and in this way to calculate a relative wear index RWI.
RWI is the ratio of total wear on the test slabs to total wear on the reference
con-crete. RWI is a percentage, with wear for the reference concrete put at 100 %.
Since tests are performed during alternating periods of dry and wet wear of
equal length, total wear is the result of 50 % dry wear and 50 % wet wear.
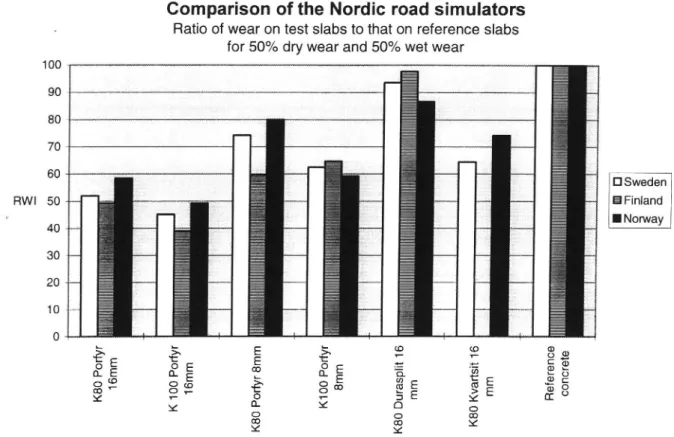
Relative Wear Index (RWT) for the different concrete slabs tested in the Nordic
road simulators is set out in Fig. 11. Since the results are reported in different
ways in the Nordic countries, the ratio of wear on the test slabs to wear on the reference slabs is calculated in the way used in each country. In Sweden the mean wear is measured across the whole rut (300 mm), in Norway it is measured only across the central 150 mm, and in Finland the removed cross sectional area is measured across the whole width (240 mm) of the rut.
Comparison of the Nordic road simulators Ratio of wear on test slabs to that on reference slabs
for 50% dry wear and 50% wet wear 100 90 80 70 OA Sweden | BFinland Norway RWI 50 +-8 | | | 30 +- I 20 4~1 [ i m o o U U U K8 0 Po rf yr 1 6 m m K 10 0 Po rf yr 1 6 m m K8 0 Port yr 8 m m K1 00 Po rf yr 8 m m K8 0 Du ra sp li t16 m m K8 0Kv ar ts it 16 m m Re fe renc e co nc re te
Figure 11 Relative wear index RWI for the different concrete slabs tested in the three road simulators.
Only dry wear and only wet wear are set out in Fig. 12 and 13 respectively. This is not to be confused with RWI which comprises both dry and wet wear.
Ratio of wear on test slabs to that on reference slabs (dry wear) 250 200 150 + O Sweden § Finland W Norway % 100 4 50 W U T K8 0 Po rf yr 16 mm K1 00 Po rf yr 8 m m m m Re fe re nc e co nc re te K 10 0 Po rf yr 16 mm K8 0 Po rt yrm m I M M } K8 0 Du ra sp li t 16 m m K8 0 Kv ar ts it 16
Figure 12 Relative wear for dry wear only.
Ratio of wear on test slabs to that on reference slabs (wet wear)
100 O Sweden § Finland W Norway % 50 + l l l . . . I I T l l l . . . T u . . . . . . T l . K8 0 Po rf yr 16 mm K 10 0 Po rf yr 16 mm K1 00 Po rf yr 8 m m m m Re fe re nc e co nc re te K8 0 Po rt yr 8 m m | J t T K8 0 Du ra sp li t 16 m m K8 0 Kv ar ts it 16
Figure 13 Relative wear for wet wear only.
It is seen from Fig. 12 and 13 that in the case of dry wear only there is satisfactory agreement between the Swedish and Norwegian road simulators. For certain materials the Finnish simulator differs from the other two. For wet wear only there is considerably better agreement between all road simulators. Perfor-mance of wear tests using only wet wear ought therefore to yield more uniform results. However, since a real pavement is exposed to both wet and dry wear, this would detract from the relevance of the results.
Mainly in the Finnish road simulator, a very large number of revolutions were run. It is therefore of interest to see how a reduction in the number of revolutions affects the results. In Fig. 14 the relative wear index RWI is set out for 210,000 revolutions in the Swedish road simulator, 750,000 in the Finnish one and 70,000 in the Norwegian one.
Comparison of the Nordic road simulators Ratio of wear on test slabs to that on reference slabs
(50% wet and 50% dry wear)
100 = 90 -80 --[ 7
é;
RWI
g
O Sweden
_
sSFinland
-
H Norway
l
l
l
U
U
U
U
U
U
Por
fyr
K8
0
16
mm
Por
fyr
K1
00
16
mm
Por
fyr
K8
08
m
Por
fty
rK
10
08
mm
Dur
asp
lit
K8
0
16
mm
Kva
rts
it
K8
0
16
mm
Re
fe
re
nc
e
con
cre
te
Figure 14
Relative wear index RWI in the three road simulators after a
re-duced number of revolutions (210,000 in Sweden, 750,000 in
Finland and 70,000 in Norway)
When a comparison is made between Fig. 11 which shows the relative wear
index RWI after the whole run, and Fig. 14 which shows it after a reduced number
of revolutions, it is seen that there is no major difference in the results. It should
therefore be possible to limit the number of revolutions without affecting the test
results. In the Finnish road simulator the number of revolutions can be reduced to
750,000 and in the Swedish simulator to 210,000.
The validity of the results is limited in view of fact that only concrete mixes of
good wear resistance were included in this study.
6 Regression relations for the road simulators 6.1 Statistical analysis of the results of the ring analysis In this chapter a simple statistical analysis is made of the results. Linear regression analysis is employed to find the relationship between the three road simulators.
The relationships between the simulators were compared depending on the method of evaluation employed. Values of SPS, were calculated from the results of the whole run, and those of RWI from the results of a reduced number of revo-lutions. The reference samples were not included in calculating the coefficient of determination (R*).
Relative SPS, in RWI in accordance accordance with the with the draft original draft
CEN-method
R' R'
Sweden-Finland 0,68 0,89
Finland-Norway 0,52 0,68
Sweden-Norway 0,79 0,86
It is evident from the above that, in accordance with the original draft CEN method, there is a better relationship for RWI than for relative SPS,.
100 90 80 70 60 50 40 30 20 10 R W I Finl an d 0 20 40 60 80 100 RWI Sweden
Figure 15 Regression line for RWI in the Swedish and Finnish road simu-lators. RWI for a reduced number of revolutions (Sweden 210,000 revolutions, Finland 750,000 revolutions).
100 90 80 70 60 50 40 30 20 10 R W I N o r w ay 0 20 40 60 80 100 RWI Finland
Figure 16 Regression line for RWI in the Finnish and Norwegian road simu-lators. RWI for a reduced number of revolutions (Norway 70,000 revolutions, Finland 750,000 revolutions).
100 90 80 70 60 50 40 30 20 10 R W I N o r w a y 0 20 40 60 80 100 RWI Sweden
Figure 17 Regression line for RWI in the Norwegian and Swedish road simu-lators. RWI for a reduced number of revolutions (Norway 70,000 revolutions, Sweden 210,000 revolutions).
14
,
I3
y = 1,66x - 3,12
& 10
0,68 _+"
R* =
C
iC
/
#:
io
peF.
2
/
P
3 4
C
\#+
.
1
a
2
O : : 0 2 4 6 8 10 12 14 Relative SPS, SwedenFigure 18 Regression line for relative
SPSp in the Swedish and Finnish road
simulators. Relative SPS,, for the whole run (Sweden 270,000
revo-lutions, Finland 1,230, 0570 revolutions).
wh J
wah NeJ
_ R=0,52
-couch O
\
Re
la
ti
ve
SP
S,
No
rw
ay
|
j
0
2
4
6
8
10
12
14
Relative SPS, Finland
Figure 19
Regression line for relative SPS, in the Finnish and Norwegian
road simulators. Relative SPS,, for the whole run (Norway 70,000
revolutions, Finland 1,230,000 revolutions).
14 12 | § T eal 3 10 [ EAY¥i 2 a 8 M 0s5 6 2 N ; < * CC 2 o
_
.
_
o
2
a
6
3
-
-
s
Relative SPS, Sweden
Figure 20
Regression line for relative SPS, in the Norwegian and Swedish
road simulators. Relative SPS, for the whole run (Norway 70,000
revolutions, Sweden 270,000 revolutions).
It is seen from Fig. 15 - Fig. 20 that in all cases there is better correlation
between the road simulators when RWI is used instead of relative SPS, in
accordance with the original draft CEN method.
The best correlation is found for RWI between the Swedish and Finnish road
simulators, with a coefficient of determination R' = 0.89. Between the Swedish
and Norwergian road simulators also there is good correlation, with R' = 0.86.
That between the Finnish and Norwegian simulators is less satisfactory, with R* =
0.68.
6.2 Extended tests in Sweden and Norway
In conjunction with prequalification for the contract for the concrete sections of
road E6 (Fastarp-Heberg), the contractors were required to make concrete slabs
for testing in the VTI road simulator. Some of these slabs were tested at the same
time in the Norwegian simulator. The results of these tests were added to the ring
analysis for the Swedish and Norwegian road simulators. Fig. 21 shows the
regression relation for SPS, for these simulators for an extended number of tests.
Calculation complies with the original draft CEN method. The regression line for
RWI is shown in Fig. 22.
20 18 g 16 § 14 o 12 @ 40 M) @ 8 .> a 6 G 4 2 0 0 2 4 6 8 10 12 14 16 18 20 Relative SPS, Sweden
Figure 21 Regression line for relative SPS, for the Swedish and Norwegian
road simulators for an extended number of tests (ring analysis plus prequalification for Fastarp-Heberg).
200 180 160 140 120 100 RW I No rw ay BL O C O O O Io O O 0 20 40 60 80 100 120 140 160 180 200 RWI Sweden
Figure 22 Regression line for RWIfor the Swedish and Norwegian road
simu-lators for an extended number of tests (ring analysis plus prequali-fication for Fastarp-Heberg).
In both cases, correlation is worse when the additional tests are included. It is seen from Fig. 21 and 22 that it is mainly one individual value which markedly deviates from the regression line.
Relative SPSp in accordance with original CEN draft
R2 Sweden - Norway (ring 0,79 analysis)
Sweden - Norway 0,70
extended number of tests
Sweden - Norway 0,83
extended number of tests exclusive of the outlier
RWI in accordance with draft R2 0,86 0,78 0,82
If the markedly different value is deleted, correlation between the Norwegian
and Swedish road simulators is better. The value of R* for relative SPS, is 0.83,
and that for RWI 0.82. Fig. 23 and 24 show the regression line for relative SPS,
and RWI for the extended number of tests in Sweden and Norway, without one
outlier. 20,0 18,0 16,0 14,0 12,0 10,0 8,0 6,0 4,0 2,0 0,0 R e l a t i v e S P S , N o r w a y 0,0 2,0 4,0 6,0 8,0 10,0 12,0 14,0 16,0 18,0 20,0 Relative SPS, Sweden
Figure 23 Regression line for relative SPS, for the Swedish and Norwegian
road simulators for an extended number of tests (ring analysis and
Fastarp-Heberg prequalification, without one outlier).
200 180 R W I No rw ay 0 O Figure 24 20 40 60 80 100 120 140 160 180 200 RWI Sweden
Regression line for RWIfor the Swedish and Norwegian road simu-lators for an extended number of tests (ring analysis and Fastarp-Heberg prequalification, without one outlier).
7 Conclusions
Evaluation in accordance with the original draft CEN method yields similar results for the Norwegian and Swedish road simulators. The results for the Finnish simu-lator deviate to some extent from the results of the other two. In the tests the con-crete pavement is worn away by alternate wet and dry wear. In calculating the relative SPS, it is assumed that the reference concrete has an SPS, value of 9.0. For purposes of calculation, 80 % of dry wear properties are put together with 20 % of wet wear properties.
During the winter when vehicles with studded tyres travel over the pavement, conditions are predominantly wet. A larger proportion of wet wear must therefore be taken into account, not only 20% as prescribed in the present CEN draft.
The ratios of wet to dry wear are different in the Nordic road simulators. In the Swedish and Norwegian road simulators the ratio of wet to dry wear is 2-3, while in the Finnish simulator the mean wet to dry wear ratio is approx 4.5 for the refe-rence concrete. Differefe-rences in the wet to dry wear ratios of the simulators will re-sult in differences in SPS, for the test slabs.
In the Finnish road simulator there is very little dry wear compared with wet wear. This is probably due to the fact that the test speed is considerably lower, 31 km/h. The deviation in wet to dry wear ratio is greatest for the Finnish simula-tor. Agreement would probably improve if the speed could be increased. Better agreement could also be achieved if all road simulators had the same type of tyre and studs of the same weight.
One alternative way of setting out the results is to compare the total wear on the test slabs, inclusive initial wear, with the total wear on the reference concrete and to obtain a value for relative wear in this way. This is found to produce relatively good agreement between the three Nordic road simulators. When this method is used, the wear resistance is expressed in terms of the relative wear index RWL.
When only wet wear is compared, there is good agreement between the road simulators. Tests involving only wet wear would accelerate testing and would extend the life of tyres, mainly in the Finnish and Swedish simulators.
Mainly in the Finnish road simulator, a large number of revolutions, more than 1.2 million, were run. An analysis of the results of the Finnish simulator shows that a constant ratio between the test concrete and the reference concrete is ob-tained already after 750,000 revolutions (see Appendix No 1, Fig. 7). It should therefore be possible to limit the number of revolutions to 750,000. In the Swedish road simulator also the total number of revolutions can be reduced from 270,000 to 210,000 without any appreciable effect on the results.
The different concrete pavements have been classified in accordance with the original draft CEN method. Pavements are assigned to 5 wear classes ranging from 0 to 4 depending on the relative SPS, value of the pavement. Alternative classification on the basis of RWI is also shown in Table 5. In calculating RW1L, account is taken of the reduced number of revolutions in the Finnish and Swedish road simulators.
Table 5 Assignrizent of concrete pavements to wear classes in accordance with the original draft CEN method, and alternative classification on the basis of the relative wear index RWI
Class Relative SPS, in RWI! (Relative Wear Index)
accordance with draft CEN method
0 No test required No test required
o > 12-18 135 < RWI
2 > 10-12 110 < RWI < 135
3 > 8-10 85 < RWI <110
4 <8 RWI < 85
In Table 6 the pavements included in this ring analysis have been assigned to wear classes in accordance with the original draft CEN method, expressed in terms of relative SPSp, and on the basis of the relative wear index RWI.
Table 6
Comparison ofSPS, with RWT (Relative Wear Index)
Material
Relative SPS,
RWI
CEN Class
in accordance
with original
draft CEN
method
Relative SPS, Alternative
Original CEN
classifica-method
tion by RWI
Porphyry K80 16 mm
VTI
4,6
54
4
4
VTT
3,9
49
4
4
Norcem
5,2
58
4
4
Porphyry K100 16 mm
VTI
4,1
46
4
4
VTT
5,6
41
4
4
Norcem
4,6
49
4
4
Porphyry K80 8 mm
VTI
6,7
75
4
4
VTT
5,4
59
4
4
Norcem
7,1
80
4
4
Porphyry K100 8 mm
VTI
5,7
63
4
4
VTT
5,8
64
4
4
Norcem
5,0
59
4
4
Durasplit K80 16 mm
VTI
8,3
95
3
3
VTT
12,6
95
1
3
Norcem
7,8
87
4
3
Quartzite K80 16 mm
VTI
5,7
64
4
4
VTT
Norcem
6,8
74
4
4
Reference concrete
VTI
9,0
100
3
3
VTT
9,0
100
3
3
Norcem
9,0
100
3
3
It is seen from Table 6 that for the tested concrete materials there is good
agree-ment, and that in all road simulators it is possible to assign a concrete pavement to
the correct class.
At present there is insufficient statistical material available to establish which
of the three road simulators best agrees with real wear on the road. Wear
measure-ments are in progress on concrete roads and there are plans for these to be
extend-ed to all three countries which participatextend-ed in this analysis. These results will be
used and compared with the results obtained in the road simulators. Certain
para-meters which were fixed during the tests in the simulators, such as wet to dry
ratio, speed and the number of passages, vary on roads.
In this study all concrete samples were better than the reference concrete. Parallel with the ring analysis further tests were made in conjunction with the prequalification procedure for the contract for the concrete sections of road E6, Fastarp - Heberg. These results have been separately incorporated into the report (see Clause 6.2).
On the basis of the results of this study, a proposal has been drawn up for a common test method, to be used in the road simulators included in this ring ana-lysis. This proposal can be used as the basis in revising the CEN method.
When a revised CEN method has been produced, a new ring test should be carried out to verify the revised test method. Such a test should also include con-crete pavements of a wear resistance inferior to that of the reference concon-crete, so that assignment to different wear classes may be improved.
8 Road condition studies in Sweden
In Sweden the National Road Administration has carried out visual road condition observations which were then entered into the Swedish Road Database. In order to have an idea of the road conditions which prevail during the period when vehicles with studded tyres travel over the carriageway, a search was made in the Road Database for a number of sections of some national roads for the winter 1993-94.
The road sections were divided into forecasting regions. With some exceptions, these forecasting regions coincide with counties. The observations referred only to wheeltracks (outside these the condition of the road is of no interest). Four road condition classes have been used
- Wet road free of snow -_ Damp road free of snow
Dry road free of snow -_ Road covered with ice/snow
The percentages of the four road condition classes form the basis for the distri-bution of road conditions.
The results, divided into dry carriageway and damp/wet carriageway, are plotted in Fig. 25. Periods when the carriageway was covered with snow or ice are not reported. Periods when the carriageway was damp or wet are shown together. Fig. 25 sets out the proportions of dry and damp/wet carriageway. The proportions of dry and damp/wet carriageway are weighted with respect to vehicle mileage, which implies that periods when there is a lot of traffic on the road are weighted higher than those when there are only a few vehicles on the road. The results for all four road condition classes are given in Appendix No 4.
Distribution of road condition during winter 1993-94 Distribution weight respect to vehicle mileage
100 90 4
80
O dry
Wdamp and wet
| Os le rg at la nd G o m m e I -n d a Os le rg al la nd E 2 2 ' -| 4 | h e e i e t o o a a h I o n o m e r G a n t r a n rad E 6 Ha ll an d E 6 b e I . . -H a l l a n d E 6 b e t o n g v a g -| xd © C xxxxx A A hut «w L L ® 5 4 % ) ® U p p l a n d E 4 J o n k é p i n g E 4 se e B l e k i n g e £ 2 2 to ms l t E s * f d e n k e p i n g i t y a o A p n e U p p l a n d E 1 8 S : a O r e b r o E 1 8 S : a O r e b r o E 2 0 S :a S t o c k h o l m E 4 V a s t e r g o t i a n d E 2 0 S o d e r m a n l a n d E 2 0 N : a S t o c k h o l m E 4 S é d e r m a n l a n d E 4 f S : a S t o c k h o l m E2 0 N : a S t o c k h o l m E 1 8 G o t e b o r g 0 B o h u s l a n
Figure25 Roadcondition distribution, winter 1993-94.
It is seen from Fig. 25 that, in most places inthe investigatedregions, carriage-ways are more often damp/wet than dry. On E4 in the Stockholm region there are more dry than damp/wet carriageways, the probable reason being that traffic dries the carriageway more quickly on roads carrying a lot of traffic. The results show that the wear resistance of concrete pavements should be tested by both dry and wet wear. Arelevant test method should comprise 50% wet and 50% drywear.
9 Alternative proposal for a common test method for determination of the wear resistance of con-crete pavements
In view of the results obtained in the ring analysis, an alternative proposal is out-lined below for a common test method for determination of the wear resistance which can be used by the three road simulators included in the analysis.
The proposed method is based on equal proportions of dry and wet wear. In the Swedish and Norwegian road simulators, initial wear is determined under dry wear conditions, while in the Finnish simulator it is determined under wet wear conditions.
The following are proposed:
e The wear of the concrete pavement is compared with that of a reference concrete. The relative wear index RWI is calculated and is expressed as a per-centage of the wear for the reference concrete.
e Wet and dry wear are given equal importance.
Test programme
After the concrete segments have been placed in the road simulator, a zero test of 1000 revolutions is run under dry conditions, in Finland under wet conditions. Seven test periods are then run as set out in Table 7. Wear is measured after each period.
Table 7 Alternative proposalfor a test programme.
VTI Norcem VTT Period
No of revs No of revs No of revs No 1000 dry 1000 dry 1000 wet 0 30000 dry 10000 dry 30000 wet 1 initial wear 30000 dry 10000 dry 120000 wet 2 30000 wet 10000 wet 120000 dry 3 30000 dry 10000 dry 120000 wet 4 30000 wet 10000 wet 120000 dry 5 30000 dry 10000 dry 120000 wet 6 30000 wet 10000 wet 120000 dry 7 Total No
of revs:
210000 70000 750000
According to this test programme, three times as many revolutions are run in the Swedish road simulator as in the Norwegian one, exclusive of initial wear. In the Finnish road simulator 12 times as many revolutions are run as in the Norwegian one, exclusive of initial wear, and 4 times as many as in the Swedish simulator, exclusive of initial wear.
The wear profile shall be made up of measurement points spaced not more than 5 mm apart across the rut.
Evaluation of results
The test results are reported in terms of the Relative Wear Index RWL.
RWI is calculated as the ratio of the total wear on the test slab to the total wear on the reference concrete and is expressed as a percentage.
total wear (inclusive of initial wear) on the test slab
total wear (inclusive of initial wear) on the reference concrete slab S
SI
RWI = s/sr x 100
Presentation of results
The value of RWI is rounded to the nearest whole number.
Development of wear shall also be plotted in a diagram, with the mean wear (in mm) along the vertical axis and the number of revolutions along the horizontal axis.
The following wear classes are proposed:
Class RWI! (Relative Wear Index) 0 No test required 1 135 < RWI #4 110 < RWI < 135 3 85 < RWI < 110 4 RWI < 85
10 Bibliography
Barland, T: Hoyfast betong - utveckling av slitefast vegbetong 1985-89. (High strength concrete - development of wear resistant concrete for roads, 1985-89). (In Norwegian). Norcem Cement A/S, Slemmestad 1989.
Hultqvist, B-A and Carlsson, B: Inledande studie av betongbeliaggningars slit-styrka i provvigmaskin. (Preliminary study in a road simulator of the wear resistance of concrete pavements). (In Swedish). VTI Memorandum No
55-1995, Linkoping 1996.
\/ SsAMHALLsBYGGNap ocH Bulaga ! Appendix 1 Page 1 (13) 1(11) INFRASTRUKTUR Sid 1 (13 FORSKNINGSRAPPORT Nr. YKI 347/95
Vag- och geoteknik
RINGANALYS AV PROVVAGSMASKINER FOR DUBB-DACKSSLITAGE PA BETONG
DELRAPPORT: FORSKNINGAR MED VTT'S PROVVAGSMASKIN
Uppdragsgivare Vigverket/Tpk
Vigverket/Nylands distrikt Lohja Rudus Oy Ab Finnsementti Oy
VTT Viag- och geoteknik
Bestillning Vigverket/ Tpk-239/0370/213/12.12.1994/0. Anttila
Vigverket/Nylands distrikt/ PBV-52/196/93/U/28.12.1994/J. Imonen Lohja Rudus Oy Ab, 3.1.1995/ K. Sivula
Finnsementt Oy, 3.1.1995/ P. Haapakoski
Behandlad av Specialforskare Kyosti Laukkanen, tel. (90) 456 4927
Provstycken Betongplattor 6 stycken for VTT's provvigsmaskin - 5 plattor blev gjuten av AB Sydsten, Betonglaboratoriet
_
1 Sodra Sandby, Sverige
- 1 referensplatta blev gjuten av Norcem, FOU Veglaboratorium
1 Brevik, Norge
Esbo, 21.4.1995
Chef, Vig- och geoteknik
o
VM
Professor
, Asko Saarela
Specialforskare
Kyost! Laukkanen
BILAGOR
2 st.
DISTRIBUTION
VTI, Vigkonstruktion, Bo Carlsson
Uppdragsgivarna
VTT SAMHALLSBYGGNAD OCH
Varmemansgranden 2, Esbo
Tel. +358 0 4561
INFRASTRUKTUR
PB 19031
Telefax +358 0 463 251
T SAMHALLSBYGGNAD ocH Bilaga l Appendix 1 Page 2 (13) 2(11) INFRASTRUKTUR Sid 2 (13 FORSKNINGSRAPPORT Nr. YKI 247/95
Vag- och geoteknik
SAMMANFATTNING
MAI for ringanalys ir att soka korrelation mellan notningshallfasthet av betongbeliggningar med tre nordiska provvigsmaskiner. Maskinemna som jamfordes var VITT's och VTTI's provvigsmaskiner och den norska Vejslitaren.
Denna delrapport innehaller resultat med VTT's provvigsmaskin. PA grund av resultat av tre provvigsmaskiner skrives en slutrapport vid VTI. Resultaten utnyttjas 1 CEN-standardiserings-arbete.
I ringanalysen forskades 5 olika betongplattor (K80...K100, D,,, = 8 eller 16 mm, stenmatenial Porfyr eller Durasplitt). Fem plattor tillverkades i Sverige och en "referensplatta" 1 Norge. I framtiden tas till alla provvigsforskningar en referensplatta med, sammansittning av vilken bestimmes 1 CEN-standard.
Resultaten har raporterats bade av hela provet och utan initialslitaget. Vit korning slit betong 1...7 ganger sa snabbt som torr korning. Torr korning sliter diick och dubbar, vilket gor notning | langsammare i slutet av korningen. PA VTT's provbana kordes 1230000 vary, vilket ir mera din nagonsin tidigare. I framtiden borde varvantalet vara under 700 000, vilket ricker for att befinna skilnader mellan olika betongtyper.
Alla provvigsmaskiner ir helt olika. Betongtyper varierar i olika forskningar och dirfor varierar ocksd notningshastighet av dick och dubbar. Dirfor borde kravet for en ny betongbe-liggnings vara relativt med notningshallfasthet av referensplatta.
T SAMHALLSBYGGNAD OCH bilaga 1 Appendix 1 Page 3 (13) 3(11) INFRASTRUKTUR Sid 3 (I &RORSKNINGSRAPPORT Nr. YKI 347/95
Vag och geoteknik
-YHTEENVETO
Koetiekoneiden rengasanalyysin tavoitteena on etsi@ riippuvuus kolmen pohjoismaisen koetiekoneen betonipi@illysteiden kulumiskestivyystulosten vililli. Vertailtavat laitteet ovat VTT:n koetiekone, noralainen Vejslitare ja VTII:n koetiekone.
Tassa
osaraportissa esitetiin VTT:n koeradalla saadut tulokset. Kolmen koetiekoneen tulosten
perusteella laaditaan loppuraportti VTI:ssi@. Loppuraportin tulosten perusteella laaditaan
CEN-standardi betonipiillysteen kulumiskestivyyden mittaamisesta koetiekoneen avulla.
Koeajossa oli kuusi erilaista betonilaattaa (K80...K100, D,,, = 8 tai 16 mm, kiviaines Porfyyri
tai Durasplitt). Laatoista viisi valettiin Ruotsissa ja kuudes vertailulaatta Norassa. Jatkossa
pyritiin kaikkiin betonip@i@llysteiden koetiekoneajorthin ottamaan mukaan samanlainen
vertailulaatta, jonka koostumus midritiin CEN-standardissa.
Tulokset on ilmoitettu erikseen koko ajetun kulutusajon perusteella seki siten, etti tuloksista
on laskennallisesti poistettu alkukuluman vaikutus. Alkukuluman vaikutus on esitetty kahdella _
vaihtoehtoisella tavalla.
Heikoin betoni kului noin 2,5 kertaa niin nopeasti kuin kestivin betoni. Mirkiajo kulutti
betonia laatasta riippuen 1...7 kertaa niin nopeasti kuin kuiva ajo. Kuiva ajo kuluttaa rengasta
ja nastoja, mika hidastaa betonin kulumisnopeutta pitkin ajon loppuvaiheessa. VTT:n
koeradal-la ajettin 1 230 000 kierrosta, joka on enemmiin kuin koskaan aiemmin yhdessi ajossa tilli
radalla. Tulevaisuudessa kierrosmi@liria tulisi rajoittaa enintiin 700 000 kierrokseen, miki
eri betonityyppien keskindisten kulumiskestivyyserojen selvittimiseen.
Kaikki vertaillut koeradat ovat erittiin paljon toisistaan poikkeavia. Kun betonityypit
vaihtele-vat eri ajoissa, muuttuu myos renkaiden ja nastojen kulumisnopeus pitkin kulutusajon aikana.
Tasti syystd vaatimusarvot tulisikin esittid4 suhteellisena arvona jokaisessa ajossa mukana
olevan referenssilaatan kulumiskestivyyteen verrattuna.
Anviandning av Statens Tekniska forskningscentrals (VTT) namn i reklamsyfte eller delvis publicering av denna
VTI medip@ban@ifitresndast med skriftligt begivande fran Statens tekniska forskningscentral.
T ock BU382! Appendix 1 Page 4 (13) 4(11) INFRASTRUKTUR Sid 4 (1 &BORSKNINGSRAPPORT Nr. YKI 347/95
Vag och geoteknik
-TEKNISK DATA OM VTT'S PROVVAGSMASKIN
Tabell 1 teknisk data om VTT's provvigsmaskin.
-Tabell 1. . Egenskaper av VIT s provvagsmaskin.
EGENSKAP
Diameter av provbana (inre/yttre) 3,1 m/ 3,7 m
Korhastighet 31 km/h
Antal av hjul 4
Hjullast 0,4 ton
Dick Nokia M+S Hakkapeliitta 10
Dickstorlek 165 R 13 82 Q
(en vanlig 13" personbilsdick)
Dicktryck 0,22 MPa Dubbtyp Kometa P8-110/1,8 Dubbvikt 1,8 g Dubbantal _| 90 stycken/dick Dubbutstick 1,2 mm Slitsparens bredd 24 cm
Fundaments exenterrorelse 10 cm, 1 vary/min
Betongformar (segment) 6 stycken, h= 90 mm, b= 300 mm, L= 1700 mm
PA varie platta mits enligt korprogram den hela avnotta mingden av 5 profiler (arean av hela profilen). Profilen mits med en laserutrustning pd ett avstand av 0,25 mm.
PLATTORNA
I ringanalys forskades sex olika betongplattor, tabell 2.
Proportionering av referensplattan kommer att utgivas 1 CEN-utkasten som tillrittaliggs efter ringanalysen.
VTI gav data om proportionering av stenmaterial (tabell 3) och egenskaper av betong (tabell 4). Stenmaterial var Alvdalsporfyr fran "Kulmott" och en kvartsdiorit (varumiirke Durasplitt) fran Norge.
VW SAMHALLSBYGGNAD OCH Bilaga 1 Appendix 1 Page 5 (13) 5(11)
INFRASTRUKTUR Sid 5 (1BORSKNINGSRAPPORT Nr. YKI 347/95
Vag och geoteknik
-Tabell 2. Materialegenskaper av betongtyper.
Nr Stenmaterial Dmax 1 K80 Porfyr 16 -2 K100 Porfyr - 16 3 K80 Porfyr 8 4 K100 Porfyr 8 3 K80 Durasplitt 16 6 K90" Durasplitt 16
" TryckhAllfasthet ay referensbetong nr. 6 forskades i VTT 19.4.1995 med tvi
100*100*100 mm* kuber enligt en norsk standard (belastningshastighet
0,25 MPa/s). Tryckhallfasthet
var 94,6 och 94,8 MPa, vilka motsvarar 90,1 och
90,3 MPa med 150*150*150 mm* kuber.
Tabell 3.
Proportionering av stenmaterial (plattorna nr. 1-5).
u
Stenmaterial
D,,,= 8 mm
Du,,,.= 16 mm
0-2 mm
35 %
-0-4 mm
-
35 %
4-8 mm
65 %
-8-16 mm
-
65 %
Cementsort
Anliggningscement
Silika, % av cementvikt
5
Flytinsats
Flyt 92 M
Luftporbildare
Cementa L 16
Tabell 4.
Tryckhdllfasthet, luftinnehdll och vatten/bindemedelstal (plattorna nr. 1-5).
K80
K100
Tryckhiallfasthet, MPa
87...88
107...108
%
4,0
2,3
Vatten/bindemedelstal
0,35
0,30
Anvandning av Statens Tekniska forskningscentrals (VTT) namn i reklamsyfte eller delvis publicering av denna
VTI meddppamaéd1&eséndast med skriftligt begivande fran Statens tekniska forskningscentral.
\/ SAMHALLSBYGGNAD OCH Bilaga 1 Appendix 1 Page 6 (13) 6(11) INFRASTRUKTUR Sid 6 (1 BORSKNINGSRAPPORT Nr. YKI 347/95
Viag och geoteknik
-Betongplattorna gjots i boran av november 1994. -Betongplattorna nr. 1-5 gjutna av AB Sydsten var for tunna. Formkanten var 90 mm hoga, men betongplattornas tjocklek varierade mellan 60-85 mm! Tjockleken varierade ocksa pa samma platta och dirfor var betongytan
ojimn i korriktningen.
-Cementlimmet pa ytan av betongplattor nr. 1-5 var borttaget. Diremot cementlimmet pia referensplattan nr. 6 gjuten av Norcem var inte borttaget.
KORPROGRAMM
Komingar pa VTT's provvigsmaskin borjade den 30.1.1995 och slutade den 15.3.1995. Korprogrammet var som foljande:
1. nollmi@tning efter 1 000 vary vatt
2. mitning efter 30 000 " vatt initialslitage 3. mitning efter 60 000 " vatt
4. mitning efter 60 000 " torrt 5. mitning efter 120 000 " vatt 6. mitning efter 120 000 " torrt 7. mitning efter 180 000 " viatt 8. matning efter 180 000 " torrt 9. miatning efter 240 000 " vatt 10. mitming efter 240 000 " torrt
Totalantalet av vary blev 1 230 000 vary. Totalantalet var storre in nagonsin tidigare pa VT Ts provvigsmaskin.
Initialslitaget kordes vatt och diirefter kordes alltid forst vatt och sedan torrt. Orsaken till att kora forst vatt ir, att da haller dubbdicken bittre under hela provningen och dirfor blir totalvarvantalet mindre.
RESULTAT
a) Slitage under hela provet
Under hela provet (1 230 000 vary) slit de fyra betongtyperna, som innehill Porfyr mindre in de som inneholl Durasplitt. Det minsta slitaget hade betongtyperna, som innehill Porfyr D,,, = 16 mm, figur 1 och bilaga 1.
En andring av Porfyrs maximala stenkornstorlek fran 8 mm till 16 mm hade ett inflytande av -18 % pa slitaget (med planerad K80) och -40 % (med K100). Nir den maximala stenstorleken var 16 mm, minskade slitaget 20 % vid en forbittring av planerad tryckhallfasthet fran K80 till K100, tabell 5.
f
V I I
SAMHALLSBYGGNAD OCH
INFRASTRUKTUR
Bilaga 1
Viag- och geoteknik
Appendix 1 Page 7 (13)
Sid 7 (13RORSKNINGSRAPPORT Nr. YKI 347/95
7(11)
Betongtyper, som inneholl Durasplitt slit mest. De slit under hela provet cirka 2,5 ganger sa
mycket som den bista betongtypen, figur 1.
PA referensplattans yta var cementlimmet kvar, nir korningar startades. Cementlimmet pa ytan
av andra plattor var borttaget. Det betydde att referensplattan slits snabbare an de andra i
borjan av provet. Det maximala slutspardjupet varierade pa olika plattor mellan 7,5...15 mm,
figur 2.
1
1
14
4
4
G
e
O
<
E
3
E
<
K8O/ 16 mm P
_~..-K100/ 16 mm P K8O/ 8 mm P _a.-K100/ 8 mm P K8O0/ 16 mm D .. .. referens 0 200 400 600 800 1000 1200 1400 Antal vary * 1000Figur 1. Avnott miangd (cm2) under hela provet.
16 e 14 K8O/ 16 mm P _.--12 K100/ 16 mm P irwsg A ...
_@---E SC
~*
TTT
we
K8Q/ 8 mm P
*-*
Arc--*~-
er _ig
CJ«
© Bf--
sr
c
-ne K100/ 8 mm P
E ll, " , ... * O _-080 Fig-5 S| AX - x K80/ 16 mm D B -- as tlkgws 4 - I ate?" - 3 fy referens >| . T -T T j 1 T o 200 400 600 800 1000 1200 1400 Antal vary * 1000Figur 2. Maximalt spardjup (mm) under hela provet
Anvindning av Statens Tekniska forskningscentrals (VTT) namn i reklamsyfte eller delvis publicering av denna