PULP MILL HEAT AND MASS
BALANCE MODEL
Exploring the benefits and possibilities of process modelling as an applied
method in a case study
SIMON MÄHLKVIST PONTUS NETZELL
School of Business, Society and Engineering Course: Degree Project in Sustainable Energy Systems & Degree Project Energy Engineering Course code: ERA401 & ERA403
Supervisor: Moksadur Rahman Examinor: Anders Avelin Date: 2018-10-17
ABSTRACT
This thesis focused on the modelling of a pulping process. The purpose was to see if an accurate model can be crated based on relatively simple premises and if the errors can be identified or analysed. To realise this, the authors conducted a literature study to identify the current state of the art regarding the chemical pulping process. In addition, flow charts and sample data from a case study were examined. Based on the literature review and case study, model assumptions were derived. The model is divided into sixteen components. Where mixing occurs, lumped conditions are assumed. The model has five validation points, four of which are temperatures and a mass flowrate. These are shown as deviations from the measured values. In conclusions, it was the model could produce stable results over a narrow time frame. More so if the transition period at the start of the simulation is overlooked. Several new model assumptions are presented with the purpose to increase accuracy e.g. account for the components ability to store mass.
Keywords: Energy balance model, kraft pulping, component based modeling, heat and mass balance model, digester model, impregnation vessel model, chip steaming and feeding model.
PREFACE
This report has come into being with the support of FUDIPO research project and Mälardalen University Sweden. Supervisor Moksadur Rahman from Mälardalen University Sweden presented a research gap and highlighted the need of models in the pulp and paper industry focusing on energy usage. In collaboration with the research project FUDIPO and a pulp and paper plant, where especially one of the plant managers have been very helpful, a model has been created. The work has been done with a lot of freedom, without an over specified goal but with a lot of support from supervisor, the plant manager and the examiner.
A very special thanks to the plant manager, we could not have done it without you, as well as our supervisor Moksadur Rahman. Thanks!
The introductory part of the report such as Introduction and Method has been written and produced by both authors in collaboration. When the goal of the project was set, tasks was divided between the both. There has been collaboration about practically every task but differences in areas of responsibility.
Pontus Netzell have had the main responsibility of the literature review regarding previous scientific reports and models created, concluded in Literature study. The main responsibility of the case study, where tasks such as analysing process flow charts, communicating and gathering measurements data and concluding them both into component models designed with pen and paper, has been in the hands of Pontus Netzell. This has resulted in the chapter Modelling approach. Critical analysis of the model results, and the assumptions made, regarding physical properties and thermodynamic relations was mostly concluded in Analysis of each components average result and assumptions by Pontus Netzell. Moreover, the critical analysis of the methods used when generating the results is performed by the above mentioned and concluded in chapter Data gathering methods sets limits for modelling.
Simon Mählkvist have had the main responsibility of the literature review regarding system understanding and process knowledge, concluded in the model. Apart from learning about the system theoretically the programming language have been totally in the hands of Simon Mählkvist. Learning to handle, designing the components and analysing the structure of the model in OpenModelica is included. Also, creating the equations presented in Modelling approach and connecting the measured data to the model. The chapter Results is concluded by the Simon Mählkvist. The software Illustrator is handled by undersigned to create the figures of the modelled components. The discussion section Design decision is concluded and performed by Simon Mählkvist.
Solving the model, choosing validations points and making model assumptions has been performed in collaboration.
SUMMARY
The pulp making process starts with the acquisition of the raw material: forestry, i.e. growing, cutting down and trimming trees as raw material. The logs are debarked and cut down to smaller wood chips. Chips are injected in the pulping process, heat and chemicals is added, the wood chips dissolve in the delignification process and pulp is produced and prepared for the papermaking process. This field is interesting to study since, according to the International Energy Agency, the pulp and paper industry is accountable for 2 % of the total energy usage and the need for sanitary and packaging paper is increasing due to population growth. The company collaborating in this work are actors and owners of the whole chain, i.e. from forest to milk cartons. They are using a chemical pulp making method called Kraft pulping and mostly producing wet-board cardboard on-site for food packaging.
This thesis is an effort to devise a component-based model built on heat and mass balance equations. Process System Engineering (PSE) is a field of study that breaks the complexity of nature into manageable parts for study. When the challenge of understanding and describing nature is approached, a mathematical model representing the system can be created. Modelling a pulp mill enables analysis of the system that the model represents. This analysis can lead to a deeper understanding of the system or parts of the system that in turn can lead to optimizations measures, which is one of the main purposes of PSE.
The purpose of this thesis is to explore if an accurate model can be created based on easily understood assumptions. Additionally, to check if the model error source can be identified, explained and how these errors can be corrected. This is concluded in the following research questions:
How well can a model, built on heat and mass balance equations, represent a commercial Kraft pulping process?
For this process, what factors are important to improve model accuracy?
The model is created in OpenModelica by using the Modelica programming language. Data gathering is not performed by the authors on-site by measurements on the actual process but collected via the process flow charts in communication with plant managers. The model is built around energy balances of the chip bin, steaming vessel, high-pressure feeder, impregnation vessel and digester. Only thermal energy is considered here. Physical properties of fluids are derived from discussion with the plant manager, by analysing the process flow charts, by empirical equations and assumptions. Losses, for example heat transfer to surroundings, is not considered in the model and all energy transferred to a certain component is assumed to be transferred to the fluids and wood chips. The model is built to mimic the process for one type of wood only, birch, due to the differences in the control of the system and the process strategy between them both.
To gather foundational knowledge a literature study is conducted. The gathering of information can be divided in two different approaches. First, focus lies within the identification of physical, thermodynamic and chemical processes of the system. Second, the effort goes forward by understanding the impact of the pulp industry on the world, the people
living in it and the environment and vice versa. General knowledge about the system is gathered by reading literatures and articles. Discussions with experts and researchers on the subject lead to further system understanding. When basic level of system understanding is achieved, the knowledge is anchored in a study visit to the case study plant. In-depth knowledge about the specific system and the components are obtained by analysing process flow charts and discussing further with experts and focusing the literature study on the chosen scope of this thesis. The most crucial activities are the gathering of data and laying the foundation for the model and validating the model.
The case study leads to construction of each component model and is described with the following structure. First, a general process explanation that highlights physical parameters relevant to the model. Following, a case study detailing the actual process. Then, model assumption specifying the set-up of the energy and mass balance equations. Conclusively, explanations on how the component model is solved, and what model outputs is relevant to the study? The basic steps of a continuous cooking process are chip steaming, chip feeding, impregnation, cooking, washing and pulp discharge. The process is segmented into pieces, i.e. chip bin, steaming vessel, high-pressure feeder, impregnation vessel and digester, where the impregnation vessel is divided into five components and the digester into eight.
The period in which the model is loading measured data and producing result are between
2017 February the 17th 11:00 to the 18th 10:00 and consist of 86 samples with a 15-minute
interval. The results are presented in six graphs showing model results regarding mass flowrate and temperatures including the deviation from the measured values in the validation points. The method applied for generating the model and the results is discussed and critically analysed, concluding that to model the investigated system there is a need of further work and communication with plant managers to understand the process control strategies properly. This thesis concludes that it is possible to create a model with acceptable results with the method and assumptions applied in this thesis. However, the model is not very robust and only validated for a relatively shorter period of time. To increase robustness, more effort should be put towards system understanding.
To raise model accuracy, it is the authors suggest that the model should include the buffering capacity of the components in the system. In addition, retention time i.e. how long it takes for the wood chips to travel across a component, should be taken into account to ensure that the input-data over the system can be adjusted for associated time delays. Additionally, the temperature distribution over the system should be divided into smaller where the size of the pieces represent how long it is i.e. the components should be discretized and the temperature should be calculated using numerical methods such as finite-difference. Applying discretization and numerical methods could make design decisions, causing instability, redundancy.
CONTENT
1. INTRODUCTION ...1
Background ... 1
1.1.1. Processes system engineering ... 2
1.1.2. Problem definition ... 3 Purpose ... 3 Research questions ... 3 Delimitation ... 3 2. METHOD ...6 Foundation knowledge ... 6
Process data sampling ... 8
3. LITERATURE STUDY ...9 System ... 9 Digester ...13 Washing ...14 Bleach process ...14 Recovery cycle ...16 Miscellaneous ...17 4. MODELLING APPROACH ... 18
Chip steaming and feeding system ...18
4.1.1. Chip bin...19 4.1.1.1. CASE STUDY ... 20 4.1.1.2. MODEL ASSUMPTIONS ... 20 4.1.2. Steaming vessel ...22 4.1.2.1. CASE STUDY ... 22 4.1.2.2. MODEL ASSUMPTIONS ... 23
4.1.3. High pressure feeder...24
4.1.3.1. CASE STUDY ... 24
4.1.3.2. MODEL ASSUMPTIONS ... 24
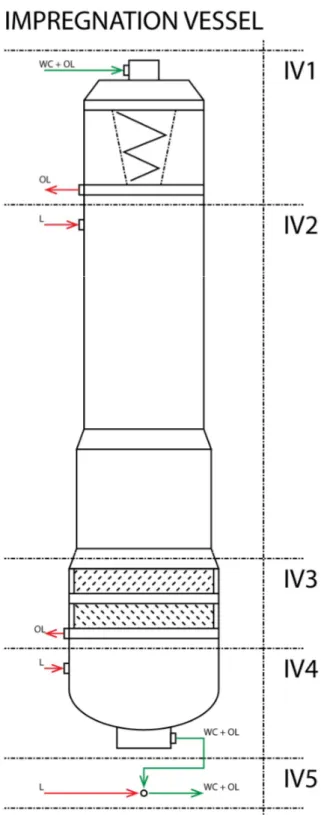
4.2.1. Impregnation vessel ...25
4.2.1.1. CASE STUDY ... 27
4.2.1.2. MODEL ASSUMPTIONS ... 27
4.2.1.3. IMPREGNATION VESSEL 1 (IV1) ... 28
4.2.1.4. IMPREGNATION VESSEL 2 (IV2) ... 28
4.2.1.5. IMPREGNATION VESSEL 3 (IV3) ... 28
4.2.1.6. IMPREGNATION VESSEL 4 (IV4) ... 29
4.2.1.7. IMPREGNATION VESSEL (IV5) ... 29
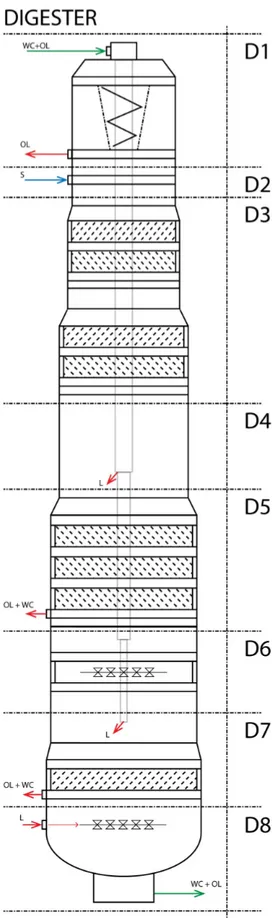
4.2.2. Digester ...29 4.2.2.1. CASE STUDY ... 31 4.2.2.2. MODEL ASSUMPTIONS ... 32 4.2.2.3. DIGESTER 1 (D1) ... 33 4.2.2.4. DIGESTER 2 (D2) ... 33 4.2.2.5. DIGESTER 3 (D3) ... 34 4.2.2.6. DIGESTER 4 (D4) ... 34 4.2.2.7. DIGESTER 5 (D5) ... 34 4.2.2.8. DIGESTER 6 (D6) ... 35 4.2.2.9. DIGESTER 7 (D7) ... 35 4.2.2.10. DIGESTER 8 (D8) ... 36 RESULTS ... 36 6. DISCUSSION... 43
Data gathering methods sets limits for modelling ...43
Design decision ...44
Analysis of each components average result and assumptions ...45
6.3.1. Chip bin...45
6.3.2. Steaming vessel and high pressure feeder ...46
6.3.3. Impregnation vessel ...47
6.3.4. Digester ...48
CONCLUSIONS ... 51
LIST OF FIGURES
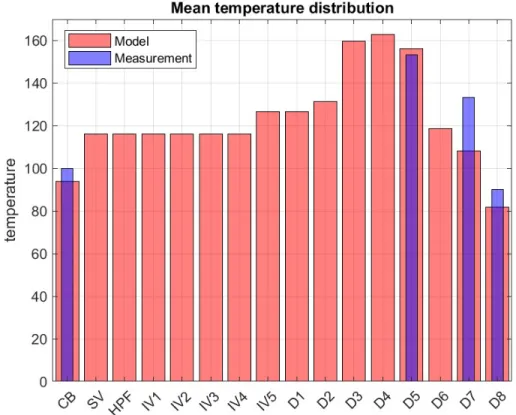
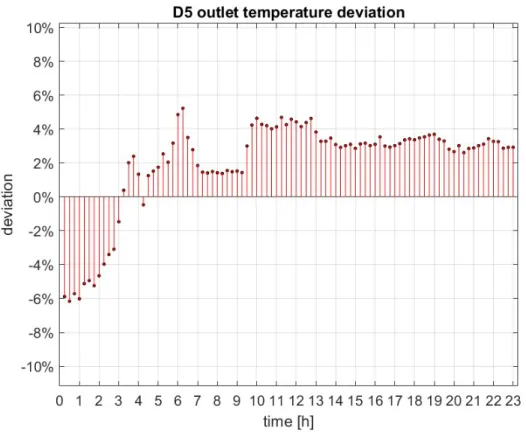
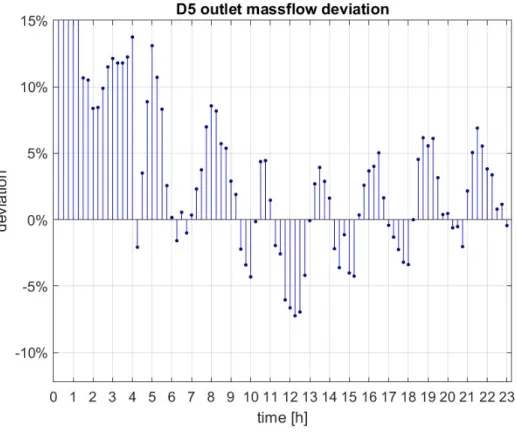
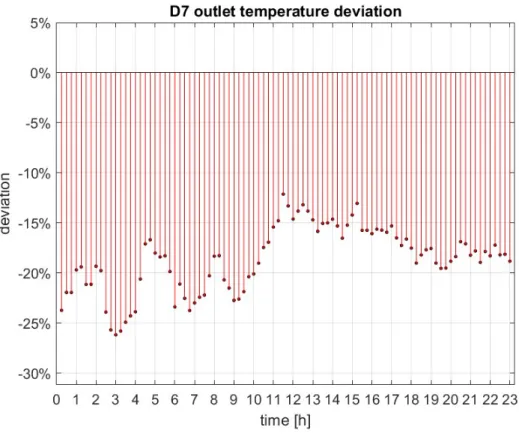
Figure 1 Number of articles regarding different section of a pulp mill. The total amount of articles is 21 and the quantity of articles of each part of the system is presented in separate categories. ...7 Figure 2 Number of articles with the topics of optimization or control. The total amount of articles is 21 and the articles subject is presented in separate categories. ...7 Figure 3 Chip steaming and feeding system including certain flows and separation of the component into three parts; chip bin, steaming vessel and high-pressure feeder. . 19 Figure 4 Impregnation vessel of a pulp plant. The impregnation vessel is divided into four different zones and flows have been added for modelling purposes. ... 26 Figure 5 Digester of a pulp plant. The digester is divided into eight different zones and flows have been added for modelling purposes. ... 30 Figure 6 Mean temperature distribution of a pulp plant, model results shown in red and measurements in blue. The results are obtained from a model created in OpenModelica and the x-axis letters is short for the component, i.e. CB=chip bin, SV=steaming vessel, HPF=high-pressure feeder, IV=impregnation vessel and D=digester. ... 37 Figure 7 Chip bin outlet temperature deviation. The difference between the calculated and sampled outlet temperature as a percentage... 38 Figure 8 Digester component 5 outlet temperature deviation. The difference between the calculated and sampled outlet temperature as a percentage. ... 39 Figure 9 Digester component 5 outlet mass flow deviation. The difference between the calculated and sampled outlet mass flow as a percentage... 40 Figure 10 Digester component 7 outlet temperature deviation. The difference between the calculated and sampled outlet temperature as a percentage. ... 41 Figure 11 Digester component 8 outlet temperature deviation. The difference between the calculated and sampled outlet temperature as a percentage. ... 42
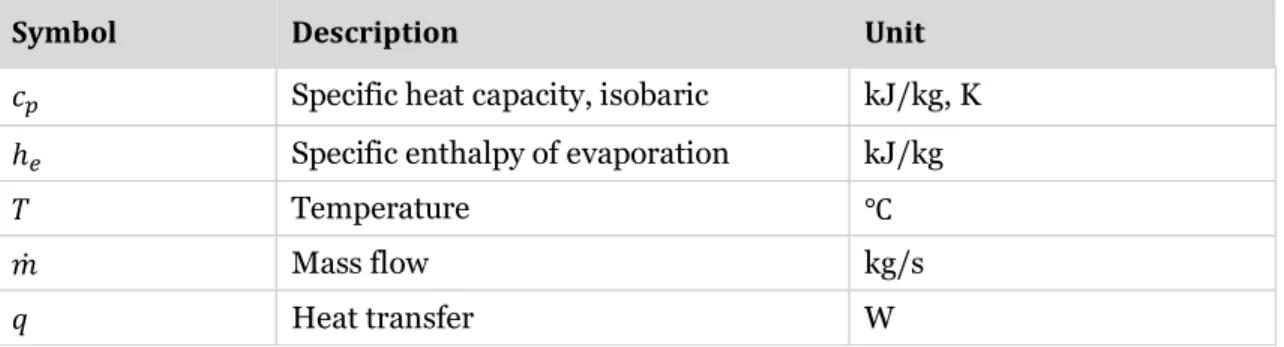
NOMENCLATURE
Symbol Description Unit
𝑐 Specific heat capacity, isobaric kJ/kg, K
ℎ Specific enthalpy of evaporation kJ/kg
𝑇 Temperature ℃
𝑚̇ Mass flow kg/s
ABBREVIATIONS
Abbreviation Description CB Chip bin D Digester HPF High-pressure feeder IV Impregnation vessel L LiquorMPC Model Predictive Controllers
OL Old liquor
PSE Process System Engineering
S Steam
SV Steaming vessel
1. INTRODUCTION
This thesis is an effort to devise a component-based system modelling approach built on heat and mass balance equations. Where there is a lack of adequate fundamental equations, complementary empirical relations are utilized. This thesis is centred on a case study of a pulp mill. In this section, a background of this study is presented and is followed by research questions and delimitations. The background describes the pulp industry. The pulp industry is inseparable from the paper industry and when the subject of the pulp industry is discussed, the paper industry is included. The concept of process system engineering (PSE), its’ relevancy and justification as an applied method in this thesis will also be covered. Additionally, the background contains a description of the case study and ends with a definition of the problem. The purpose follows the background and specifies the problem definition concluding the background. In subsequent section, the purpose is presented by organizing it in tangible and open questions in forms of hypotheses. The last sub-section, delimitation, states the constraints of this study.
Background
In this section, the authors argue about why the pulping industry is worthwhile examining for optimization possibilities, how pulp is made and its application. Additionally, a brief introduction on process system engineering (PSE), and why it is relevant to this thesis. Pulp is created in a pulp mill and is used to produce paper, cardboard and other similar products. More specifically, pulp is produced by refining wood chips in a series of processes, designed as to produce a bright and strong pulp. The main processes are cooking and bleaching, these are explained in further detail in the literature study alongside the recovery cycle.
The pulp making process starts with the acquisition of the raw material: forestry, i.e. growing, cutting down and trimming trees as raw material. The logs are debarked and cut down to smaller wood chips. Chips are injected in the pulping process that can be either a mechanical or a chemical pulping. Pulp is produced and prepared for the papermaking process. The product of the papermaking process can be divided into five overall categories depending on their end purpose, e.g. newsprint paper, printing and writing paper, sanitary paper, wrapping paper and finally paperboard. The pulp product has different uses and the quality and properties of the pulp is determined by its fibre tensile strength and brightness. Brightness is often measured in the residual lignin, which is a by-product of the pulp making process and is a suitable indicator for brightness. The properties required for the pulp varies by the finished product requirements.
According to the International Energy Agency (IEA), the industrial energy usage amounted to 36 % in year 2014 of the world’s total energy usage. In turn the pulp and paper industry uses
5,6 % of this, therefore the pulp and paper industry is accountable to 2 % of the global total energy usage (IEA, 2007). The increased use of Internet has a global impact on the demand for printing and writing paper and forecasts for the demands of such paper is continuously corrected downwards (Johnston, 2016). A correlation between Gross Domestic Product Per Capita and paper demand has been identified and conclusions are made that physical paper is replaced with digital alternatives (Chiba, Oka, & Kayo, 2017). According to IEA (2012) the overall reduction in demand for printing and writing paper have been compensated by an increase in sanitary and packaging paper demand due to an increase in population which suggests that the need for an efficient pulp and paper mill is still high. IEA also highlights the increase in variability of the feedstock due to an increased share of recycled material in the papermaking process (IEA, 2012). In other words, the use of printing and writing paper is decreasing with the increase in the wealth of a country, for example, the need of cartons for food products is still increasing due to the growing population. Future manufacturing costs of the pulp and paper industry is affected by energy costs, energy supply and climate change in conjunction with the increased global interest of biomass as an energy source (IEA, 2007).
1.1.1. Processes system engineering
PSE is a field of study that breaks the complexity of nature into manageable parts for study. The challenge of understanding and describing nature is approached. A model is a mathematical representation of a system and the system is a real-life phenomenon. The model imitates the system and can never fully simulate the system but a model that sufficiently imitates a system can be studied in order to learn more about the system. A model can replace, proceed or be used as foundation for physical experimentation. The following words are worthwhile to keep in mind while considering applying process modelling, from George E.Box:
“All models are wrong, some are useful” (Hangos & Cameron, 2001)
Modelling a pulp mill enables analysis of the system that the model represents. This analysis can lead to a deeper understanding of the system or parts of the system that in turn can lead to optimizations measures, which is one of the main purposes of process modelling. Pulp mills are historically controlled based on implicit methods i.e. from staff experience and for the most part still is. Also, challenges in modelling a pulping process is the inherent dynamics of the process and lack of system understanding. (Blanco et al., 2009)
The properties of the wood used in pulp production is difficult to predict and determine. The challenge lies in the variability of the material. Different species of wood and even wood of the same species has different properties affecting the process in various ways. This issue manifests while digesting the wood chips, occurring in the pulp mill digester. Not only is it difficult to convert wood chips to one type of pulp product with a specified brightness, there is a demand for other types of brightness’s as well. Therefore, there is a variability not only in the input material but also in the output product. (Mercangoz & Doyle, 2006)
1.1.2. Problem definition
The pulping industry is facing technical challenges in adjusting for a variable and unpredictable feedstock while producing a pulp product of variable property demand. Furthermore, disturbances to the feedstock availability and price, possible due to the increased attention of biomass, cause economic insecurity. The pulp and paper industry are seeing an increase in demand, a global increase in economical welfare is decreasing the demand for printing and writing paper while the increased population is increasing the demand for sanitary and packaging paper.
Purpose
The purpose of this thesis is to explore if an accurate model can be created based on easily understood assumptions. Moreover, see if the model error source can be identified, explained and how these errors can be corrected.
Research questions
How well can a model, built on heat and mass balance equations, mirror the target system? For this system, what factors are important for improving model accuracy?
Delimitation
While gathering information about previous models in the pulp and paper industry, only one string of keywords is used. The string is produced after an iterative process of trial and error where different configurations of the string is tried on different databases. When a satisfying number of articles have been found with the string of keywords the search of literature is concluded and the articles found is the only ones used in the literature study. The final search of articles is performed in one database only, decided after trial and error. No similar limits are set when searching for literature regarding system and component understanding, still there are only two books used as main source for that type of information.
The model is created in OpenModelica using the Modelica programming language. Matlab and Excel is used for data post- and pre-processing. The mass balance is developed using the process flow charts. When the final mass balance is determined, measurement is requested. Thereafter, the process flow charts are only used for small changes and flow error corrections. Visits to the actual plant are limited to one only and is done early in the process of this work for subject introductory purposes. Data gathering is therefore not performed by the authors on-site by measurements on the actual process but collected via the process flow charts in communication with plant managers.
The system is modelled and investigated under normal operating conditions. Determining the normal conditions are done by analysing measurement data. When flows are measured as negative or equal to zero the process is assumed to be operating outside normal operating condition, thus this period is excluded from the work. The differences in control strategies between the two wood types being processed is not considered in the model, therefore the scope is limited to only investigate one type of wood. This leads to that the simulated period is
22h in February 17-18th.
The model is built around analysing the energy and mass balances of the selected parts of the process. Pumps used for circulating flows or feeding screws used for pushing the woods chips forward is not included in the model and therefore not added to the energy balance calculations. The selected parts of the system modelled in this thesis is the chip bin, steaming vessel, high-pressure feeder, impregnation vessel and digester. The model does not include any other parts of the system such as bleaching and washing process, recovery cycle or the paper plant. The model is focused around the wood chips and the components that handle wood chips, not the surrounding parts of the system such as cisterns and heat exchangers. Therefore, the interconnections between the components, such as heat recovery between the digester and impregnation vessel, is not considered when analysing the balances of the process.
The dependency of time in the model is based on the measurement’s interval, i.e. data is sampled every 15 minutes and therefore the calculations are done for every quarter of an hour. No consideration of the time dependency of components, such as retention time, is included in the model. Therefore, the model gives an instantaneous image of the process every 15 minutes. It is possible to displace the measured data according to the residence time of the components and then follow a portion of the wood chips to analyse what changes in internal energy the wood chips are experiencing throughout the process.
The mass flow of wood chips is derived from a measurement of the volumetric flow rate of wood chips through the feeder between the chip bin and the steaming vessel, where the
volumetric flow is converted to a mass flow using an average density of 670 kg/m3. The average
density is based on dry wood and therefore moisture content of the wood chips is not considered in the model. The specific heat capacity of wood chips is assumed to be constant 1.85 kJ/kg.K. It is possible to account for the change of density of the wood chips after they have been dissolved and changes of specific heat capacity while the temperature changes, but this is not done in this model.
Physical properties of fluids are derived from discussions with the plant manager, by analysing the process flow charts, by empirical equations and assumptions. The flash steam that enters certain components is assumed to have a temperature of 100 °C and atmospheric pressure. The intermediate pressure steam is assumed to have a pressure of 4 bar and a temperature of 180 °C and similarly the high-pressure steam 12 bar and 220 °C. Liquor with unknown temperature that enters certain components is assumed to have a temperature of 95 °C. The liquor in the process is assumed to have similar physical properties as water, a constant specific
heat of 4.2 kJ/kg.K and an average density of 1000 kg/m3. No temperature dependency of
The flow of wood chips is always seen as separate from the liquor in the energy balances, i.e. no mixing and merging of wood chips and other fluids is present. When the wood chips is dissolved in the digester some part of the wood chips follows the reject and is taken out of the digester through screen packages in the model. However, this is not accounted for in the model regarding changes in physical properties of the liquor. The reject is still regarded as ordinary liquor even though there is wood particles in the flow.
Losses, for example heat transfer to surroundings, is not considered in the model and all energy transferred to a certain component is assumed to be transferred to the fluids and wood chips. The model is not taking physical properties connected to chemistry in consideration since the main goal is to analyse the energy usage and not the usage of chemicals. There is however, one exothermic chemical reaction, which is taken into account since it does affect the energy balances significantly, the heat released during the delignification process. The heat of reaction while the wood chips is dissolved during delignification is assumed to be constant -148 kcal (-619.6 kJ) per kg wood chips.
The model is built to mimic the process for one type of wood only, birch, due to the differences in the control of the system and the process strategy between them both. There are unavailable measurements necessary for a complete energy model for one type of wood, i.e. with the measurements available there occurs huge errors for one type of wood and not the other. While modelling and analysing the results it has become clear that a lot of information is missing and to build a model without that information is not practical.
2. METHOD
In this section, the means of which information was obtained is stated and how the data is relevant in relation to purpose and research questions. Foundational knowledge is needed for the system of interest hence literature study is performed with focuses on this. Furthermore, sample data is acquired for the process, by means of case study and literature study.
Foundation knowledge
To gather foundational knowledge a literature study is conducted. The gathering of information can be divided in two different approaches. First, focus lies within the identification of physical, thermodynamic and chemical processes of the system. Second, the effort goes forward by understanding the impact of the pulp industry on the world, the people living in it and the environment and vice versa.
One main activity regarding the literature review is to create a string of keywords to be used in the search for relevant articles in scientific journals. This activity is based on an iterative process where a final string, a set of keywords, was used to obtain a number of articles. By using the string “(pulp* OR kraft*) AND (Mathematical* OR Model*) AND ("Energy Consumption" OR "Energy Us?*" OR "energy savings" OR "energy utili*") AND (Process* OR Simulati*)” 336 hits where obtained when searching for scientific papers on the database Scopus. All the titles of the 336 articles was briefly reviewed and about one fifth of them were sorted out and saved. These saved articles were investigated and approximately 21 of them was finally used as references in this project. One thing that these 21 articles have in common is that they are presenting a model of some sort regarding the pulp industry. Some of the articles is focusing on controlling the system variables and minimizing the error from set values while others are focusing on optimizing the variables from an economic point of view. This is explained more thoroughly in the literature review. The articles have been divided into categories regarding what system or components that have been modelled to give an overview of what the articles are focusing on. This is presented in Figure 1.
Figure 1 Number of articles regarding different section of a pulp mill. The total amount of articles is 21 and the quantity of articles of each part of the system is presented in separate categories.
The category called “Others” consist of one article regarding the wastewater treatment plan and one that regards the papermaking plant. During the analysis of the articles their function, goal and conclusions from the models are studied and presented in the literature review. Apart from this analysis, an effort in the literature review is to assess presented data for validation of the model presented in this report.
Another categorization, for the 21 articles, is concerning their modelling nature and the purpose of the model. Figure 2 shows whether the article is of the subjects of optimization or controlling.
Figure 2 Number of articles with the topics of optimization or control. The total amount of articles is 21 and the articles subject is presented in separate categories.
12 1
1 4
1 2
Number of articles for respective part of the
plant
Plant wide Digester Bleach plant Evaporators Lime kiln Others
12 9
Number of articles
The main purpose of the reviewed models is showing that there is more focus on optimizing energy usage and the economy rather than controlling the processes. However, the two subjects are hard to separate when talking about model predictive control which is in the forefront of the research now.
Process data sampling
General knowledge about the system is gathered by reading literature and articles. Discussions with experts and researchers on the subject lead to further system understanding. When basic level of system understanding is achieved, the knowledge is anchored in a study visit to the case study plant. In-depth knowledge about the specific system and the components modelled is obtained by analysing process flow charts and discussing further with experts and focusing the literature study on the chosen scope of the process. The most crucial activity is the gathering of measured data and lays the foundation for the model and possibilities for validating the model.
Measured data is obtained by analysing the process flow charts where sensors measuring physical properties such as temperature and pressure are located. The sensors are presented as a hexagons shaped icon connected to pipes or components containing a name and number. After highlighting each flow with marking pens, a unique colour for each type of flow, a huge mass balance over the system is created. The sensors name and number relevant to the studied components are written in a spreadsheet and sent to one of the plant managers. The plant manager returns the available measured data for each sensor specified. Approximately half of the asked measurement points is unavailable, partly because of the age of the plant, i.e. renovations, and partly because of broken and removed sensors. This reduces the possibilities to create a more complex and detailed model and decreases the validation points. The measured data obtained extends over six months and samples the data every 15 minutes. Further analysis of the measured data shows that the mass balances first assumed must be corrected to represent reality. During the analysis of the measured data, it also becomes clear that the plant is not running continuously but for periods of time. Over the course of six months, some parts of the process are turned off due to errors. This reduces the possibilities of validating the model since the created model is handling normal operating conditions. Continuing the analysis of measured data, it becomes clear that the process is handling different types of wood in batches, i.e. every other day the wood type is changed from birch to pine.
The process of building the model and the assumptions made are specified in Modelling approach.
3. LITERATURE STUDY
This section will show the research relevant regarding the study of this thesis and contains the current research and development of the pulp mill and PSE. Further, this section will include previous works on the same type of system; these are used as result validation and verification. Additionally, this section describes the pulp mill and its component in the level of detail necessary to develop the energy model and to understand the systems fundamental procedures. The fundamental equations are identified or derived from the literature and then displayed along with other system or components design parameters.
This section is structured in the following way: Detail the process generally, progressing to explain the systems of the process to identify and extract the components of the sub-system. The general components are explained separately, this includes their energy balance, mass balance, other components specific equations and other relevant modelling information.
System
The pulping method of interest is called chemical pulping, apart from this there is mechanical and hybrid techniques such as thermomechanical pulping. A common method for removing non-cellulose components from the wood chips is the chemical process called sulphate (Kraft) process, where sulphate is denoted as chemical sodium sulphate. The Kraft pulping process, which is one of two main lines, starts in the digester where the wood chips are cooked with the active cooking chemicals sodium hydroxide (NaOH) and sodium sulphide (Na 2 S), also known as white liquor, with the addition of heat. When the wood chips are cooked in the digester and the product is already called pulp. The upcoming steps refines the pulp further, for example, screening, defibering and deknottning that is separating unwanted larger particles from the pulp. The washing cycle then takes over with the purpose of separating spent cooking liquor from the pulp. The pulp and cooking chemicals before the washing steps is called brown stock. The objective of the washing cycle is to minimize the amount of cooking liquor entering the next stage i.e. the bleaching process. The more cooking chemicals that gets through the pulp washer the more bleach chemicals is spent in the bleaching plant. The bleach plants objective is to increase the brightness of the pulp to a predetermined level. The brightness can be measured with certain instruments and the Kappa number, which is an indication of the brightness, can be determined by measuring the residual lignin content of the pulp. Chlorine, chlorine dioxide, sodium hypochlorite, oxygen, ozone, hydrogen peroxide and peracetic acid are among others common bleaching chemicals used along with water. When the desired brightness is reached, the pulp is sent to the papermaking process. Approximately 50 % of the wood chips are processed into pulp. The other half is removed and recycled as energy for the process, the cooking chemicals is also recycled and reused, this is the second main line of the process. The organic lignin is removed and treated in a way so that it is eventually burned in a recovery boiler, which supplies steam or heat necessary for the process. The pulping process converts more energy from the incoming material than needed for the process itself. The surplus energy can be utilized in a steam turbine or for heating of other processes, a district heating network for example. Before the organic residuals from the pulping process is burned
in a recovery boiler the cooking chemicals is recovered in a chemical recovery cycle. The pulp sent to the papermaking process undergoes some process steps called stock preparation before it is sent to the papermaking machines. Examples of the stock preparation steps is the blending of different pulps and the addition of chemicals (Bajpai, 2012).
From a PSE perspective, it is possible, but not necessarily simple, to control the pulping process. Model Predictive Controllers (MPC) is an area which have been investigated for a couple of decades in the pulp and paper industry and since it is necessary to have a model in the background of controller it is a relevant subject to study for this work. This is also an effort to highlight the need of models in the pulp and paper industry and to show the current situation and the research front of this area.
Castro et al. (2002) is investigating the possibilities of new controlling strategies for the pulp mill industry and mention that MPC is not a new technique. But the application in this sector is novel. Traditional single-input single-output is compared with more advanced control strategies, the conclusions from their work is that there are differences between control strategies. For example, an MPC controller of only the digester and traditional controlling of the rest of the plant compared to MPC controller of the whole plant showed little difference. Over the bleach plant it showed that the traditional controlling strategies exhibited tighter controlling results than with the MPC. The recommendation is to control the digester with an MPC and the rest of the process traditionally. Further research concluded from this work is that this area needs to be addressed further. They did continue their research and their conclusions is detailed further (Jorge J Castro & Doyle, 2002). To address the area of research further and to open up the research community to a common denominator Castro et al. (2004b) presented a benchmark problem including a model for plant-wide control design. The model is of “medium complexity” which for example means that there are both perfectly mixed and plug flow vessels and regarding the control it is mostly done with linear functions since nonlinear controlling would require a lot of computational power. Partial differential equations in the model was solved with the method of lines to reduce the complexity. Empirical equations for physical properties or thermodynamic information was used in combination with mass and energy balances. Set points used for the control system is created such that the process variables are maintained at their desired levels. Further, the process is kept within their respective constraints, the variability in quality and production rate are kept as low as possible. Furthermore the usage of wood chips, utilities and chemicals is minimized, disturbances is rejected as quickly as possible while maintaining the process variables within their constraints and finally minimize the transition time between modes such as changes in production rate (J J Castro & Doyle III, 2004b). These controlling set points are fundamental to many processes, they do to some extent agree with the goals of the studied plant. When the benchmark model has been released Castro et al. (2004a) also applied a plant wide control design, first specifying the process objectives and constraints and anchor the final objective, clearly described with the following citing:
"There is only one goal in every company and that is to make money.” (J J Castro & Doyle III, 2004a)
Conclusions from the article is that it is possible to control the pulp mill with traditional decentralized control but also with a combination of decentralized unit-based MPC, this once again highlights the importance of accurate models in the background of controllers. Conclusions are mainly focusing on minimizing the error from the set points, the main focus is not on reducing energy or chemical usage (J J Castro & Doyle III, 2004a). The non-focus on energy usage is a theme of previous and upcoming articles. The focus on the so far presented articles is on reducing errors and to quickly reach the desired values, it could be that this is not optimal from an energy or chemical usage point of view, this is investigated further. Continuing on the benchmark problem some further analysis of the MPC are performed, once again not focusing on the economic perspective but rather minimizes the error (Luppi, García, & Basualdo, 2010). Mercangöz et al. (2008) focused more on the economy in a follow up study on a benchmark problem by applying real-time optimization. It resulted in significant reduction of the operating costs and the methodology can be used plant-wide for real existing pulp mills (Mercangöz & Doyle III, 2008). In this article there is a clear focus on economy where energy and chemical usage plays a vital part. Process control variables and their relationship to economic variables is of course important when optimizing in real-time, the degree of freedom of control variables for economic optimization is considered and implemented in the model with considerable results. Regarding economic- and energy optimization, this is a way forward.
Mercangöz et al. (2006) also presents the challenges and the way forward for MPC in the pulp and paper industry, which is included in one of the branches presented by IEA, i.e. energy efficiency (IEA, 2012). They highlight that possibilities to change target values during operation and vary it with both the incoming inherent variabilities in the feedstock but also with the changing set-points of the wanted outcome is a way forward for future research. To both minimize the controlling errors but also to optimize the economy is topics of interest. Another area of future research will be non-linear fundamental model predictive controllers and mill-wide optimizations of the pulp and paper industry along with a more graphical interface with mill operators as the target group (Mercangoz & Doyle, 2006). Conclusions from this report also agrees with the recent article of MPC for digesters (Rahman, Avelin, Kyprianidis, & Dahlquist, 2017).
Once again supporting the purpose of this study Blanco et al. (2009) explains the current situation of the usage of models in the pulp and paper industry. They conclude that staff experience is the main base for controlling and it is highlighted that including models in the industry for process predictions would add value (Blanco et al., 2009).
A study performed by Ding et al. (2012) is analysing what kind of influence wood chip variations have on energy usage and concludes that up to 30 % of the disturbances in a thermo mechanical pulping plant depends on these variations. Regarding energy savings they conclude that by monitoring the chip density a total energy saving of 2 % can be achieved. Controlling and reducing the variation of chip density did not only the specific energy usage reduce but the pulp quality was also enhanced. The enhancement in quality makes it possible to redefine the refining set points and minimize the energy consumption further while maintaining the pulp quality (Ding et al., 2012).
The single largest expense for the studied pulp mill is the fuel costs. Fleiter et al. (2012) presents the assessment of 17 process technologies with a techno economic approach for energy saving potentials. The majority of the investigated solutions shows an economic advantage from a shareholder’s point of view. The energy saving potential shows to be about 21% and 16% of fuel and electricity demand respectively. The results 21 % and 16 % are relative to the frozen efficiency scenario. Therefore, the savings are a lower if compared with the business as usual scenario. Results shows that fuel and electricity demand can be reduced by 15% and 13% respectively in the business as usual case (Fleiter et al., 2012). This highlights the potential of energy and economic savings in the paper and pulp industry. Additionally, this strengthens what IEA states about process integration being a future area of research alongside the energy efficiency branch.
A case study on an Iranian pulp and paper mill, a chemical thermal mechanical pulp plant, is performed by Fani et al. (2009). Investigation on the current state of the plant is performed by creating a model and analysing said model. The model of the recovery system is assuming steady state conditions, ideal gas mixtures of air and flue gases, complete combustion in the recovery boiler and no heat losses present in any component except the recovery boiler. Specific heat for liquor containing fibers are calculated with an empirical equation presented by Green (Green & Perry, 1973). With the model they apply an optimization algorithm to identify energy waste and suggest improvement, concluding that the current state of the plant uses 23% more energy than the gross root design. By retrofitting the current design, savings of up to 15 % can be achieved (M Fani et al., 2009). Identifying energy wastes is a topic that is included in this work as well and is important from an energy efficiency perspective. Again highlighting the importance of PSE, further investigation of the optimization algorithm is performed on the same plant by Fani et al. (2010). Two different optimization algorithms is tested and compared and the results is, as expected, different (Maryam Fani et al., 2010). This shows that not only is all models imperfect (Hangos & Cameron, 2001), but the results from optimization algorithms depend on the structure of the algorithms themselves.
A model of a part of a pulp mill is created in the software CadSim plus and validated with operation conditions by García et al. (2009). These simulations lay as a foundation for further investigation of the system by using another software, Aspen HX-Net 2006, and two scenarios where investigated. First a change to the heat exchanger network is explored and the results are a decrease of the total costs of 14 % but with an increase in water consumption. The second scenario explored is by rearranging the streams and the flow ratios which resulted a lowered annual cost. Apart from these results the authors further conclude with this study that a combination of simulations tools can be used to achieve optimization results (García et al., 2009). By combining different tools, it is also possible to achieve optimal results.
The models investigated shows that there are a vast number of models available for pulp mills. Further, it shows that models are a powerful way of optimizing and analysing processes but also tell that modelling is not a straightforward, one size fits all, matter. A more in-depth analysis of models over certain parts of the pulp mills are presented from here on.
Digester
Optimally and theoretically the objective of the impregnation of cooking chemicals in the wood chips is to obtain a uniform impregnation of the chemicals such that every fibre that is being pulped is receiving the same amount of chemicals, is exposed to the same temperature and for an equal amount of time. The most important process for achieving an even distribution of cooking chemicals is called the impregnation process where the chemicals is penetrating the porous structure of the wood. The success of the penetration depends partly on the wood chips properties, such as wood species, chip dimensions, moisture content, air content and the capillary structure as well as the liquid properties such as pH and chemical concentration, surface tension, viscosity, temperature, and pressure. The porous and non-uniform wood chips used in industrial processes such as Kraft pulping can be pre-treated with steam to remove some of the air that later will hinder the impregnation process. Some parts of the wood is harder to impregnate than others, for example the more dense knots (Sixta, 2006).
A model to calculate the degree of penetration is presented by Sixta et al. (2006) which depends on temperature, dry solids content, and dry density, moisture content and the properties of water. The degree of penetration can be increased by pre-steaming the wood chips. Interesting to note is that moisture content of different types of wood can vary between 30-200%. A detailed model for calculating how the liquor penetrates the chips radially and axially is also presented (Sixta, 2006).
After the pre-steaming and the impregnation, the cooking process takes place, i.e. digesting of the wood chips. If correct semantics would be used, the cooking process might be defined to start with the pre-steaming due to the increase of temperature. The digester used in the studied plant is a Kamyr digester. A Kamyr digester is of the continuous type, meaning that it is continuously feed wood chips on the top and outputs pulp on the bottom. The digester works under constant pressure. A high-pressure feeder transports the chips with cooking liquor to the digester. Effectively mixing the chips with cooking liquor and consequently impregnating the chips. The chips is impregnated with the residual liquor for around 45 minutes at a temperature of 130 °C. The pulping is aborted by subjecting the chips, now converted into pulp, with cold wash liquor. The pulp, after being partially washed is ejected from the digester (Biermann, 1996).
Even though this component is included in most models previously presented there are some efforts and research considering the digester only. Rahman et al. (2017) investigates the challenges and the way forward for model predictive control of the blow line kappa number and concludes that by soft sensing the lignin content of the incoming wood chips reductions in chemical consumption can be achieved downstream in the process. From this study the current situation of mathematical models of pulp digesters are mapped and also concludes that time delays between measuring the Kappa number at the blow line and actual controlling possibilities are tangible. The way forward presented in this article is to soft sense the lignin content by using a model and then control the system with MPC to be able to control the process in from an optimum chemical- and energy- usage perspective, a model that maps the usages have to be present in the background of the controller (Rahman et al., 2017). Connecting this kind of MPC to the model created in this work is a possible future application.
Washing
The eject from the digester and the blow tank is a mixture of pulp and residual cooking chemicals and lignin. The chemical waste is separated from the pulp to prepare the pulp for bleaching. Further, the chemical waste is sent to a recovery process where most of the chemicals is recycled and the organic lignin is burnt in a boiler producing steam. Removing lignin in the washing process decreases the chemical consumption in the bleach plant. The washer is either drum or counter flow type. The input flow is put through 3 or 4 washers removing up to 96 % of the chemicals (Biermann, 1996).
The principle behind washing, as described by Sixta et al. (2006), is the separation of undesirable components from the product and in the case of pulp cleaning, spent liquor or chemical agents is often simply replaced with clean water. Besides cleaning the pulp, the advantage derived from cleaning are, to name a few: recovery of cooking and bleaching chemicals; and extracting residual fibres, processed unsatisfactory in previous processes (Sixta, 2006). The washer component shows up on several locations in the pulping process and in order of appearance: end of the digester, brown stock washing, end of all bleach stage and the dewatering component. Interpreting the washing process from a mechanistic perspective is difficult due to the complexity of the related equations (Sixta, 2006). Hence, the washing component is model based on empirical relations. The washing component generally works after the following steps: dewatering, washing and thickening. A thick sheet of pulp enters the washer on top of a perforated filter, allowing liquids to pass through the sheet of pulp and the filter while keeping the pulp sheet on top of the filter. A pressure difference is applied over as to transport washing liquid over the pulp sheet and filter (Sixta, 2006).
Bleach process
Delignification is the process of releasing or dissolving the binding lignin in structures such as wood. As described earlier the lignin is unwanted in the papermaking process and chemicals is used to reduce the amount of the binding lignin. Environmental restrictions and to reduce the amount of chlorine used in subsequent steps of the bleaching process have made oxygen delignification an important step in the pulp making process. Introducing oxygen in the bleaching process also gives a higher yield compared to the final part of the cooking stage but there are some disadvantages, it can damage the cellulose in form of lowered viscosity and losses in pulp strength if not used correctly. Oxygen delignification has both economic and environmental positive effects due to the reduced usage of traditional chlorine-based chemicals (Sixta, 2006).
The oxygen delignification is hereby denoted as a part of the bleaching process and consists of three stages in the studied plant. Two-stage oxygen delignification process were common about a decade ago, and before that single-stage, oxygen delignification was dominating. A typical delignification level could be increased from 50% with single stage to approximately 65% with two stages for softwood with unbleached kappa number 25-30. A database has been evaluated
22. Typical operating temperatures is ranging from 90-120°C and should not be lower than 80°C, a sufficient amount of water have to be present, e.g. the consistency should not be too high, to absorb the extra heat from the reactions. The heat of reaction is reported to be in the range of 12-14 MJ/(ton pulp and removed kappa number). In the oxygen delignification there are gaseous products produced such as carbon monoxide and hydrocarbons, which must be removed from the system. This is done with the utilization of reactor tank itself, the blow tank and the washers (Sixta, 2006).
Oxygen delignification is a exothermic highly complex heterogeneous three-phase reaction including a lot of different kinds of reactions and is varying with wood species, type of cooking process and specific cooking conditions where the efficiency of the delignification is depending on variables such as temperature, consistency, pressure, charge of oxygen and pH. An extensive model to predict industrial oxygen delignification called the van Heningen model is presented in the literature (Sixta, 2006).
Cooking and washing the wood chips only remove a certain amount of lignin. To further remove lignin from the unbleached pulp, apart from oxygen delignification, chlorine dioxide can be used. The bleaching agent chlorine dioxide is removing lignin from the pulp with oxidative degradation of the lignin (Sixta, 2006).
There is a wide variety of bleach plant configurations; the one used in the studied plant has a 4-stage DEDD configuration. This means that it starts with a D-stage, then a E-stage and ends with two D-stages in a row. The D-stage bleaches the pulp with chlorine dioxide. The E-stage removes degraded lignin with sodium hydroxide. Each stage contains a washer that removes chemical waste before exposing the pulp to new chemicals, a mixer that blends the pulp together with chemicals and a retention tower that allows the pulp and chemical mixture time to react. The pulp is considered a finished product after the bleach plant and is transported to storage or the papermaking process (Biermann, 1996).
The first stage of the chlorine dioxide bleaching steps is commonly known as the 𝐷 stage and can be configured after either the cooking stage or the oxygen delignification stage. After that, an alkaline extraction step usually follows called the 𝐸 stage. Between the 𝐷 and 𝐸 stage the pulp is usually washed. The extraction stage is enhanced with either oxygen (EO) hydrogen peroxide (EP) or both (EOP). The first chlorine dioxide step could be called a delignification step while the two latter can be called bleaching stages. After the 𝐸 stage there are in some cases, like the case of the studied plant, two more chlorine dioxide bleaching stages called 𝐷 and 𝐷 respectively. The reason for the subsequent dual stage is that it is more efficient split the charge of bleaching agent in two steps. From an efficiency point of view it is also preferred to have alkaline extraction between the stages, as in the case of the studied plant (Sixta, 2006). Drawbacks of chlorine dioxide bleaching is the formation of chlorate and residual chlorate which leads to a loss in oxidation power and increases the bleaching costs. Further, it has been shown that chlorate has a negative effect on brown algae and to reduce the formation of chlorate has been the topic of interest in many studies. The efficiency of chlorine bleaching varies with the pH-value and is low at high pH. Bleaching at lower pH-levels gives a better, i.e. lower, kappa number at the end of the bleaching, the lower the pH-value the better reactivity of the chlorite ions for reacting with the lignin. A pH-value below 3.4 makes little to no
difference in the reactions, the oxidative reactions are hindered at pH lower than 3.4 (Sixta, 2006).
The bleach plant of a pulp mill is investigated by Keski-Säntti et al. (Keski-Säntti, Leiviskä, & Lampela, 1999) which concludes that in load sharing it seems that it is most profitable to start bleaching with high load. Evaluating intelligent methods in pulp bleaching is the main objective of the work. Investigated methods are fuzzy systems, neural nets, genetic algorithms and their combinations since there are a lot of data available and there is a difficulty to explain the process using physical models (Keski-Säntti et al., 1999). This study presents a lot of measurements which can be used for validation of the model produced in this work. Results regarding load sharing is an area that also can be used in this work.
Recovery cycle
Regarding unit based controlling and optimization there is a case study performed by Ji et al. (Ji, Lundgren, Wang, Dahl, & Grip, 2012) using linear programming to decide optimum operating conditions for the evaporator plant in a pulp mill in northern Sweden. The empirical linear equations used in the optimization algorithm is derived from measurement data (Ji et al., 2012). Analysing measurement data and creating empirical equations is a topic of interest even for this work where created relations can be compared and used for validation.
Cardoso et al. (Cardoso, de Oliveira, Costa, & Passos, 2009) have analysed the behaviour of the heat transfer coefficient by monitoring the oscillations and determine time for washing the heat exchanging surfaces. Models are created for both the recovery boiler and the evaporation plant. The simulated values for steam production and steam consumption in the boiler and evaporators respectively shown a relative average error of 2.4 % and 1.7 %. The simulated heat transfer coefficient for one of the evaporation bodies shows a trend of decreasing over the 8h operation cycle, then it is washed for 4h and once again an 8h operation cycle takes place. The authors highlights that there is some criterion for deciding when the heat exchange is inefficient enough to wash the surface and work is in progress for deciding that monitoring criterion statistically. It is also concluded that burning black liquor with a solids content over 80 % if favourable from an energy efficiency point of view but from a technical perspective there are some limitations making it hard to handle the high viscosity of the high solids content black liquor (Cardoso et al., 2009). Regarding the energy efficiency branch, these authors pin point some interesting measures and areas of particular concern.
Verma et al. (2016) gathered measurement data and created models for latent heat, enthalpy and condensate heat for evaporations plants. They also provide energy balances for different kinds of configurations of the flows over the evaporators, a total of 15 different configurations and their energy balances are presented. The goal of the study was to provide models for analysing economy and consumption in order to optimize these in the recovery systems of pulp mills (Verma et al., 2016). This study about evaporators along with other presented studies indicates that there are plenty of research focused on the recovery cycle, specifically the
to one of the already existing models of the evaporators. The mentioned models are then used by Verma et al. (2017) with an optimization algorithm to a set of configurations to get the optimum operating conditions. The optimization method used here is the Interior-Point method (Verma, Mohammed, et al., 2017). Verma et al. (2017) also optimized the same model with another optimization algorithm called the genetic Algorithm (Verma, Manik, et al., 2017). Not only is it possible to connect the model of the evaporators to the model created here but also connect it to different types of optimization algorithms is also an alternative.
There are an extensive model for the limekiln regarding mass and energy balances, created on the platform WinGems. The model and balances is neatly explained in a master thesis (Lundqvist, 2009).
The purpose of presenting the current models available is partly to describe the current research front of PSE in the pulp and paper industry, partly to inspire the current study with methodologies adopted in the articles and cross-border modelling approaches and also to validate and evaluate the model created, all anchoring the purpose.
Miscellaneous
Another large part of the pulp and paper industry is wastewater treatment; since the process of pulping is using water wastewater treatment plants can be present as a part of the plant. Modelling of a waste water treatment plant and integrating biogas production with aerobic, anaerobic, and hybrid treatment systems is performed by Ashrafi et al. (2013), once again process integration is the topic. GHG emission reduction can be achieved both directly and indirectly, i.e. within the plant site system boundaries and outside. By investigating energy balances they also concluded that the main user of heat was the digester, much heat is used to heat the incoming flow to it (Ashrafi et al., 2013).
Lindel et al. (2006) have in a case study similarly to this work created a modular based modelling tool for analysis of the energy use and cost. The focus lies within the paper mill highlighting that changes in the paper drying section affects the mill-wide energy system (Lindell & Stenström, 2006).
4. MODELLING APPROACH
In this section, the construction of each component model is described with the following structure. A general process explanation that highlights physical parameters relevant to the model. Following, a case study detailing the actual process. Then, model assumption specifying the set-up of the energy and mass balance equations. Conclusively, an explanation on how the component model is solved and what model outputs is relevant to the study. The basic steps of a continuous cooking process are chip steaming, chip feeding, impregnation, cooking, washing and pulp discharge. This is all included in Figure 3, Figure 4 and Figure 5 and generally explained in the upcoming chapters.
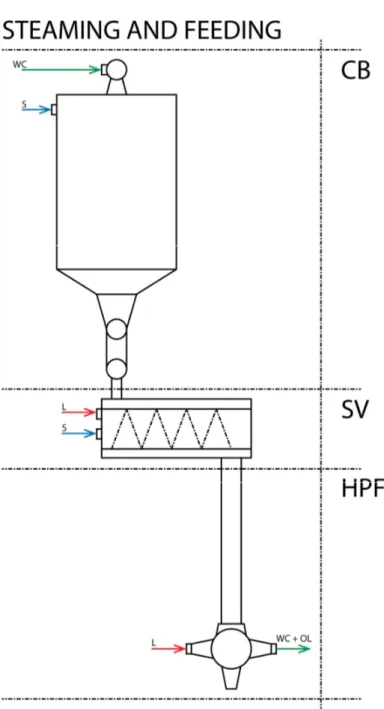
Chip steaming and feeding system
The chip steaming and feeding system is divided into three components; chip bin, steaming vessel and high-pressure feeder, as shown in Figure 3.
Figure 3 Chip steaming and feeding system including certain flows and separation of the component into three parts; chip bin, steaming vessel and high-pressure feeder.
4.1.1. Chip bin
The chip bin marks the start of the continuous cooking process where the debarked and mechanically disintegrated wood is fed to the chip bin through an airlock, which is a rotary star or screw feeding device. The objective of the chip bin is to remove as much air trapped inside the wood chips as possible for enhancing the cooking process. When the wood chips are exposed to steam the moisture inside will be heated up and expand, thus removing the air. If the air is not removed, it can hinder the chip column movement in the digester, pumps can be exposed to cavitation and it can lead to a poor impregnation of chemicals. The traditional way
of steaming is to steam the wood chips in a chip bin first, near atmospheric conditions and then continue steaming in a steaming vessel with a higher pressure. It has been found that the steaming under elevated pressure can be skipped if the duration of steaming under atmospheric conditions is long enough. Atmospheric steaming usually lasts for 15-25 minutes and the steam enters the chip bin near the bottom. Flash steam is traditionally the main source of steam used in the chip bin. At the bottom of the chip bin, there is once again a rotary star or screw feeder, called the chip meter, which sets the production rate for the digester, i.e. the pulp production rate is set by the chip meter in the chip bin. The steaming vessel is pressurized, typically 1.5 bar(g), which is why there is a low pressure feeder separating the atmospheric pressure in the chip bin from the elevated pressure in the steaming vessel (Sixta, 2006).
4.1.1.1. Case study
The studied chip bin has two steam inlets of different steam quality, flash steam and intermediate-pressure steam. Flash steam is assumed to have a pressure close to atmospheric and a temperature just above 100 °C. The intermediate pressure steam is assumed to have a pressure of 4 bar and a temperature of 180 °C and is expanded to atmospheric pressure prior to chip bin injection. One difference from the typical chip bin is that this chip bin has both flash and 4 bar steam entering. The amount of flash steam entering the chip bin is twice as much as the 4 bar steam in tonnes per hour. Other flows affecting the chip bin is neglected. Such flows can be wood particles from screening later in the process and twigs that are reinserted in the chip bin. On the top of the chip bin, there are some steam and wood particles being extracted which is later screened and scrubbed and sent back into the chip bin, this flow is also ignored in the model. The steam condensates while heating up the wood chips and a mixture of chips, water, reject and twigs is sent to the next component, called steaming vessel, by the low-pressure feeder.
The feeding screw on the top of the chip bin and the low-pressure feeder on the bottom is using electrical energy for transporting the mass. The steam inserted into the chip bin have a higher temperature than the wood chips that it is mixed with which means that the steam condensates and is absorbed by the wood chips, steam that not condensates is taken out of the top. A mixture leaves the chip bin with a temperature close to the condensation temperature of water at atmospheric conditions. The low-pressure feeder increases the pressure from atmospheric to approximately 2.5 bar.
4.1.1.2. Model assumptions
All flows entering the chip bin is passed to the next component called the steaming vessel. There may be a loss of steam which is sent to the scrubber connected to the top of the chip bin but is not considered in this model. The twigs re-entering the chip bin is included in the total wood chip flow.
The flow of wood chips is derived from measurement of the volumetric mixed flow out of the chip bin assuming an average density of 670 kg/m3 for hardwood (birch).