V¨
aster˚
as, Sweden
Thesis for the Degree of Bachelor in Computer Science - 15.0 credits
ON DISTRIBUTING A
VISIBILITY-BASED EMERGENCY
STOP SYSTEM FOR SMART
INDUSTRIES
Karin Nygren
knn18004@student.mdh.se
Examiner: Moris Behnam
M¨
alardalen University, V¨
aster˚
as, Sweden
Supervisor: Jan Carlson
M¨
alardalen University, V¨
aster˚
as, Sweden
Supervisor: Gabriele Capannini
M¨
alardalen University, V¨
aster˚
as, Sweden
Abstract
Emergency stop systems are extremely important in industries where machines and human oper-ators share the work space. The environment is in need of emergency stop buttons that can shut down machines when dangerous situations occur. Traditionally, stop buttons are located on or near stationary machines and are made to stop a fixed set of machines. In smart industries, with moving vehicles and where working operators have access to moving stop buttons, it is harder to know what to stop. Instead, visibility-based emergency stops can be used to only stop the machines that are visible from the button’s location. A server computes the visibility and sends stop signals to those machines that are visible when the button is pressed. However, the workload can be quite heavy for the server due to high numbers of machines and buttons. In this thesis I will explore how to distribute a visibility-based emergency stop system over multiple service instances with the purpose of providing an abstract distributed model. A distributed system would mean that the vis-ibility computations are divided among the servers and thus provide faster response time when an emergency occurs, which in turn is a more reliable system. To answer my research questions, a literature study and an analysis of the visibility algorithm were made in order to propose an ab-stract distributed model. The model was implemented with the key element that the stop buttons are partitioned among the servers. Experimental results show that the system with multiple servers performs faster visibility calculations, in terms of response time, than a system running with one server. The results obtained in this thesis are beneficial for other safety-critical system as well as systems processing large data sets.
Table of Contents
1. Introduction 1 1.1. Problem Formulation . . . 1 1.1.1 Research questions . . . 2 1.1.2 Limitations . . . 2 2. Background 3 2.1. Emergency Stop Systems . . . 32.2. Visibility . . . 3
2.2.1 Visibility as an algorithm . . . 3
3. Related Work 5 4. Method 6 4.1. Literature study . . . 6
4.2. Qualitative analysis of visibility algorithm . . . 6
4.3. Abstract distributed model . . . 6
4.4. Implementation . . . 7
4.5. Experiments . . . 7
5. Ethical and Societal Considerations 8 6. Distributed visibility-based emergency stop system 9 6.1. Analysis of the visibility algorithm . . . 9
6.2. An abstract distributed model . . . 9
6.3. Implementation . . . 11
6.3.1 Eager version . . . 11
6.3.2 Partitioning of emergency stop buttons . . . 11
7. Experiments 13 7.1. Experimental Results . . . 14
7.1.1 Case 1 - One Server . . . 14
7.1.2 Case 2 - Two Servers . . . 14
7.1.3 Case 3 - Five Servers . . . 15
7.1.4 Case 4 - Ten servers . . . 15
7.1.5 Comparison . . . 15
8. Discussion 18 9. Conclusions 19 9.1. Future Work . . . 19
List of Figures
1 A simple model of the visibility algorithm [1]. . . 4
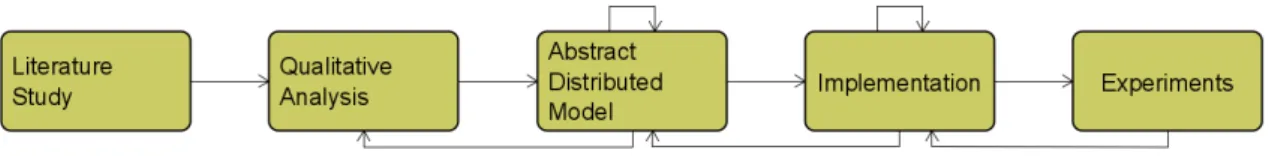
2 The steps performed using the constructive research method. . . 6
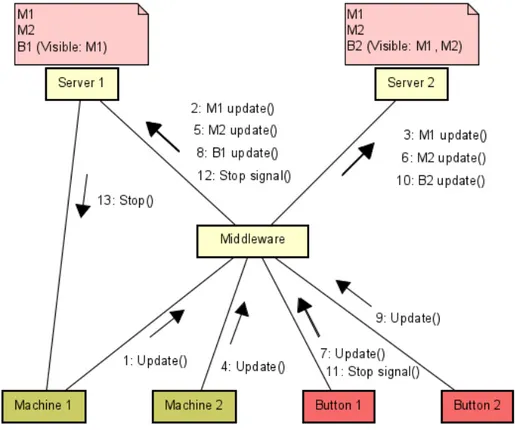
3 An abstract distributed model showing the system components and the communi-cation between components. . . 10
4 Example of registration and allocation of stop buttons. . . 12
5 Docker commands for building and running the system. . . 13
6 Docker command for fetching the result file. . . 14
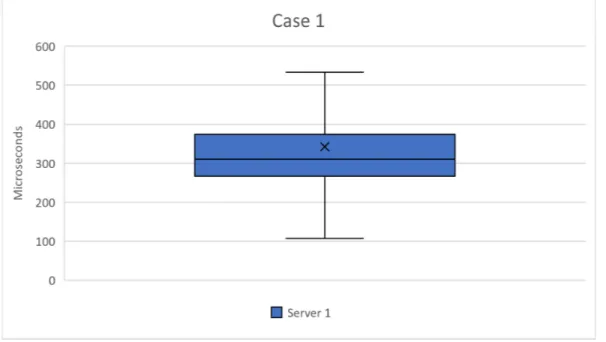
7 Diagram showing the results of Case 1 with one server. . . 14
8 Diagram showing the results of Case 2 with two servers. . . 15
9 Diagram showing the results of Case 3 with five servers. . . 16
10 Diagram showing the results of Case 4 with ten servers. . . 17
1.
Introduction
In traditional industries, where operators and working machines collaborate in a shared space, dangerous situations can occur. Such an environment comes with certain safety concerns including collision avoidance and other hazards that could be fatal. When a dangerous situation occurs, operators can stop machines by pressing an emergency stop button.
Traditionally, emergency stop buttons are located on or near stationary machines and the outcome of pressing a stop button is that a fixed set of machines are shut down. Nowadays, we have not only stationary machines and robots with moving parts, we also have completely moving machines that interact with human operators on a daily basis. Moving machines with associated stop buttons make it harder to statically decide which machines belong to what stop button and that is an issue in the traditional setup. In addition, stopping all machines in a factory is unnecessary and too costly. Instead, using visibility to determine which machines to stop would solve this problem.
Visibility is widely used in computer graphics but also in different areas such as architecture and robotics [2]. The determination of visible objects is done from a specific viewpoint and often solved using the z-buffer or ray casting. In an industrial environment with static and moving machines, a visibility approach in terms of emergency stops means that all machines that are visible from the position of the pressed stop button should be shut down. Capannini et al. [1] implemented a visibility algorithm for emergency stop systems that included walls, moving or static machines, and other obstacles. Within the algorithm, objects could be transparent and/or stoppable to indicate an obstacle or stoppable machine, as well as if machines were so called see through. Their system is built up by clients (machines and stop buttons) that send periodically their updates, and a server (service instance) that computes the visibility calculations and sends stop signals.
In my thesis, I will examine how the visibility-based emergency stop system can be distributed over multiple service instances, and in relation, find out how the different components of the system can communicate and share data efficiently. The goal is to propose a distributed solution of the overall emergency stop functionality that is more scalable, safe and reliable. Without a distributed system, the workload for a single service instance can be quite heavy due to high numbers of machines and stop buttons. In addition, an overloaded server increases response time when an emergency occurs which in turn decreases reliability.
Previous research showed that data distribution among parallel processors improved perfor-mance and the computation time was decreased proportionally to the increased numbers of pro-cessors [3]. It also showed that a balanced system in terms of workload is important to minimize idleness, and the easier approach to maintain this is a dynamic approach, i.e., the partitioning between the processors are made during system run-time [4].
The method I have used is constructive research. The main contribution of the thesis is an abstract distributed model that shows the distribution among the service instances and component communication. The model is implemented and validated using experimental tests. The main result is, of course, the abstract distributed model of the proposed solution. Furthermore, the experimental results show a clear improvement in terms of response time. However, the tests are not conducted in a real industrial environment with actual machine and location data, and this needs to be taken into consideration when analyzing the results. Still, the proposed model and the idea of such a system are beneficial for all industrial emergency stop systems.
The thesis starts with the problem formulation below, followed by background, related work and a more detailed explanation of the method. Next is the distribution of the emergency stop system including analysis of the visibility algorithm, an abstract distributed model and the im-plementation. Lastly, I present experiments and experimental results, discussion, conclusion and some thoughts on future work.
1.1.
Problem Formulation
In an emergency stop system where the visibility computation is handled by a single service in-stance, the workload for that service can be quite heavy. Most industries have hundreds, if not thousands, of stop buttons and objects for which the visibility algorithm is invoked each time an object moves. The number of calculations is related to the number of stop buttons n since the
computation is done for each button, but the number of other objects in the factory is also affecting the computation time.
Such a system does not scale well when the number of machines and emergency stop buttons increases, since it is too much work for a single service instance. Moreover, there is no backup for computing the visibility algorithm if the service stops working. A system consisting of only one service instance that handles the visibility computation is therefore simply not enough. Instead, if the emergency stop system would be divided among several service instances, each of them handling a part of the visibility computation, the system would be more scalable when more buttons and machines are added. It would also provide faster response time when an emergency occurs, which in turn is a more reliable system.
The purpose of this thesis is to provide a distributed system of the overall emergency stop functionality, where the system is divided over multiple service instances in a simple and sensible way. The divided parts are the subsets related to the service instances. To this end, it is crucial to find out how objects, buttons and services can communicate and share data efficiently. The goal is to provide an idea of a system that can be successfully applicable in the future.
1.1.1 Research questions
The research questions for this thesis are the following:
• How can the emergency stop functionality be distributed over multiple service instances? • How should the different parts of the system communicate and share data with each other? 1.1.2 Limitations
Since the thesis work is not done in collaboration with a company, I will not be able to investigate the problem in a real industrial environment, nor will I be able to test the solution with actual data and objects. Because of that, I can only draw conclusions based on the data I have.
2.
Background
In this section, I introduce some background information about concepts and terminology used in the thesis. I describe the concept of Emergency Stop Systems in industries in Section 2.1. In Section 2.2, I describe the concept of the visibility problem both in general and in an emergency stop system, followed by how it is used as an algorithm in Section 2.2.1.
2.1.
Emergency Stop Systems
In many industries, moving and stationary machines interact with human operators. Such working environments come with certain safety concerns including collision avoidance and other dangerous situations. When something happens, operators need to be able to press an emergency stop button and shut down the machines. Emergency stops are therefore an important safety aspect in such environments.
Traditionally, emergency stop buttons are located on or near stationary machines and are set to stop a fixed set of machines, e.g., within a certain area or cooperating machines. Also, the emergency stop is statically decided for each button in the factory. In smart industries with modern machines, some emergency stops are attached to moving vehicles or are a functionality of devices managed by the operators. When a moving machine or stop button no longer are part of a certain area, it is harder to know what to stop, which is why this traditional setup has issues.
There is always, however, the possibility to stop every machine in the factory, but in a larger environment this is very unnecessary and potentially too costly. Instead, a more useful solution is to use a visibility approach i.e., when an emergency stop button is pressed by an operator, all machines visible from the button’s position should be shut down [1]. With such approach, emergency stops do not need to be statically decided or predetermined, meaning, moving machines and operators managing moving stop buttons can move around freely in the factory without jeopardy anyone’s safety. The decision of which machines to shut down is entirely up to the visibility algorithm.
2.2.
Visibility
Visibility is a fundamental problem in computer graphics [5]. In a simple way, visibility can be described as the determination of visible obstacles, where two points in the space are visible to each other if the line segment between the points does not intersect with another obstacle. The space can be two-dimensional as in [6], [7] or three-dimensional as in [8], [1], but in fact any non-negative integer dimension can be used. The determination of visibility can be solved in many different contexts, one of which is to determine the visibility of real world objects in an environment. Other examples, such as the Adaptive Global Visibility Sampling (AGVS) algorithm proposed by Bittner et al. [8], computes visible view cells in a virtual three-dimensional environment.
Two of the most common approaches for determining visibility are ray tracing and z-buffering [5]. The former is a flexible algorithm that supports arbitrary point-to-point or ray queries, and is mostly used where the requirement of accuracy is more important than speed, e.g., in CAD or movies. The latter is mostly used in real-time graphics and is standard in some graphics hardware. In an industrial environment, visibility can be used to determine which machines are visible from an emergency stop button. By computing the visibility, machines that are visible from that point can be stopped when the button is pressed. To clarify, a server sends a stop signal to those machines that are visible from the button’s position. This overcomes the problem of shutting down all machines in a factory and also produces a dynamic stop system, where stoppable machines do not need to be predetermined for each stop button. Instead, only nearby, visible, machines are shut down when a button is pressed.
For a stop system to function optimally, the objects send periodically their locations to the server which in turn invokes the visibility algorithm for each emergency button. This way, the buttons keep their set of visible objects updated at all times.
2.2.1 Visibility as an algorithm
There are many algorithms for solving the visibility problem depending on what type of problem it is. According to Asano et al. [9], the problem can be modelled with a set of disjoint polygons P
and a query point q. The definition is formulated as follows:
Definition 1. Define the subset S(P, q) ⊆ P of all polygons visible from the query point q, where a polygon is visible if there is an open line that connects q with any point of p and does not intersect with any other polygon.
In modern industries, however, some objects may not use the entire space of the polygon. From the view of the query point q, it is possible to see through an object, making an object behind it visible too. In the visibility algorithm by Capannini et al. [1], they have included that it is possible to see through some polygons by having a field transparency related to the object. This is highly relevant since it is possible to see over or under a stationary machine with a moving arm. When dealing with real world objects in an industrial environment, it is an important aspect to consider both fixed objects and moving objects, which is what Capannini et al. [1], as well as Aronov et al. [10] did in their solutions.
Figure 1: A simple model of the visibility algorithm [1].
Objects included in the visibility algorithm are, for example, walls or other obstacles, moving robots, and moving or static machines. Within the algorithm, each object is represented by a 2D bounding volume which encloses the object. A bounding volume can be anything from the simple Axis Aligned Bounding Box (AABB) to the more complex Sphere [11], as long as the approximation is overestimated rather than underestimated. Along with the high relevance of transparency, objects also have to indicate if they are stoppable or not, since a wall for example is part of the algorithm but is not a stoppable object.
The algorithm acts by sweeping the vertices of the objects’ bounding volumes ordered according to their polar angle with respect to the query point q. From q, a ray is fired against each endpoint, as shown in Figure 1. As the sweep proceeds, the algorithm keeps track of the objects intersecting the current ray and those objects, of which segment is reached by the ray, are set visible. The time complexity of this algorithm is O(n2log n) where n denotes the number of objects [1].
3.
Related Work
There are many paper describing distributed systems or parallel computing as well as visibility algorithms of various forms. There are, however, not as many papers on distribution or partitioning of visibility algorithms in relation to my work. Down below depicts close research of partitioning of visibility algorithms.
Zhang et al. [3] constructed an algorithm for parallel and out-of-core view-dependent isocon-tour visualization using parallel computing. The algorithm uses large data sets to extract and render visible parts of the isosurface. By letting the large data sets be partitioned among paral-lel processors, using random data distribution, the overall workload is well balanced and handles scalability without problems. Their algorithm has two major phases, occluder selection and visi-bility culling. Occluder selection includes casting of rays from the viewpoint to approximate visible blocks. These blocks are then used to extract isosufaces to create an occlusion map. In visibility culling, the blocks are culled against this occlusion map and only the visible blocks are used to extract and render isosurfaces. Both phases in their algorithm are parallelized. The first phase partitions the rays among the processors in order to create partial occlusion maps. They are then merged together and used in the second phase. The second phase is computed locally in each processor against this occlusion map and again merged together to create the final image of visible isosurfaces. Their results showed significant performance improvement compared to regular iso-surface extraction, and also decreasing extraction and rendering time proportionally to increasing numbers of processors.
Ware et al. [4] investigated how domain partitioning strategies and parallel computing are affecting the processor workload. Their research consists of a number of distributed approaches, i.e., partitioning of the domain (terrain), and a workstation cluster for computing the visibility algorithm of a wind farm in South Wales. Their research states the issue of uni-processor systems for which the response time is inevitably poor when computing visibility for more than a few locations. Therefore, parallel computing is interesting in their research. Ware et al. used a Digital Elevation Model (DEM) for representing the domain and its 41 x 41 vertices. For the domain partitioning they wanted to address the issue of assigning each processor the same amount of work to minimize idleness and produce a balanced system. They implemented both a static work allocation and a dynamic work allocation for partitioning of the domain. The static approach involves decomposing the DEM between the processors in a way that the allocation of work does not change during run-time. It also requires regularity in the domain and the same amount of work requirements. A dynamic approach, however, decomposes DEM between processors during system run-time and usually there is a so called master process assigning new tasks to worker processors. The use of a dynamic allocation is needed when the structure of the domain is irregular and the work throughout the domain is distributed non-uniformly. The results were processed for up to 24 processors with five dynamic and six static allocation algorithms and measured speed-up and efficiency. It showed that balancing the workload among processors for the static approaches was difficult and the efficiency was affected by this. As for the dynamic approaches, the optimal efficiency was when the workload represented 0.1 - 0.3 % of the domain and dropped if it was out of range. The speed-up measured indicated that the dynamic approaches were the better ones and were overall the better strategies due to the balancing of workload and persistence in relation to the number of processors.
The above research focus on well balanced workload among the processors and are in agree-ment that parallelization increases the response time. In this thesis I will have the same focus of distributing the system evenly and perform experiments on the proposed solution in order to verify response time.
4.
Method
A prototype implementation of the emergency stop system as a single service exists and is available for usage [1]. This implementation solves the communication between components with Docker containers [12] communicating over User Datagram Protocol (UDP). With this implementation, I did not have to start from scratch since the existing one was useful in my work. However, in order to answer my research questions I needed to adjust and add to the current implementation as well as change the communication system.
The method used in my work is a constructive research method. Constructive research is a widely used method in computer science and aims to produce constructions to solve real world problems [13]. A construction can be, for example, a model, product or design, and it is highly beneficial if the construction has theoretical contribution. In a simple way, constructive research includes finding a relevant problem, understand the practically and theoretical topic area, propose a solution i.e., construction, implement and test the solution and finally, analyze and validate the contribution. The steps are iterative and sometimes recursive. Figure 2 shows the flow of the specific steps performed in my work and in the sections below are more detailed descriptions related to Figure 2.
Figure 2: The steps performed using the constructive research method.
4.1.
Literature study
To get a better understanding of the problem and to deepen my knowledge, I did a literature study. The study involved understanding the visibility algorithm both in general and how it is used in industries. Also, I deepened my knowledge in the field of previously conducted research in relation to how the emergency stop system can be distributed and how components of the system can communicate and share data.
The literature study gave me inspiration on different possible solutions and is the foundation for background and related work. Moreover, results from the literature study are used in the construction of the abstract distributed model in Section 6.2.
4.2.
Qualitative analysis of visibility algorithm
As the next step, I did a qualitative analysis of the existing visibility algorithm. This gave me an overview of how the components interact and share data, and an understanding of how the system can be distributed in a good way with easy communication and scalability. After analyzing the algorithm, and with previous information, I had enough information to understand how I can adapt it to fit my problem. The analysis also included deciding which parts to use and what to change or ignore in order to propose and formulate a solution. The result of this step is presented in Section 6.1.
4.3.
Abstract distributed model
With information gathered from the previous sections I proposed a solution. The solution is presented with an abstract distributed model, showing my proposed way of distributing the system and is described in details in Section 6.2. The model also describes the communication and how data are shared efficiently between components in the system. This part is the main contribution of the thesis which I implemented and tested using experiments. I started with a couple of ideas on how to distribute the system and narrowed it down to the one I thought fitted my problem better. An analysis of the abstract distributed model was done before the implementation to make sure that any potential issues or mistakes were eliminated.
4.4.
Implementation
In this step I implemented the proposed solution. This meant changing the components of the sys-tem as well as the communication structure between components. I also changed the computation of visible objects from when the button is pressed to always having the visible objects updated when a button is pressed. The overall goal with the implementation is to validate that the proposed solution works and evaluate the benefits. The implementation is presented in Section 6.3.
4.5.
Experiments
To test the implemented system I did an experiment with different numbers of service instances. I compared my proposed solution with the previous system that had only one service instance by calculating the computation time of the visibility algorithm. This was done to prove a useful solution in terms of a faster system. I also compared the results from the different numbers of service instances to see if the distributed system worked according to what I expected. The experiments are described in more detail in Section 7.
5.
Ethical and Societal Considerations
The work of the thesis does not involve any human information or tests. Since the thesis does not handle any sensitive data or human subjects, there are no ethical considerations involved. Nor do I handle classified data in my implementation or during my experiments. There are, however, ethical considerations in the emergency stop system as such since it is safety-critical and could potentially harm workers if it does not work. Clear instructions are needed for the workers as well as clear responsibilities.
From a social perspective, my work could potentially benefit the economical aspect of an emer-gency stop system. A faster system is more reliable and lowers the risks of a dangerous situation, which in turn saves money. For example, a collision inside the factory due to a slow system could make the company liable for compensation. A more reliable system is also beneficial for the health aspect as it increases the chances of avoiding accidents and in the worst case, fatal outcomes. Therefore, a distributed system could reduce these risks by performing faster calculations and emergency stops.
6.
Distributed visibility-based emergency stop system
This section highlights the main work of the thesis. First is the analysis of the visibility algorithm in Section 6.1. followed by the main contribution of the thesis in Section 6.2. and the implementation in Section 6.3.
6.1.
Analysis of the visibility algorithm
The current visibility algorithm uses the Axis Aligned Bounding Box (AABB) as the bounding volume enclosing the objects. These AABBs have a point, width and height representing the objects in the factory and are used in the computation of visible objects. The simulation of a moving machine uses updates of the position, width or height, and sends these updates to the server. A button is similarly used, but it is represented as a point and is able to send stop signals to the server. The server is responsible for keeping track of all objects and calculates the visible objects whenever a button is pressed. Stop messages are then sent to the visible objects.
In the current system, machines and buttons are clients that randomly send position updates and stop signals to the server. They are both implemented by means of the same type of Docker container, meaning they share the same type of communication. While analyzing the system I realized that I wanted to separate the machines and the buttons so that I could distribute the system properly. This way, machines can focus on sending updates and listening to stop messages, and buttons can focus on sending just stop signals.
Another reason to separate these objects is because the original system uses a so called lazy approach of the visibility algorithm, i.e., the server computes the visibility only when a button is pressed. With the lazy version, stop messages to the machines take longer to send since the visibility algorithm needs to run first. Instead, I implemented a so called eager version, meaning, the visibility algorithm is computed every time an update is received by the server. If an update is received while the system is running the algorithm, the system waits and then runs the algorithm again. This may cause a waiting queue if updates are sent too frequently. In case of congestion due to many updates, a more elaborated approach such as gathering all queued updates before running the visibility algorithm or using different queue priorities would be beneficial.
To be able to compute the eager version, the server needs to know about the registered buttons and loop through them when an update is received, leaving a set of visible objects for each stop button. The disadvantage with the eager version is that the system sacrifices the overall perfor-mance by executing unnecessary visibility computation when there is no emergency. However, the benefit is an improvement of the performance in terms of response time when there is a real emergency.
6.2.
An abstract distributed model
After analyzing the current visibility algorithm, and with the information gathered from the lit-erature study, I found two ways of distributing the system. The two alternatives are about what to partition, where the first option is to partition the objects and the second option is to partition only the stop buttons.
When partitioning the objects, each server handles a subset of the objects, including machines, obstacles and emergency buttons. The computation of the visibility algorithm is done for all buttons within each subset and is run by the server associated with those objects. This solution works well in factories with separate and enclosed rooms, i.e., where there is no visibility between rooms. In the general case where machines can move around more freely in the factory, it is not possible to compute the visibility algorithm correctly if the objects are partitioned among the servers. The solution does not work well since the servers need to know information about all objects that potentially are be visible from the server’s stop button. This is, however, a possible solution for factories with separate rooms, but in the general case it does not work.
The second alternative is to partition only the stop buttons. Each server handles a subset of the buttons and all other objects that are included in the visibility algorithm are accessible to all servers. This is a more general and applicable solution since I cannot assume that a factory has separate rooms.
The main contribution of the thesis and the proposed solution of a distributed system is there-fore based on the second alternative. With partitioning of the buttons, the servers only need to know information about its own set of buttons and do not have to know the positions of the other servers’ stop buttons. This means that the servers compute the visibility of objects only for the buttons of its own subset, where all the other objects’ information are shared among the servers.
Because all servers need the objects’ information, it is beneficial if the communication is one-to-many rather than one-to-one. With one-to-one-to-many communication, the objects do not have to know how many servers to send to. It is simply enough to send updates only once and the information should reach all servers. The decision of one-to-many communication is at a conceptual level where both broadcast and multi-cast can be of use. In this thesis, however, a system component distributes copies of the same message to the recipients’ addresses. The recipients, i.e., the servers, are part of a distributed system mainly because of the separated Docker containers.
As seen in Figure 3, a middleware component is responsible for the one-to-many communication by distributing the incoming messages to the servers. The benefit for the clients to send only once is that it simplifies the communication and provides a more scalable solution when e.g., more buttons are added.
The middleware is also responsible for the partitioning of stop buttons. When a stop button first registers, the middleware goes through every known server to find the one with the least number of buttons assigned to it, and assigns the new button to that server. Later, when a stop signal is received by the middleware, the message is sent to the server address assigned to that button.
Figure 3: An abstract distributed model showing the system components and the communication between components.
With the shared information among the servers I had two alternatives, both of which included sharing the objects’ information. One alternative was to have the information stored in a single place where all servers have access, while another alternative was for the servers to have a local copy of the shared information. I chose to use the second alternative since it offers a more independent system, where each server is isolated from the other servers.
important thing is that the visibility computation is based on sufficiently recent data. A slight difference in consistency among the local copies does not affect the validity of the computation since the servers perform independent computations. The middleware also handles the incoming messages one by one and are then distributed to the servers in the proper order, which helps with the consistency.
Figure 3 shows a simple situation with two machines, two buttons and two servers. The machines and buttons have already been registered and the buttons have been assigned to one server each. The middleware component handles the one-to-many communication by receiving messages from the clients and distributing the messages to the servers, depending on what type it is. A machine update is forwarded to all servers while a button update or stop signal is forwarded to the correct server. Here, update (1) is sent to the middleware where it is processed and discovered as a machine update. The message contains information about the machine’s bounding box including a point, width and height. The two fields transparent and stoppable as well as the sender’s address are also included in the machine update message. The middleware forwards this message (2)(3) to both servers, creating a local copy of the information about Machine 1. When the servers receive their message, the visibility algorithm is invoked and calculated for every stop button in their subset. Here, Server 1 calculates visible objects from Button 1 and Server 2 from Button 2. With the local copy of machines, each server is always updated before any visibility computation. At the stop signal (11) sent from Button 1, the message is received by the middleware and directly sent to the associated server, in this case Server 1. At this time, only Machine 1 is visible from Button 1 and therefore, only that machine receives a stop message from Server 1. The server received the address of Machine 1 from previous machine update and can send the stop message directly to the machine, without passing through any other system component.
6.3.
Implementation
The earlier version of the emergency stop system was implemented using the Go programming language and components were built up using Docker containers communicating over UDP. The Go language offers a syntax similar to the C language but has more advantages [14]. The language is efficient, has a focus on compilation speed and unlike C, Go have multiple return values. Fur-thermore, Go supports maps with key-value pairs and goroutines which are functions that run in parallel. Goroutines are especially good in this solution since all components need to listen to mes-sages while performing other tasks. In the emergency stop system, the goroutines have channels that they listen to and continuous the process when a message is added on the channel. All of these features were helpful for my implementation and that is why I continued with the Go language. Also, docker files and UDP connections already existed which helped me save some time.
6.3.1 Eager version
I started with dividing the buttons and the machines into separate containers. Machines send updates and listen to stop messages from a server, while buttons send updates and stop signals. The server listens to two different kind of messages: ButtonPressed or BoxUpdate. When a BoxUpdate message is received by the server, whether it is a position update, a box movement or a new object, the visibility algorithm is invoked. After the update is registered, the server loops through its list of buttons, mapping each button ID to a list of visible objects. The list of objects is returned from the visibility function stopVisiblesFrom(button.Center) that is calculating visible objects from the current query point, i.e, the button position.
When a ButtonPressed message is received, the server checks the button ID and the associated list. There is nothing to stop if the list is empty. If the list is not empty the stoppable objects are added to the channel used by the goroutine function Stopper(), which in turn sends stop messages to the objects on the channel. With this eager version, stoppable objects are ready to be stopped before any stop signal is received and therefore improves the response time significantly.
6.3.2 Partitioning of emergency stop buttons
When the eager version was working I moved on to partitioning the stop buttons and handling the communication between the components. I wanted abstraction between the clients and the servers
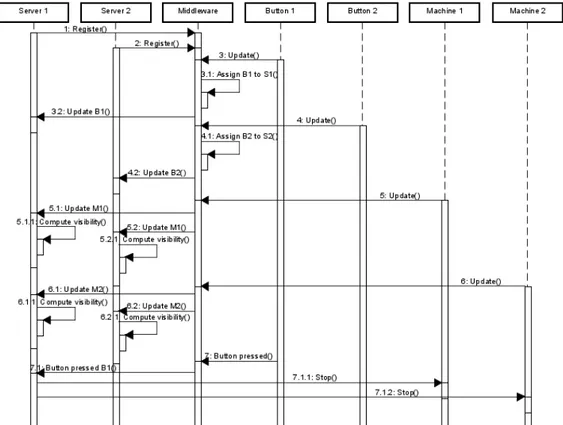
Figure 4: Example of registration and allocation of stop buttons.
to ease the communication when multiple servers were involved. The first solution discussed was to have Data Distribution Service (DDS) [15] as the communication. I discuss my initial plan and why I chose differently in Section 8.
Instead, I implemented a middleware that receives messages from the clients and distributes these messages to the correct recipient. I changed the communication to go through the middleware instead of directly to the previous server, so that the clients do not have to know the addresses of the servers. As seen in Figure 3 and Figure 4, the middleware passes the message to all servers if it is an update from a machine. This is so that every server has its own local copy of the current machine state and can calculate the visibility algorithm properly. Instead, if a button sends an update or a stop signal, the middleware passes the message to the correct server.
The middleware is responsible for assigning buttons to servers and to do this, all servers need to register to the middleware. Server addresses are saved and used later when a button first sends a message. A number variable keeping track of how many assigned buttons the server has is also initiated. As seen in Figure 4, the two servers register to the middleware. When Button 1 wants to register at (3), the middleware assigns the button to Server 1. This is done by going through the list of servers and mapping the button ID to the server address with the smallest number variable, in this case Server 1. The message is forwarded to that server (3.2) and all other future messages from Button 1 will be sent to Server 1. The middleware also updates the server’s number variable by adding one. The same is done for when Button 2 wants to register, except that Server 2 is now the server with the smallest number variable, therefore Button 2 is assigned to Server 2.
As mentioned before, machine updates are sent to all servers and invoke the visibility algorithm for each server. In Figure 4 when Button 1 presses the stop button (7), Server 1 receives the message and has a list of visible objects from the button’s position. In this case, the server can quickly send stop messages to both Machine 1 and Machine 2.
7.
Experiments
The experiments included tests of proving a useful solution, comparison between my implemented solution and the previous version with only one service instance, and comparison between different numbers of service instances to see if the system workload is more distributed with more servers. All tests were run on a Windows computer with 8GB RAM and an Intel Core i5-8250U processor. The test setup was measuring the time it took for a single server to perform the visibility calculations for all buttons in its subset, when a single machine update was received. I added in the code a timer at the beginning and at the end of the function that is updating the server’s visibility information. Thus, each incoming machine update gave one measurement for each server. Because each object, server and middleware is a separate Docker container, I wanted to minimize the workload for the computer when testing the system. The most important components were the server and the middleware. The server was needed because it computes the visibility algorithm and the middleware is the component communicating with the server. Therefore, I changed the implementation in the middleware to act like the clients, i.e., the set of machines and buttons. The middleware creates buttons and assigns them to a server in the same way as the proposed solution. All buttons are then registered on the associated server and prepared for visibility calculations. Furthermore in these experiments, the middleware also generates and sends a set of client updates to the servers.
Because the experiments focus on measuring the time of the visibility calculations, I had no reason to use the functionality of stopping machines. The middleware simply sends the messages and the servers compute the visibility calculations. I also wanted the servers to have an equal chance when performing the calculations. Therefore, static walls that were initially included among the AABBs were removed. The static walls were involved to simulate a real industrial environment where they potentially hide machines when the algorithm is computed. I removed this to avoid calculations where one server has all machines visible and another server has all machines hidden, since it affects the computation time.
The tests were run for different number of servers while the other parameters were identical for each run. I also ran the same setup five times to be able to present a more reliable result. The parameters were:
• 50 machines • 10 stop buttons
• 10 updates/machine i.e., each of the 50 machines sends a total of 10 machine update messages before the system ends. The total number of messages among the machines is 500.
The number of servers were 1, 2, 5 and 10.
I ran the test from the terminal with the commands shown in Figure 5. The middlewareserver represents the middleware component and emergencybrake represents one server. For the cases where I ran multiple servers I just added more docker run commands for emergencybrake.
When running the system, the server writes the measurements to a log file inside the server’s Docker container. This file is retrieved by running the command in Figure 6, where NAME is replaced with the container name of the server.
Figure 6: Docker command for fetching the result file.
Each run, the server generated 500 measurements, which is a total of 2500 measurements per server over 5 runs. For example, if I ran two servers they together generated 1000 measurements each run, ending with a total of 5000 measurements after 5 runs. From the results I calculated min, max, median, standard deviation and average, and compared each case’s result with the others.
7.1.
Experimental Results
The implementation of the abstract distributed model is on its own a result of a useful solution, since it proves that the model could be implemented. A further proof of a useful solution is if the results from the cases with multiple servers generate faster calculations than the case with only one server. Moreover, tests with for example five servers should generate faster calculations than tests with two servers, since the workload is more divided with five servers. In the following diagrams, the horizontal line represents the median and the cross represents the average of the measurements. The boxplot is also set to exclude any outliers. The results obtained are presented below for each case.
7.1.1 Case 1 - One Server
For case 1 I ran the system with one server and the results can be seen in Figure 7. Min and max are 107 and 533 microseconds respectively, and standard deviation is calculated to 254 microseconds. The overall average of the first case, with one server handling the visibility calculations for all ten buttons, is 342 microseconds. Compared to the median, the average is slightly higher.
Figure 7: Diagram showing the results of Case 1 with one server.
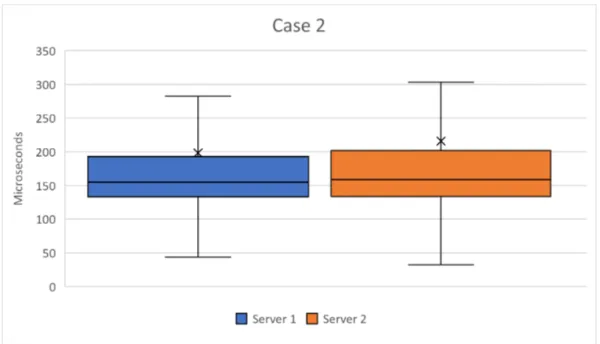
7.1.2 Case 2 - Two Servers
For case 2 I ran the system with two servers, each server handling five buttons, and the result can be seen in Figure 8. Here, the system’s min and max are 38 and 293 microseconds, and standard deviation is calculated to 304 microseconds. The overall average is 207 microseconds and compared to case 1, case 2 has improved the visibility computation time with almost 40% due to
the partitioning of stop buttons. The results from case 2 also show that min and max are lower than case 1 but the standard deviation is higher. Unlike the median inside the box, the average is slightly higher than the upper quartiles. This is because the average also includes the outliers and a few outliers are much higher than the rest of the values.
Figure 8: Diagram showing the results of Case 2 with two servers.
7.1.3 Case 3 - Five Servers
Case 3 was run with five servers, each handling two stop buttons. As seen in Figure 9, the system’s min and max are 5 and 168 microseconds respectively. Standard deviation is calculated to 402 microseconds. The overall average for case 3 is 141 microseconds and compared to the other two cases, this is an even better improvement. A system with five servers has decreased the visibility computation time with almost 59% compared to one server. Compared to case 2, case 3 has an improvement of almost 32%. The results from case 3 also show lower values on min and max and the standard deviation is higher than the two previous cases. Unlike the median, the average is between the upper quartiles and the largest data points.
7.1.4 Case 4 - Ten servers
For the last test I ran the system with ten servers where each server was handling one stop button. All servers together represented the system and the results can be seen in Figure 10. The system’s min and max are 4 and 120 microseconds, and standard deviation is calculated to 509 microseconds. The final overall average is 112 microseconds and looking at the results of the other cases, case 4 performs even better. The visibility computation time has decreased further and is an improvement of over 67% compared to case 1 with one server. Compared to case 2 and case 3, ten servers improves the visibility computation time with almost 46% and 21% respectively. As seen in the other cases, min and max are lower while the standard deviation is higher. The average is also slightly lower than the largest data points shown in the diagram.
7.1.5 Comparison
As presented above, the result decreases for each case. This is because the visibility workload is distributed among the servers and the system runs parallel computations. A system with multiple servers, from the results presented, is useful and performs faster calculations than the original system with only one server. Worth noting is that the improvement among the cases gets smaller
Figure 9: Diagram showing the results of Case 3 with five servers.
and smaller even though the number of servers increases with double or more. Another note is that min and max decreases while the standard deviation is increasing for each case. The reduction of min and max is not an odd result since the increment of servers leads to less work and faster calculations. The standard deviation, however, indicates that the measurements are more diverse with more servers. Nevertheless, both the medians and the averages are decreasing for each case and Figure 11 shows a comparison of the overall averages for 1, 2, 5 and 10 servers.
Figure 10: Diagram showing the results of Case 4 with ten servers.
8.
Discussion
The main contribution of the thesis is the abstract distributed model presented in Section 6. This model enables the visibility-based emergency stop system to run the visibility computation over multiple service instances, which from the experimental results improves the computation time. Not only is the system scalable for adding more servers and clients, but the system can secure a faster response time when an emergency occurs. This is due to both the partitioning of buttons but also the implemented eager version where the calculation of visible objects is run before the actual emergency.
The purpose of the thesis was to provide a distributed version of the overall emergency stop functionality, where the system was divided over multiple service instances. From the proposed distributed model, where the partitioning of the stop buttons was a key factor, and the imple-mentation, I would say that the purpose is achieved. I also found a way for the components to communicate by adding a simple middleware that distributed the incoming messages to the correct server. From the achieved purpose I also answered my two research questions of how the system can be distributed and how the component should communicate.
Even though I added a software in between the servers and the clients, my initial plan was to use something more of a publish/subscribe protocol for the communication [16]. My idea was to separate the clients and the servers as much as possible in order to increase scalability, and a publish/subscribe communication would decouple the components even more since the servers could subscribe directly to the topics instead of having the messages passing through the middleware. Due to time limitation I decided to leave that for future work.
Other problems I had during the work involved the Go language and the Docker containers. I had never worked with either of them before and there was a lot of new knowledge to learn. The two main time consuming parts were sending a specific structure as a message and writing to and retrieve the result file in the Docker container. The structure involved an address of type net.IP which was not welcomed by the Go language during message transfer. When writing, all variables needed to be of fixed size which I was not familiar with. The result file seemed easy until I could not find the file anywhere. It turned out that the file was hiding inside the Docker container and was removed when the system was turned off.
The implementation is a functional system capable of simulating an emergency and stopping machines visible from the pressed stop button’s position. The system is, however, not tested with actual machine values and the reader of the thesis must take that into consideration. Moreover, the test setup with 50 machines, 10 stop buttons and 50 updates per machine is not ideal for simulating a real industrial environment since I strongly believe that the general environment is much larger than that. Nevertheless, the experimental results show a clear improvement of the computation time when running the system with multiple servers. Why the results gave less improvements when I doubled the servers, I believe, is because the tests are ultimately running on one computer. I have a limited amount of cores and threads while performing these test, and the experimental results are affected by that. The ideal result when running two servers would be half the computation time as running one server, but the result only showed 40% improvement.
Compared to previous research [3][4], my experimental results also showed performance im-provements in terms of response time when the workload was partitioned among the processors (servers). The response time, however, was not proportional with the increased number of proces-sors as in [3], but that is obviously understandable and discussed above. My abstract distributed model also focused on partitioning the workload evenly, i.e., assigning new buttons to the server with the smallest number value. This was done during run-time like the dynamic approach in [4], and is beneficial when the workload is not predefined, e.g., when new buttons are added during run-time.
The abstract distributed model and the experimental results shown in this thesis are not just suited for emergency stop systems. The results can be useful for all time-critical and safety-critical systems where the computation, for example, needs to be fast. Also systems that processes large data sets can benefit from partitioning the workload among multiple processors.
9.
Conclusions
In this thesis, the main goal was to provide a distributed system of the overall emergency stop functionality, and in relation, find out how machines, stop buttons and service instances can communicate and share data efficiently. The two research questions: ”How can the emergency stop functionality be distributed over multiple service instances?” and ”How should the different parts of the system communicate and share data with each other?” was the main focus during my work.
To solve this, I did an analysis of the visibility algorithm in order to understand the previous system as well as decide which parts to use and what needed to be changed. This, together with a literature study, led to an abstract distributed model showing how the emergency stop system is distributed over multiple service instances. The partitioning of stop buttons led to division of workload among the service instances and the middleware between the clients (machines and buttons) and the servers created the one-to-many communication from the clients. The middleware was also the distributor of messages to the servers.
Experiments were made to test the computation time of the visibility algorithm for each server after the partitioning of stop buttons. The results showed a clear improvement of the performance in terms of response time for the distributed system, compared to the system with only one server. They also showed decreased response time when the number of servers were increased.
Although the system could use more extensive testing with larger numbers of machines and buttons, the results obtained indicate that such a system is significant and may be relevant to other time- and critical systems or systems with large data sets.
9.1.
Future Work
The solution described in the thesis can be improved in several ways. As mentioned before, the partitioning of stop buttons are performed during run-time among the registered servers. If a server has a malfunction and stops working, no re-partitioning is done in the current solution. In a fully functional system, this would need to be added. On the other hand if a new server wants to connect, the system will slowly work towards balancing the workload since new stop buttons are assigned to the server with the lowest number of buttons. However, re-partitioning work would be beneficial here as well to sooner balance the work between the servers. Furthermore, re-partitioning would also be required when several stop buttons assigned to the same server have malfunctions.
Mentioned in the discussion was my initial plan to use a publish/subscribe protocol [16] for the communication between the system components. I believe that it would simplify the imple-mentation of the servers and the clients without a distributing middleware and thus improving maintainability. Basically, the servers could subscribe to the topics related to their own subset of stop buttons. In addition, I believe that the re-partitioning of buttons would be much simpler, e.g., when a server has a malfunction.
Lastly, my work lacks more extensive tests in order to completely rely on the system. This is open for future work. In fact, one of my goals for this thesis was to provide an idea of a system that can be successfully applicable in the future. Therefore, I am open for future improvements until there is a fully functional, safe and reliable system.
References
[1] G. Capannini, J. Carlson, and R. Mellander, “Thou shalt not move: A visibility-based emer-gency stop system for smart industries,” in ECBS ’21: 7th Conference on the Engineering of Computer Based Systems, Novi Sad, Republic of Serbia, 2021, pp. 1–4, [Online]. Available: http://www.es.mdh.se/publications/6201-, Accessed on: 2021-04-08.
[2] T. Koch and M. Wimmer, “Guided visibility sampling++,” Proceedings of the ACM on Com-puter Graphics and Interactive Techniques, vol. 4, no. 1, p. 4, Apr. 2021, doi: 10.1145/3451266. [3] X. Zhang, C. Bajaj, and V. Ramachandran, “Parallel and out-of-core view-dependent iso-contour visualization using random data distribution,” in VISSYM ’02: Proceedings of the symposium on Data Visualisation, Goslar, Germany, 2002, pp. 9–18, [Online]. Available: https://dl.acm.org/doi/10.5555/509740.509742, Accessed on: 2021-05-23.
[4] J. A. Ware, D. B. Kidner, and P. J. Railings, “Parallel distributed viewshed analysis,” in GIS ’98: Proceedings of the 6th ACM international symposium on Advances in geographic infor-mation systems, Washington D.C., USA, 1998, pp. 151–156, [Online]. Available: https://doi-org.ep.bib.mdh.se/10.1145/288692.288719, Accessed on: 2021-04-14.
[5] W. Hunt, M. Mara, and A. Nankervis, “Hierarchical visibility for virtual reality,” Proceedings of the ACM on Computer Graphics and Interactive Techniques, vol. 1, no. 1, p. 8, Jul. 2018, doi: 10.1145/3203191.
[6] G. Sharma, C. Busch, and S. Mukhopadhyay, “Brief announcement: Complete visibility for oblivious robots in linear time,” in SPAA ’17: Proceedings of the 29th ACM Symposium on Parallelism in Algorithms and Architectures, Washington D.C., USA, 2017, pp. 325–327, [On-line]. Available: https://doi-org.ep.bib.mdh.se/10.1145/3087556.3087591, Accessed on: 2021-04-18.
[7] L. D. Floriani and P. Magillo, “Algorithms for visibility computation on terrains: a survey,” Environment and Planning B: Planning and Design, vol. 30, no. 5, pp. 709–728, Sep. 2003, doi: 10.1068/b12979.
[8] J. Bittner, O. Mattausch, P. Wonka, V. Havran, and M. Wimmer, “Adaptive global vis-ibility sampling,” ACM Transactions on Graphics, vol. 28, no. 3, p. 94, Jul. 2009, doi: 10.1145/1531326.1531400.
[9] T. Asano, T. Asano, L. Guibas, J. Hershberger, and H. Imai, “Visibility of disjoint polygons,” Algorithmica, vol. 1, no. 1, pp. 49–63, Nov. 1986, doi: 10.1007/BF01840436.
[10] B. Aronov, L. J. Guibas, M. Teichmann, and L. Zhang, “Visibility queries and maintenance in simple polygons,” Discrete and Computational Geometry, vol. 27, no. 4, pp. 461–483, Jan. 2002, doi: 10.1007/s00454-001-0089-9.
[11] H. A. Sulaiman and A. Bade, “Bounding volume hierarchies for collision detection,” in Com-puter Graphics, N. Mukai, Ed. Rijeca, Croatia: InTech, 2012, ch. 3, pp. 39–54, [Online]. Avail-able: https://www.intechopen.com/books/computer-graphics/bounding-volume-hierarchies-for-collision-detection, Accessed on: 2021-04-16.
[12] Docker, “What is a container? a standardized unit of software,” [Online]. Available: https://www.docker.com/resources/what-container, Accessed on: 2021-04-14.
[13] K. Lukka, “The constructive research approach,” in Case study research in logistics, L. Ojala and O. P. Hilmola, Eds. Turku, Finland: Publications of the Turku School of Economics and Business Administration, 2003, pp. 83–101.
[14] F. Schmager, N. Cameron, and J. Noble, “Gohotdraw: Evaluating the go programming lan-guage with design patterns,” in PLATEAU ’10: Evaluation and Usability of Programming Languages and Tools, Reno, Nevada, USA, 2010, p. 10, [Online]. Available: https://doi-org.ep.bib.mdh.se/10.1145/1937117.1937127, Accessed on: 2021-05-20.
[15] D. Foundation, “What is DDS?” [Online]. Available: https://www.dds-foundation.org/what-is-dds-3/, Accessed on: 2021-06-15.
[16] AWS, “Pub/sub messaging,” [Online]. Available: https://aws.amazon.com/pub-sub-messaging/, Accessed on: 2021-05-22.
![Figure 1: A simple model of the visibility algorithm [1].](https://thumb-eu.123doks.com/thumbv2/5dokorg/4843961.131143/8.892.196.700.415.695/figure-simple-model-visibility-algorithm.webp)