- Short and Long Term
Paper presented at Seminar o GIS, City Sustainability
f and Environment,Cairo, Egypt, 10 14 December, .1 95
Pontus Matstoms
00 05 O') H G Flm
x 0 >» h uH h :CB mSwedish National Road and
VTI särtryck 310 - 1998
GIS Applications in Urban Transports
- Short and Long Term Forecasting Models
Paper presented at Seminar on GIS, City Sustainability
and Environment, Cairo, Egypt, 10 14 December, 1995
Pontus Matstoms
Sweäisir
am
Swedish Road and
,Transport Research Institute
GIS Applications in Urban Transports.
Short and Long Term Forecasting Models
Pontus Matstoms1
ABSTRACT
The National Road Administration and other traffic authorities in Sweden, including the Swedish Road and Transport Research Institute (VTI), have during the last decade gradually introduced GIS in many of their applications. Typical examples include the planning and forecasting process, environmental computations and traffic safety. In this paper, we summarise some of our experiences and give concrete examples of applica tions where GIS successfully has been used. The paper also contains a brief description of the Swedish road database.
1. Introduction
Geographical information systems (GIS) have during the last decade become an invaluable tool in many areas connected to transports. Examples of applications include traffic planning, network analysis and environmental effects. A key explanation to the increasing use and inter est in GIS is the introduction of inexpensive software and hardware technology. It is clear that wide spread use of GIS requires high quality software and hardware to a reasonable price. In practice, investments in GIS normally compete with other investment proposals. Another im portant factor when GIS is introduced, is the access to digital maps and spatial data. So far, the experience is that data both can be very difficult to find and, when available, being too expen sive. It should be emphasized that lack of digital data indeed is a problem. It precludes the implementation of many interesting applications. A general conclusion is that new technology in practice only can be motivated if the investments are reasonable and significant concrete advantages in functionality can be expected.
A process similar to the one now observed for GIS, was seen ten years ago when word proc essing was introduced. Typewriters then started to be replaced by personal computers. The restraining factor was at that time too expensive computers and printers. Also the minimum requirement, that the new technology makes an improvement compared with previously used solutions, was in the beginning not always satisfied. An important difference between GIS and the example of word processing is, however, that GIS often is introduced without replacing a previous solution. It is rather introduced to solve previously unsolved problems.
A GIS can be viewed as a toolbox for visualisation, manipulation and storage of geographical data. The toolbox must then include relevant hardware and software components, but also the required spatial data in digital form. In some definitions also the staff resource is considered
as a part of the overall concept defining a GIS. However, in the following discussion we con sider GIS as a combination of hardware, software and data. The quality of these three parts determines the usefulness and strength of the system, and consequently its ability to solve real problems. Let us make our point even more clear by the graph in Figure 1. It illustrates the strong connection between the three components. The system itself tends to be as weak as the weakest node in the graph.
Hardware * Computers 0 Printers * Scanners etc. Digital data 0 Maps (Attribute data Software ' ArcInfo/MapInfo 0 Access 0 Excel
Figure 1. The three strongly connected components defining a GIS.
Starting with the software issue, we point out that software packages for GIS applications in general are designed for
0 Graphical presentation
* Interactive processing and manipulation of data
* Storage of geographical data
By graphical presentation we mean the standard possibility to combine different geographical data layers into a map. This way of using a GIS is often considered as trivial and therefore underestimated as a useful practical tool. The combination of data can, without further proc-essing, give invaluable information and insights that can be achieved only in such a way. One example is an environmental application where an observed water pollution can be explained by surrounding polluting industries. Another example is the use of GIS in epidemiology, where geographical propagation of infections is studied and explained through digital maps. This way of getting new knowledge and understanding for complex relations can thus be very fruitful.
Manipulation and processing of data, which not necessarily need to be interactive, include any of the typical GIS operations where attribute values or descriptions of geography are used to compute new information. One example is the classification of data in such a way that differ ent geographical objects under certain criteria are combined or associated with each other. Cities in a certain region with a prescribed level of car ownership can, for example, be com bined and analysed in such a way. In another more advanced GIS application, Sweden was divided by a regular grid of ZOXZO kilometre squares. The total pollution of NOx from traffic was then distributed on these grid elements. Since contributions were taken from many differ
ent data layers (national roads, regional roads, cities and sparsely populated areas etc.), GIS was an important tool for the geographical merging of data.
An often underestimated feature of GIS is the possibility to easily store geographical data. GIS software offer very reliable tools for handling and storing large geographical data sets. Related to this is also the possibility to manually use the database to retrieve attribute values and the use of GIS for validation of data. This way of using GIS for verifying input data and computed results is often emphasized, and considered as very important.
The Swedish traffic and transport authorities are exclusively using the most widespread soft-ware packages, like Arc/Info and ArcView, MapInfo and Intergraph. For traffic network ap-plications, also TransCAD is used. It is a GIS program designed with special attention to net work applications, statistics and econometric analysis. It includes a large collection of proce-dures for the above type of applications. TransCAD has also capabilities for handling user defined macros and the use of external software routines written in high level languages. Arc/Info is another software package with special network capabilities. The Network toolkit for Arc/Info has tools for optimal routing and resource allocation. User defined macros in Arc/Info can be developed in a language called AML/SML. ArcView is written in the Avenue language, which also can be used for the implementation of new macros.
In practice, GIS environments often consist of more than one software package; typically one or two of the standard programs mentioned above. However, these programs often need to be extended by user developed programs in high level languages like FORTRAN and C. Built-in macro languages in, for example, ArcView can also be used. Also more specialised programs for statistical and mathematical analysis (for example Matlab, Excel and SAS) are often re quired. Figure 2 shows the GIS environment currently used at VTI. The structure of the graph is probably typical, and similar to the structure on many other sites where GIS is used. The programs mentioned at the bottom of the figure (Emme/2, Stan and Vips) are used for net-work analysis. On the surface they are similar to GIS programs, but they do not have the stan dard GIS capabilities and should therefore not be considered as GIS software.
~Emme/2
-STAN oVIPS
Figure 2. The GIS environment used at VTI, Sweden.
The next node in Figure l corresponds to data. Often required digital maps are, of course, de scriptions of various administrative regions (counties, municipalities, cities etc.) and natural objects (lakes, rivers etc.). In transport analysis also digital descriptions of the infrastructure
are required. Descriptions of forecast regions for network analysis is another example of data used in transport applications.
Sweden is divided into about 9500, so-called, SAMS areasz. These are defined to be homoge
nous in terms of population size, wherefore their geographical size may vary. In cities and villages, where the population density is high, a single SAMS area may cover a rather small neighbourhood. SAMS areas in the country side are, on the other hand, generally much larger. A large set of socio economic variables are available for the SAMS areas. These include, for example, the population size for men and women in different age groups, a detailed descrip-tion of the income distribudescrip-tion, the number of private cars and the number of families. Alto gether, there are more than one hundred variables.
The definition of SAMS areas, making them relatively small in terms of population, makes it attractive to use them as atoms in the definition of larger model regions. Thus, SAMS areas are combined and aggregated to define larger geographical regions used in, for example, net work analysis. It should also be noticed that the definition makes it possible to form counties and other administrative regions by the exact merging of SAMS areas.
Maps are, as already mentioned, often difficult to obtain in digital form. A possible solution is then to transfer printed maps into digital form (digitalisation). This is either made by manual measurements or by the use of special technical equipment. It is, in particular, the (x,y) co ordinates of the individual objects that have to be transferred to the GIS. The use of advanced technical equipment, scanners and digitizers, can be very helpful but requires a good deal of experience. Another possible problem that should be mentioned, is that digital data indeed may exist, but in an appropriate format. Conversion between different data formats is tedious and often a too complicated task for a user without special training. So far, the often used software packages, like MapInfo and Arc/Info, are based on different data formats. A standard format would save a lot of trouble.
Finally, we brie y comment on the third and last node in Figure 1; the hardware issue. Al though UNIX workstations from a technical point of view tend to be preferable, standard per sonal computers are probably used in most GIS applications. The explanation is a rather dra-matic difference in cost for both hardware and software. In particular when GIS is used mostly for desktop presentations, personal computers are very competitive. Real applications, in-volving time and memory consuming operations, may on the other hand require more ad vanced hardware.
In this paper, we survey parts of the Swedish traffic authority s use of GIS. This is made by concrete examples of application where GIS is used as a natural and useful tool. First, we de-scribe an application related to real time traffic assignment analysis. This problem arise, for example, in route guidance systems where vehicles dynamically are guided to avoid traffic congestion. In the considered application, the real time computation is instead used as an ex tension of the TransCAD software. We then consider a recent work on models for personal car ownership. The number cars and the number of persons having access to car, are important input variables in models for estimating future travelling and peoples choice of transport modes. GIS plays an important role in the definition of forecast regions and in the analysis of results. In the following section, we consider the tools used in the national traffic planning process. Some concluding remarks are finally given in the last section. Before we focus on the applications, we brie y describe the Swedish road database, managed by the National Road Administration.
2. The Swedish road database
The Swedish National Road Administration maintains a large database covering the national road system. Except for a detailed geographical descriptions, where the roads are defined by frequent (x,y,z) co ordinates, the database also contains many other related attribute values. Below we give some examples:
' Traffic accidents - Geographical position
Type of accident
Consequences in terms of injured and killed Weather
- State of the road
' Road data
Road technical data - Traffic technical data
Accessibility Temporary restrictions Speed limit ' Bridge data - Geographical position Physical/technical description Damages - Maximal load
Moreover, processed data, like traffic flows and distances between cities, can be obtained from the database. Traffic flows are then either observed or estimated. There are, of course,
many applications where data from the road database can be used. Below we mention some typical examples:
' Environmental studies
' Traffic safety
' Maintenance of winter roads ' Traffic control
' Long term investment planning
It is clear that traditional GIS software packages, like MapInfo and ArcView, successfully can be used together with the road database. Graphical presentations of attribute vales can, for example, easily be produced. Another example is the production of maps. The use of GIS be comes even more useful and unique when the database is combined with data from other sources, or when complex queries and classifications are made. An important application is to find suitable ways for transports of hazardous chemical waste. To minimise the worst case consequences of a possible traffic accident, conditions involving traffic, population density, subsoil water and other considerations along the road must be taken into account when alter native ways are compared. By combining different databases and formalising the above type of conditions as queries, it is possible to simplify the analysis.
The National Road Administration is today developing a GIS environment for the road data base. ArcView is one example of software that can be used for presentations and simple geo graphical operations. Arc/Info will be recommended for the more complex operations.
3. Real time traffic assignment
A standard problem in transport science is to estimate link flows in traffic networks. The input data is normally an estimated O D matrix, describing the travelling between different nodes (regions) in the network. Thus, the matrix element (i,j) gives the total number of trips from node i to node j. Here, we refer to (i,j) as an O-D pair in the considered network. A combina tion of observed link flows and selected O-D relations may also define the input data to be used. The trafic assignment problem (TAP) estimates the network link flows in such a way that vehicles are assigned the best way between their origin and destination nodes. Let us first assume that the travelling time not is affected by delays due to other traffic. Then the vehicles between any two O-D nodes are assumed to always choose the shortest path. Thus, the solu tion to (TAP) is simply obtained by computing the shortest paths between all combinations of origin and destination nodes in the graph. The resulting flow on each individual link then equals the total flow of all paths using the considered link. In this case it is obviously true that only one path is used for each O-D relation, unless there are multiple shortest paths between two nodes. The traffic is thus not distributed on many different paths, which may be the case under the assumptions considered below.
A slightly more complicated situation must be faced when queues and traffic congestion af fects the travelling time. The shortest path is then not necessarily the fastest. For each network link, a volume delay function is used to describe the relation between traffic flow and travel ling time. Figure 3 gives a typical example of such a relation.
Travelling time
350 300 // 250 x U) / "O C . 0.) U) 150 / 100 //
50
.
i
0 2 4 6 8 10 Flow (cars/24 h) x 104Figure 3. Typical volume delay function.
In this case, where the travelling time depends on the traffic ow, the traffic assignment
problems is solved by iterations. From the above shortest path solution, it is clear that vehicles may gain time by choosing a longer path with a lower traffic flow. In each iteration, vehicles are in this way moved between alternative ways until user equilibrium or system optimum is reached. This means that a solution has been obtain such that each vehicle is assigned the best possible way (individual gains can not be achieved by alternative paths) or the total driving time for the system is minimised. This defines two different assumptions of vehicle behaviour
and, consequently, two alternative object functions to be minimised. Both the user equilibrium and system optimum solution defines an optimal distribution of vehicles on alternatives paths connecting the different O-D nodes.
Many metropolitan areas around the world are facing serious congestion problems, which threaten to deteriorate the quality of life and increase air pollution from traffic. It was esti mated that traffic congestion in the late eighties accounted for more than two billion vehicle hours of delay and 2,2 billion of gallon of excessive fuel consumption in the United States. In the next decade, the expected dramatic increase in travel demand with the diminishing con struction of new transportation facilities is likely to make the traffic conditions even worse, unless new methods for relief of congestion can be developed and implemented in time. One promising approach for alleviating congestion is the development of intelligent vehicle and highway systems. Important improvements in mobility, highway safety and decrease in queuing times can thus be achieved through integrated applications of advanced technologies, including communication and route guidance. Such advanced systems must be designed to efficiently handle large amounts of data. For example, frequent snap-shots of the current traf fic situation assumes both fast communication and short computer processing times.
VTI is involved in a European research project with focus on traffic management in the city of Barcelona, Spain. The city is build on a small strip between a mountain and the Mediterranean see. Traffic moving from one side of the city to the other is mixed with traffic in the city cen-tre as well as the transit traffic. To handle this situation, automatic traffic signalling of some multi-lane streets has been introduced. During peak hours the direction of the lanes can thus automatically be reversed with respect to the direction of current traffic flows. In order to im-plement such changes in directions of the lanes, the traffic engineers must be able to perform necessary analysis and prediction by repeatedly solving traffic assignment problems of huge size in an overall time of a few seconds. To fulfil these rather hard requirements on computa tion times, parallel computers are used to solve the traffic assignment problems. Referring to the above discussion, we remark that the 0 D matrices in this case locally are constant but new observed link ows continuously change the solution.
GIS for transport related problems (GIS-T) is another application where fast parallel traffic assignment analysis, like the one described above, can be used. Network analysis then often leads to repeated solutions of traffic assignment problems. This is, for example, the case in sensitivity analysis, where the effects of various changes in the network infrastructure are analysed. Typical changes of a network include modified or new links. Modified links may, in particular, affect the volume delay function to be used. The effect of modified O D matrices, for example by new suburban areas, can also be studied by this kind of analysis.
Another important reason for using GIS in network analysis, is the possibility to graphically
show network ows on a map. The thickness of lines for network links can, for example, be
made proportional to the corresponding flows. Also different colours can be used. The Emme/2 software has built-in capabilities of this type. Graphics is useful both for general presentations and for validation of computed results. Like in many other applications, GIS is an invaluable tool for data validation.
VTI is currently developing an interface for TransCAD on standard personal computers, to facilitate the use of parallel computers for efficient solution of traffic assignment problems. By using such an extreme computer resource for the numerical computations, it is possible to interactively make changes in the network or in the 0-D matrix, and then automatically let the parallel machine solve the new traffic assignment problem. The software implementation is
thus made in such a way that the user not even notice that another computer than the desktop machine is used. Figure 4 illustrates the idea.
iranscad
r:? &
=???
Parallel computer
Figure 4. GIS application od the real time traffic assignment analysis.The parallel traffic assignment algorithm has been implemented on a Parsytec GC/PP com puter with 128 processors, located at the University in Linköping. For the communication between the personal computer running TransCAD and the parallel computer we use an Inter-net connection.
The Swedish National Road Administration is involved in an extensive project (ARENA) for development and testing of new technologies, including GIS like tools, for traffic control. The overall project deals with control and management tools for applications in the following
fields: Roads, Traffic, Winter roads and Traffic safety.
In the first field (roads) the ARENA project is concerned with the development of tools and
routines for driver information. The idea is to offer information to the road-users about, for
example, delays, accidents and traffic restrictions. An important and difficult problem is to select exclusively the information relevant for each individual driver. Information about traffic accidents should, for example, only be sent to cars that might be affected. In the second field (traffic) the interest is focused on applications using new information technology. One exam ple is the development of intelligent automatic cruise controls, that automatically set speed with respect to surrounding conditions, including the shape of the road, speed limits and other traffic. Another type of intelligent automatic cruise controls instead chooses speed with re-spect to traffic lights. The equipment communicates with the light system and computes a speed that constantly can be held without stops.
Winter roads and traffic safety is, finally, two fields with a closer connection to GIS. An im portant problem in countries like Sweden, is to keep roads open and safe even in winter time. This is made by both keeping the roads clear of snow and by preventing slipperiness by spreading salt. Geographical information systems with digital maps, recent weather observa
tions (temperature, humidity, wind, rain/snow), weather forecast and information about the
status of the roads (mainly their temperature) can then be used as an efficient and useful tool. One object is to use available staff and vehicles in an optimal way, but also to predict where problems may occur. Appropriate steps can then be taken to prevent problems.
4. Regional car ownership
The number of private cars and the number of people having access to car3 are variables of significant importance in the prediction of future travelling and peoples future choice of trans port modes. The observed historical increase in car ownership has been the same in Sweden as in many other western countries. Figure 5 shows the number of cars per head of the population in Sweden since 1923. The current car ownership has a strong regional variation. In Stock-holm and Gothenburg there are less then 0,3 cars per capita, while the corresponding number in the sparsely populated regions in the north is more than 0,5. The average number in Sweden
is about 0,40.
Car ownership in Sweden 0.45 0.4 0.35 .O N .0 m 0) F3 m Ca rs pe r ca pi ta 0.15 0.1 0.05 0 1920 1930 1940 1950 1960 1970 1980 1990 2000 Year
Figure 5. Number of cars per capita in Sweden 1923 1993.
The most important component in the current trend is that women increase their ownership, while men stay at a rather constant level. Much of the expected future increase in car owner ship can therefore be explained by a diffusion process, reducing the current difference in own ership between men and women. Another important component, also leading to a higher total ownership, is a gradually changed attitude to cars and car ownership. In particular the group of men and women in the higher ages tend to increase their car ownership.
VTI has developed a forecasting model for regional car ownership in Sweden. It is based on non linear regression models for individuals entry and exit propensities to and from car own ership. Le. the probability an,/, that a person without car during the year becomes car owner, and the probability Bmk that a car owner during the year leaves ownership. Here, n denotes the year and k the age of the person. Different models are used for men and women. Let ymk de note the number of car owners of age k (year n) and ka the corresponding total population. The following recursive mathematical relation then holds:
yn,k : yn 1,k 1 + an,/c (Tn,k _ yn 1,k l) IBM 'yn 1,k 1- (1)
Here, the first term is the number of car owners at the beginning of year n. The next two terms express the number of new car owners and the number of car owners leaving ownership, re spectively, during the year n. In Figure 7 we give the typical shape of the entry and exit pro pensity curves.
The non linear regressions models for entry and exit propensities include individual variables such as birth year, age, sex and income, but also general variables like the petrol price and the national economic growth. An important problem is to handle the fact that the car ownership
over time automatically tends to increase due to a higher percentage of the population having driving licence. Also the gradually changed attitudes to car ownership plays, as mentioned above, an important role. This means, in particular, that women and people in the higher age
Entry propensity Exitpropensity 0.4 0.8 0.3 0.6 0.2 5 --- 0.5 0.2 __ 0.4 0.1 5 0.3 O 1 ... ?...-" ... 0 2 0 O 5 -- 0 1 o0 5 O """" 1 O O oO 5 O 1 0 O A g e A g 9
Figure 7. Entry and exit propensities for men (solid line) and women (dashed line).
groups over time increase their car ownership relatively faster then the remaining population. This undergoing process works until the diffusion converges at a certain saturation level. In the model, we handle this effect by introducing a variable Tn, defined as the percentage of the population (year n) that in year 1968 was at most 18 years old. For this group of the popula tion, the car ownership is assumed not to be reduced due to their age. The estimated values of
T,, approximately follows an exponential function with the asymptotic value of 1. This value is in practice reach in 2020. Before that, the factor Tn reduces the car ownership that otherwise would have been expected. The important difference in car ownership between men and women is handled by the use of separate models.
The regional approach now used is to divide the country into seven separate B regions, and for each of them use different submodels. The B-regions are defined by a classification of the municipalities, making those with similar population density, distance to larger cities and standard of public transports grouped together. Municipalities in a fixed B-region therefore not need to be connected. The definition instead aims to make the B-regions homogenous in terms of the above conditions. In this way, we do not need to explicitly include important structural variables, like the access to public transports, in the models. This would otherwise be necessary in a regional model like the one presented here. The apparent regional differ-ences in car ownership mentioned above, are mainly explained by structural differdiffer-ences and peoples real possibility to desist from private car.
To estimate future regional car ownership, we run the submodels on each of the almost 300 municipalities (in different B regions) of Sweden. In this way, we determine the entry and exit propensities for men and women in ages from 17 year. Starting from a detailed description of the population and their car ownership, for men and women in the above ages, we recursively step forward year by year following the mathematical relation (1) stated above. For each year, this leads to an estimate of the car ownership. The sum of car owners for men and women in the considered ages gives the total number of owners. Conversion to the number of cars is then made by a separate model.
From the resulting forecast of cars in the municipalities, we disaggregate the estimates to SAMS areas within the municipalities. This is made by a regionalization procedure based on changes in the car ownership. A simplified approach is obtained by assuming a fix relative
change in all SAMS areas. Different age and sex profiles in the SAMS areas makes, however,
such an approach less useful. Instead we compute an ownership potential for each SAMS area. It gives a simple estimate of the number of car owners, with respect taken to the age and sex distribution of the population. Regionalization can then be made by considering changes in these potential values.
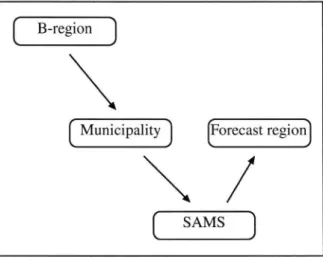
So far, three different geographical levels have been used: B regions, municipalities and SAMS areas. Now we introduce a forth level. The car ownership is, as already mentioned, an important input variable in the estimation of future travelling and peoples choice of transport modes. The forecast regions used in these models are formed by the exact merging of typically 5-10 SAMS areas. Input variables are thus obtained by the aggregation of data and results from the SAMS level. Figure 8 shows the relation and data conversions made between the four considered geographical levels.
[ B region j
[ Municipality J Forecast region]
\
[ SAMS ]
Figure 8. Geographical levels used in the car model.
The above project is now extended to cover the complete car market. We consider and analyse
the whole market, including the introduction of new cars, the second hand market and the
fi-nal destruction, as a dynamic system. A deeper insight and understanding for the involved ows and forces would increase the precision in future forecasts, and also make it possible to predict, for example, the age distribution of future car eets. Figure 9 shows the considered
ows within the car market. The second hand market is in itself a complex dynamic system.
/
|Deregistrated l >i
\
\ : /
Second hand
Figure 9. The car market as a dynamic system.
GIS has been used for many purposes in the described car project. Below we brie y mention some particular examples:
Definition of B-regions. The B regions are defined by the merging of municipalities. Different precise criteria have been tested and implemented using GIS. One such definition is to make a classification with respect to the current ownership. Another alternative is to classify munici
palities from a computed value expressing peoples need of car. Such a measure should include the size and population of surrounding cities.
Aggregation of data. The car model gives estimates of the number of cars on the SAMS level. We use GIS to aggregate data to the forecast regions used in models where the computed val ues serve as input data.
Validation of results. We have emphasized the importance of using GIS for validation of data. This is particularly useful when different models are compared and new results computed. In a GIS we compared the estimated number of cars with other related socio-economic data. Ex-treme values in, for example, the number of cars per capita can in this way be revealed. Also geographical patterns can be identified similarly.
5. Long term national traffic planning
National investments in infrastructure (roads, railway etc.) are preceded by extensive analysis and evaluation. It is, in particular, important to estimate and compare the outcome of different investment alternatives. The effect analysis should include possible improvements of capacity, shorter travelling times and redistribution of traffic flows within the regional network. How ever, also other effects, including environmental and traffic safety issues, play an import role and should be considered. For this purpose many models and tools, closely related to GIS, have been developed. In this section, we describe some of these tools and their relation to each other. We first concentrate on the estimation of future traffic ows and expected use of new and existing infrastructure. Then also the other part, including environmental and safety as-pects, is brie y considered.
Sweden has a long tradition of using advanced models and methods for long term traffic plan ning. The tools now used for modelling personal trips have during the years been developed and improved in many steps. Today we have one of the most advanced systems in the world that is in practical use. An important explanation is probably that there has been a rather short step from the development and research on new models to their implementation for opera tional use.
Traditional models for long term traffic planning, predicting future demand for travelling and use of infrastructure, are based on a four step approach. Such models first determine O D ma trices for the considered transport modes (car, train, bus etc.). The type of network analysis described in Section 3 is then used to predict resulting link ows and use of infrastructure. In the following structural description of the approach, the first three steps correspond to O-D matrix estimation and the last step to the network analysis. The different steps of the model determine:
1. whether to take a trip 2. by which transport mode 3. to what destination 4. by which route
Figure 10 illustrates how the above four step procedure has been implemented for long-term traffic planning in Sweden.
The described models assume that the country or the considered part of the country has been divided into a number forecast regions; each corresponding to a row and column in the O-D matrix to be determined. The total number of regions, and their sizes, determines the precision and accuracy that can be expected. It should be emphasized that only trips between the differ
ent regions are captured by the model. More detailed local models must be used to analyse network flows within the different regions. It follows that separate models naturally are used for predicting shorter regional and longer interregional trips. Sweden has for this purpose been divided into 668 regions for the modelling of long trips. Regional trips (one way trips less than 100 kilometres) are modelled using five separate forecast regions; each divided into more than 1000 smaller parts.
[Demographic data)
[ Car ownership J (Existing infrastructure)
Models for Models for regional trips long trips (> lOOkm)
Distribution of
trips on network
links
Figure 10. Submodels used in long-term traffic planning.
The two models for regional and interregional trips correspond to the first three steps in the four step procedure presented above. For each forecast region, the model first determine how often people travel. This is mainly explained by peoples access to services and by various
so-cio economic variables, such as age, sex and income. Services include shops, banks and other
facilities that may attract people and generate trips. From empirical data it is clear that con venient access to services increase the frequency of trips, and vice versa.
What transport modes people choose are essentially determined by the cost and travelling time for the different alternatives. Notice that the travelling time includes, possibly under different weights, all parts of the total time, including queuing and transports to bus stops etc. Of sig nificant importance is, of course, also the set of transport modes that people really have access to. Although access to car also influences on how often people travel, it is for the choice of transport modes that access to car indeed in an important variable. The car model presented in the previous section is used to estimate related variables.
Where people are going is determined by the surrounding attracting facilities (services, em ployers and recreations areas etc.). A lot of research have been made on models for estimating O D matrices. An often used method is to assume that the number of trips between two areas with population p1 and pg, respectively, is proportional to the gravity measure p1 - p2 / re. Here, r denotes the distance between the midpoints of the two areas and 0 is a predefined pa rameter. O-D matrices are also estimated by logit models.
The model for long trips (more than 100 kilometres one way) consists of two submodels; one for private trips and one for business travelling. They both lead to estimated OD matrices that can be added to get an estimate of the total travelling. Considered transport modes are flight,
train, car and bus. The model coefficients have been estimated from a nation wide survey of
travel patterns. Regional trips are in a similar way analysed using five different regional mod els. The considered transport modes are then private car, public transports, bicycle and walk-ing.
The fourth step, corresponding to network analysis of the estimated O D matrices, is imple mented by the software package Emme/2. It is a frequently used package that performs the kind of analysis described in Section 2. It also has some capabilities for graphical presenta-tions of results.
Possible investments in new infrastructure are evaluated in a careful analysis, where gains in terms of accidents, travelling times, environmental effects etc. are estimated. This is made by computing the total monetary value associated with the considered investment alternatives. The resulting values are then compared with the corresponding values for the existing infra structure and with alternative investment plans.
It should be clear that the described planning and forecasting process contains many tasks suitable for GIS. An obvious improvement is obtained by building a GIS platform that simply combines the different parts of the process into a single tool. Useful possibilities for graphical presentation is then directly obtained. A more dramatic improvement can be achieved if new tools and data are introduced. It would then be possible to, for example, get a more detailed description of environmental effects.
6. Concluding remarks
In this paper, we have discussed the use of GIS in some specific traffic applications. The in-troduction of GIS is now going on, and it is likely that much will happen during the next 5 10 years. So far, geographical information systems have mostly been used for graphical presenta-tions of spatial data, where the standard high quality software packages successfully can be used. The more advanced applications, however, require more complex software and may also require user developed extensions. Many of the advanced software packages can be improved; both in terms of functionality and their user interfaces. Related to the question of software is the data issue. It is clear that the often experienced lack of digital data delays the introduction and full use of GIS.
When the basic need for data is satisfied, it is clear that GIS can solve many previously un-solved problems. This is, for example, the case in environmental computations where new knowledge can be obtained from the analysis of complex data relations in a GIS. Another ex ample is the rather detailed geographical distribution of pollution that brie y was described in the first section. It is our experience that GIS defines a unique tool for graphical presentation of spatial data, geographical analysis by spatial operations and organisation of spatial data. In this paper, we have used the common definition where a GIS is considered as an environ ment of hardware, software and digital data, allowing analysis and presentation of spatial data.
It is, however, important to emphasize that GIS can be much more. We then, for example,
think of interesting applications where GIS is combined with modern information technology. GIS has, for example in traffic control, successfully been used together with GPS. Another example is the described use of real time traffic assignment analysis for traffic management in cities having congestion problems.