http://www.diva-portal.org
This is the published version of a paper presented at 10th International Conference on
Applied Energy (ICAE2018), 22-25 August 2018, Hong Kong, China.
Citation for the original published paper:
Song, J., Wallin, F., Li, H. (2019)
Effectiveness of introducing heat storage to repress cost increase
In: (pp. 4344-4349).
Energy Procedia
https://doi.org/10.1016/j.egypro.2019.01.786
N.B. When citing this work, cite the original published paper.
Permanent link to this version:
ScienceDirect
Energy Procedia 00 (2018) 000–000www.elsevier.com/locate/procedia
1876-6102 Copyright © 2018 Elsevier Ltd. All rights reserved.
Selection and peer-review under responsibility of the scientific committee of the 10th International Conference on Applied Energy (ICAE2018).
10
thInternational Conference on Applied Energy (ICAE2018), 22-25 August 2018, Hong Kong,
China
Effectiveness of introducing heat storage to repress cost increase
Jingjing Song
a,b*, Fredrik Wallin
a, Hailong Li
a†
aMälardalen University, Västerås 721 23, SwedenbMälarenergi AB, Västerås 721 03, Sweden
Abstract
To promote the applications of energy conservation measures that benefit the system efficiency, District heating companies have been adapting their price models. One way is to introduce a peak demand component in the price model, which has been proved to be effective to reduce the peak demand. Whereas, this approach can result in a significant cost increase for users with high peak demand. Installing energy storage on the demand side is a potential way to save the cost. In order to understand how the energy storage could change the users’ cost and help district heating users to make informed decision, this study analyses the economic benefits of demand-side heat storage. Five types of buildings are considered here: multifamily house, commercial building, hospital and social services, industrial building, and office and school. By doing analysis regarding the users which costs increase mostly, it can be concluded thatheat storage could efficiently repress the cost increase, and all the investments will be paid back within 3 years, which means introducing heat storage is an efficient measure for cost saving under the circumstances.
Copyright © 2018 Elsevier Ltd. All rights reserved.
Selection and peer-review under responsibility of the scientific committee of the 10th International Conference on Applied Energy (ICAE2018).
Keywords: District heating; price model trannsition; energy storage; peak shifting; optimization.
* Corresponding author. Jingjing Song, Tel.: +46-760-839-741. E-mail address: jingjing.song@mdh.se
* Corresponding author. Hailong Li, Tel.: +46-21 10 31 59. E-mail address: hailong.li@mdh.se
2 Author name / Energy Procedia 00 (2018) 000–000
1. Introduction
District heating (DH) is the most common way to supply heat to both multi-dwelling and non-residential buildings, totally accounting for 55% of the heating market in Sweden [1]. The penetration of renewable resources has significantly changed the structure of fuel used in DH system [2], and inevitably changed the production cost. Nevertheless, the conventional price models suit the fossil fuel dominated structure better. To resolve this conflict, new and more comprehensive price models are needed to reflect the new cost structure.
Moreover, the application of energy conservation measures (ECMs) is changing the heat demand in the building sector, which might create problem for DH systems. According to [3], not all ECMs lead to higher energy efficiency and lower emissions in DH system. Hence DH companies need to adapt the price models in order to encourage ECMs that increase efficiency and reduce emission, and discourage ECMs which have the opposite effect.
In the recent years, some big DH companies have started to restructure their price models and introduce peak demand component, which can significantly increase the costs of users whose peak demand is very high [4]. The significantly increased cost motivates users to take action to alleviate the cost increase. Installing thermal energy storage (TES) on demand-side is one of the measures that can effectively lower users’ peak consumption, but it has been less considered in energy efficient projects, since it cannot reduce the total energy consumption.
The purpose of this study is to investigate the effectiveness of introducing demand-side TES to repress the cost increase caused by restructured price models, and provide guidelines for the most affected DH users to make informed decision.
2. Method
This study mainly focuses on the most affected DH users. Based on the result of our previous study [4], five DH users from different types of buildings are selected based on the fact that their costs increase the most in their type after introducing the restructured models. The hourly consumption data in a normal year is used when evaluating the benefit. As the consumption profile is clearly influenced by the capacity of TES, and the operation strategy of TES, the TES capacity is optimized to minimize the annual cost, consisting of district heating cost and investment cost.
2.1 Cost of district heating
Based on the price model survey in [5], two price models are included in this work as the reference model and restructured model. The DH cost before and after introducing heat storage is calculated by using each price model:
Reference model (RM 0) is the most commonly used price model among DH companies, the cost depends only
on the annual consumption.
𝐸=𝑃𝑒𝑛𝑒𝑟𝑔𝑦 × 𝐶 + 𝑃peak × 𝐶/𝑘 (1)
E: The district heating cost of a user, SEK. Penergy: Energy price, SEK/kWh.
C: Customer’s annual district heating consumption, kWh. Ppeak: Peak demand price, SEK/kW.
k: Assigned consumption hours, hour.
Restructured model (RM I) is a seasonal model, it differentiates the consumption during winter and summer
seasons. The cost depends not only on how much energy is consumed in summer and winter seasons, but also on the peak demand of the year.
𝐸=𝑃𝑒𝑛𝑒𝑟𝑔𝑦.w×𝐶w+𝑃𝑒𝑛𝑒𝑟𝑔𝑦.s×𝐶s+𝑃peak×𝐿𝑝𝑒𝑎𝑘
(2)
Penergy.w: Energy price during winter season (Jan ~ Apr & Oct ~ Dec), SEK/kWh. Penergy.s: Energy price during summer season (May ~ Sep), SEK/kWh.
Cw: User’s winter district heating consumption, kWh. Cs: User’s summer district heating consumption, kWh.
Ppeak: Peak demand price, SEK/kW.
L
peak: User’s peak demand, kW.
The price levels of both models could be found in Table 1.
Table 1. Price levels of different models Reference model (RM 0)
Energy price 0.422 SEK/kWh Peak demand price 361 SEK/kW Restructured model I (RM I)
Energy price summer 0.253 SEK / kWh Energy price winter 0.455 SEK / kWh
Peak demand price 437 SEK/kW
2.2 Thermal energy storage
Hot water storage is a cost-effective option to store thermal energy [6]. The efficient operation of TES requires accurate weather forecast and correct prediction of heat consumption which is hard to be achieved for a long term. Combining with the limited space for TES in existing buildings, only short-term (48 hours) storage is considered here, Table 2 gives the parameters of TES in the calculation.
Table 2. Parameters of thermal energy storage
Medium Water
Working temperature 40°C ~90 °C
Efficiency 80%
Investment cost 150 SEK / kWh [7] Interest of capital 5% per year
Life-span 20 years Investment annuity 150 × 105%
20
20 ≈ 20 SEK/kWh ∙ year
4 Author name / Energy Procedia 00 (2018) 000–000
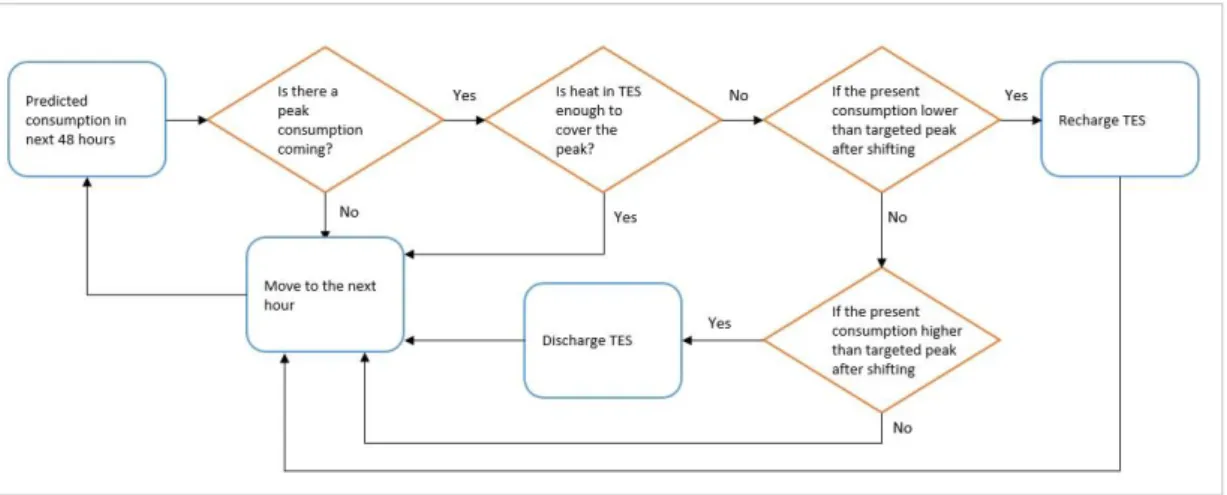
The strategy of storage operation is to store the heat needed in the next 48 hours when the demand is not very high. The decision-making process is illustrated in Figure 1: according to the predicted consumption in the next 48 hours, when there is a predicted peak, TES system will start to store heat, depending on the availability of excess heat, which is checked every hour. In this way, the short-term TES can shift just enough amount of energy to even out the peak demand, without unnecessary losses due to storage efficiency.
2.3 Cost optimization
To optimize the size of TES, the following objective function, which is to minimize the annual cost of users who install demand-side TES within DH, is used:
min (Eannual)=min(EDH+ ATES×CTES) (3)
Eannual: annual cost of DH combined with TES, SEK. EDH: cost of DH, function of consumption series, SEK.
ATES: annuity of TES, calculated using fixed-rate depreciation method SEK/kWh ∙ year. CTES: capacity of TES, kWh.
Fig. 2. The consumption peak (orange area) need to be stored in the valley of consumption (grey area).
Figure 2 shows both the individual user’s consumption profile and the targeted peak level. It is clear that only a certain amount of heat (grey area) can be stored in TES and used to cover the following consumption peak (orange area). The peak consumption could be reduced to the targeted level only when the grey area equals to or larger than the orange area. If the targeted peak level is lower than a certain level when the grey area is smaller than orange area, there is physically not possible to store enough energy to cover the following peak, and the peak reduction could not be achieved.
The capacity of TES should be no larger than the grey area when it equals to orange area, since a larger capacity could not further reduce the peak but results in a higher investment cost. This capacity limit is determined by each DH user’s consumption profile and set up the boundary for the TES capacity. The capacity of TES within this boundary which leads to minimum annual costs is selected as the optimized capacity.
2.4 Pay-back period
After finding the optimized TES capacity, the investment cost can be calculated. The discounted pay-back period is based on zero net present value method. (Eq. 4).
𝐷𝑃𝑃 = 𝑎 + |𝐼𝑇𝐸𝑆+∑ 𝐸𝑠𝑎𝑣𝑒𝑑 (1+𝑟)𝑛 ⁄ 𝑎 𝑛=1 𝐸𝑠𝑎𝑣𝑒𝑑 (1+𝑟)𝑎 ⁄ | (4) DPP: discounted pay-back period.
ITES: initial investment cost, in the context of cash flow, this is a negative value.
Esaved: saved DH cost with TES in each year, here assumes the cost saving each year remains unchanged. r: discount rate, here the same interest rate as in the TES parameters is used.
3. Results
The cost increase of the five selected DH users is listed in table 3. It is clear that after introducing restructured model, User 801 and User 470 experienced the largest and smallest increases in DH costs respectively.
Table 3. Cost increase of selected DH users.
User Type Cost increase in %
470 Multi-family house 22.1%
556 Commercial building 92.8%
683 Hospital & social services 34.7%
714 Industry building 100.3%
801 Office & school 356.2%
3.1 Effectiveness of peak-shifting
The consumption peak and total consumption with and without TES for selected user could be found in Table 4. Using User 714 as an example, the duration curve of DH consumption with and without TES is demonstrated in Fig 3. This shows that TES can significantly lower the peak consumption, but slightly increase the total consumption, due to the efficiency of TES.
Table 4. Consumption peak and total consumption with and without thermal energy storage.
User Peak without TES (kW)
Peak with TES (kW) Total consumption without TES (MWh) Total consumption with TES (MWh) 470 1880 830 2826.8 2827.8 556 82 40 44.5 44.6 683 160 70 167.7 167.8 714 730 180 385.2 392.7 801 28 20 4.9 4.9
Fig. 3. The duration curve of district heating consumption with and without thermal energy storage, case of user 714.
0 200 400 600 800 Con su m p tio n (kWh )
Without TES With TES
1000 2000 3000 4000 5000 6000 7000 8000 Hours
6 Author name / Energy Procedia 00 (2018) 000–000 3.2 Effectiveness of repress cost increase and payback time
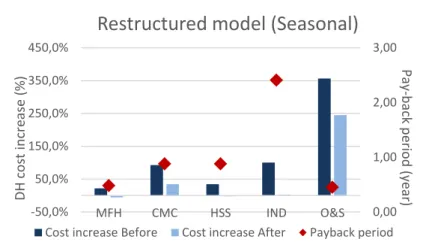
The cost increase before and after introducing TES is illustrated in Fig 4. After introducing TES, the cost increase is overturned for multi-family house (MFH) and hospital and social services (HSS) building: the annual DH costs were reduced by 5.8 % and 2.5% respectively for MFH and HSS buildings. For commercial building (CMC), and industry building (IND), introducing TES lowers the cost increase of both users to 35 % and 3%. The cost of office and school building (O&S) increases the most before installing TES, by 350%. Introducing TES could cut 30% of the cost increase. The pay-back period of all selected users could also be found in Fig 4. All pay-back period results are under 2.5 years
Fig. 4. The cost increase before and after introducing TES, and the pay-back period of TES.
4. Conclusion & Discussion
The introduction of peak demand component in the price models results in a significant increase of DH cost for some users. This work evaluated the impact of installing a thermal energy storage on the demand side on the users’ cost. Based on the optimization of thermal energy storage, the following conclusions can be drawn:
1. Thermal energy storage is an effective way to even out the peak consumption though it simultaneously increases the total DH consumption. Hence it can effectively repress the cost increase caused by implementing peak demand component.
2. Using hot water storage, the payback period is less than 3 years for different types of users.
Acknowledgements
The work has been carried out under the auspices of the industrial post-graduate school REESBE, which is financed by the Knowledge Foundation (KK-stiftelsen).
References
[1]District heating and cooling in Sweden. Werner, Sven. 2017, Energy, pp. 419-429.
[2] Statistics Sweden. Electricity supply, district heating and supply of natural gas 2015, SCB, 2016.
[3] Lundström, Lukas. Heat demand profiles of energy conservation measures in buildings and their impact on a district heating system. Applied Energy. 2016, Vol. 161.
[4] Song, Jingjing. District heating cost fluctuation caused by price model shift. Applied Energy. 2017, Vol. 194. [5] Song, Jingjing, et al. Price models of district heating in Sweden. Energy Procedia, 2015
[6]Sarbu, Ioan et al. A Comprehensive Review of Thermal Energy Storage. Sustainability. 2018.
[7] European Association for Storage of Energy; European Energy Research Alliance. European energy storage technology development roadmap. Brussels, 2017. 0,00 1,00 2,00 3,00 -50,0% 50,0% 150,0% 250,0% 350,0% 450,0% MFH CMC HSS IND O&S Pa y-b ack p eriod (y ear ) DH cos t in cre ase (% )