SKI Report 2005:59
Research
Reactive-Transport Model of Buffer
Cementation
Randy Arthur
Wei Zhou
October 2005
ISSN 1104–1374 ISRN SKI-R-05/59-SESKI Perspective
Background
The buffer in a KBS-3 type repository will initially be exposed to moderately elevated
temperatures (< 100°C), especially near the canister surface. The extent of this thermal period is limited (~1000 years), since the magnitude of the thermal gradient across the buffer will diminish with the gradually decreasing amount of decay heat from the fuel. Because
thermodynamic and kinetic properties of mineral phases within the buffer exhibit temperature dependencies, a redistribution of mineral phases (dissolution/precipitation/transformation) can be expected due to the thermal gradient. For example, experiments show that silicon is
leached out near the hot end of the buffer and is then precipitated near the cold end.
Conversely, phases exhibiting retrograde solubility dependence such as gypsum and anhydrite may precipitate near the hot end. This precipitation/dissolution may to some extent affect the mechanical properties of the buffer. It needs to be addressed whether this alternation can be disregarded or whether it has to be explicitly accounted for in safety assessment.
Purpose of the project
The purpose of this project is a preliminary evaluation of the degree of mineral redistribution within a buffer during the thermal phase. This report summarises THC-modelling using the reactive transport code TOUGHREACT.
Results
The results indicate that mineral transformation that will take place due to the thermal gradient across the buffer, are likely to be quite small. This can be related to the magnitude and duration of the thermal gradient relevant for the KBS-3 design. In spite of this, it is not clear that the influence of the thermal alteration can be disregarded, since extent of mineral redistribution has not been correlated with change in physical, mechanical and rheological properties of the buffer.
Future work
The MC-couplings between buffer properties and extent of buffer mineralogical change have to be addressed through e.g. laboratory experiments or natural analogue studies.
Project Information
SKI Project Manager: Bo Strömberg Project Identification Number: 200509078
SKI Report 2005:59
Research
Reactive-Transport Model of Buffer
Cementation
Randy Arthur
Wei Zhou
Monitor Scientific LLC
3900 S. Wadsworth Blvd., Suite 555
Denver, CO 80235
USA
October 2005
This report concerns a study which has been conducted for the Swedish Nuclear Power Inspectorate (SKI). The conclusions and viewpoints presented in the report are those of the author/authors and do not
Summary
Thermal gradients during the early, non-isothermal period of near-field evolution in a KBS-3 repository for spent nuclear fuel could alter the mineralogy of the bentonite buffer and cause the constituent clay particles to become cemented together by mineral precipitates. Cementation is a potential concern because it could alter the ductility, mechanical strength and swelling pressure of the buffer, thereby possibly adversely affecting the primary performance function of this key barrier to provide a stable diffusional transport pathway between the canister and rock.
The present study uses the TOUGHREACT computer program to simulate reactive-transport processes that are thought to control buffer cementation. TOUGHREACT is generally applicable to problems involving non-isothermal, multiphase reactive transport in variably saturated media. For cementation problems, the modeling approach must account specifically for the temperature dependence of equilibrium and kinetic constraints on dissolution/precipitation reactions involving the primary smectite clays and accessory phases in bentonite, and for diffusive transport of aqueous reactants and products along concentration gradients that are aligned with, or in opposition to, the direction of decreasing temperatures across the near field.
The modeling approach was evaluated in two stages. A conceptual model of buffer cementation was first calibrated using observations from field tests carried out at the Stripa mine and Äspö HRL (LOT pilot experiments). The calibrated model was then used to simulate the geochemical evolution of the KBS-3 buffer during the non-isothermal period of repository evolution. This model accounts for the imbibition of groundwater from a granitic host rock into initially unsaturated buffer materials under capillary and hydraulic pressure gradients, and uses realistic time-temperature constraints on the thermal evolution of the near-field.
Preliminary results suggest that the total extent of mineral mass transfer, taken here as a qualitative measure of the potential for cementation to occur, may be quite small over the ≈1,000 year duration of non-isothermal conditions in the near field. Assessing the effects of such changes on buffer performance is problematic, however, because it is unclear how such mineralogical changes might affect the physical, mechanical and rheological properties of these materials. The results also suggest that the extent of any cementation will depend on the complex interplay between time, temperature and reaction rate, and that such effects may be as important during the waning stages of the non-isothermal period as they are initially. Cooling beyond the period of peak buffer temperatures is unlikely to completely reverse the effects of cementation generated before and after this period by minerals having retrograde solubilities.
We conclude that reactive-transport modeling is a useful tool that can help support future assessments of the potential impact of buffer cementation on repository performance. The present model should be revised to include more realistic thermodynamic constraints on heterogeneous reactions involving the smectite clays and other crystalline or amorphous reaction products, and the revised model should be further calibrated using results from the long-term LOT experiments and appropriate natural analogues. A defensible theoretical/empirical approach is needed to relate the nature and extent of mineralogical alterations controlling cementation to changes in physical and mechanical properties controlling buffer performance.
Table of Contents
Page 1 Introduction...1 2 Previous studies ...2 2.1 Laboratory experiments...2 2.2 Field experiments ...3 2.2.1 Stripa tests ...3 2.2.2 Äspö (LOT) tests...5 2.3 Natural analogues ...6 2.4 Numerical models...7 2.5 Summary ...8 3 Model evaluation ...9 3.1 Conceptual model...9 3.2 Model calibration ...11 3.2.1 Model description...11 3.2.2 Model parameters...11 3.2.3 Discussion of results ...14 3.2.4 Summary ...173.3 Base case model ...18
3.3.1 Thermal evolution of the near field...18
3.3.2 Geochemical evolution of the near field ...20
3.4 Sensitivity cases and scoping calculations ...22
3.4.1 Effects on resaturation...23
3.4.2 Effects on porosity ...24
3.4.3 Reversibility ...25
3.4.4 Reaction kinetics ...25
3.4.5 Mass-transfer resistance in the rock...27
4 Discussion of results ...29
4.1 Chemical-mechanical coupling ...29
4.2 Time-temperature constraints...29
4.3 Solute transport...30
5 Summary and recommendations...31
1 Introduction
The bentonite buffer in a KBS-3 repository for spent nuclear fuel will be subjected to a period of heating and cooling as radiogenic heat dissipates into the surrounding host rock. Heat conduction will set up temperature gradients between the relatively hot canister-buffer boundary and relatively cool buffer-rock boundary. The temperature gradients will in turn generate concentration gradients among aqueous solutes and gas species (i.e., when a gas phase is present during the initial, unsaturated period) because equilibrium and kinetic constraints on reactions involving buffer minerals and pore fluids are temperature dependent. Diffusional mass transport of aqueous ions and neutral species responding to the thermally induced concentration gradients may cause secondary minerals to precipitate onto the surfaces of the primary smectite clays. Should these complex, and possibly coupled, reactive-transport processes lead to significant mineral mass transfer, individual clay particles may become cemented together by the secondary solids. This is a potential concern because cementation could irreversibly alter the ductility, mechanical strength and swelling pressure of the buffer, thereby possibly adversely affecting the primary performance function of this EBS component to provide a stable diffusional transport pathway between the canister and rock (e.g., SKB, 1999a).
Evidence for buffer cementation comes from a variety of experimental, natural-analogue and modeling studies (see below). All the studies provide valuable insights concerning buffer cementation under KBS-3 conditions, but each also suffers from limitations imposed by the need to simplify. Thus, the available experimental studies tend to consider temperatures that are too high, temperature gradients that are too steep and durations (i.e., of non-isothermal conditions) that are too short relative to their expected KBS-3 counterparts. Natural analogues (e.g., igneous intrusions into argillaceous rocks) may involve time periods that are more relevant to KBS-3 conditions, but inferences drawn from such studies are often complicated by irreducible uncertainties in initial and boundary conditions. The available modeling studies tend either to ignore or to grossly simplify the equilibrium and kinetic properties of reactions involving the dominant smectite clays and potential secondary aluminosilicates.
To help overcome these limitations, the present study attempts to develop a more realistic basis for modeling reactive-transport processes controlling buffer cementation. The study has two general objectives: 1) to support future interpretations of relevant experimental and natural-analogue studies, and 2) to facilitate scoping analyses of the effects of heating and cooling on the mineralogy of bentonite buffers using realistic constraints on the time-temperature evolution of the KBS-3 near field.
This report is organized as follows. The experimental, natural-analogue and modeling studies referred to above are first briefly reviewed in Section 2. This is followed by a description of the modeling approach evaluated in this study. Key results are discussed in Section 4. The main conclusions and recommendations of this study are summarized in Section 5.
2 Previous
studies
This section provides an overview of previous work on the alteration of bentonites and other argillaceous materials exposed to high temperatures and thermal gradients. The discussion is divided among studies involving laboratory experiments, field experiments, natural analogues and numerical models.
2.1 Laboratory
experiments
Several investigations address the hydrothermal alteration of MX-80 bentonites under isothermal conditions (Pusch and Karnland, 1988; Pusch and Karnland, 1990; Pusch et al. 1992a; Pusch, 2000). A common experimental approach was used in these studies. This involves heating mixtures of bentonite and water (or water vapor) in closed-system autoclaves up to a specified temperature (in the range 60 - 225°C) for a fixed period of time (weeks to years) followed by cooling to room temperature. Results indicate that significant amounts of silica are released, apparently from tetrahedral sites in the smectite clays, when temperatures exceed about 150°C. On cooling, the released silica precipitates in the form of hydrous amorphous silica gels and/or cristobalite. An observed increase in the mechanical strength and brittleness of the altered bentonite is apparently due to precipitation of these silica polymorphs. Silica release and re-precipitation are negligible at temperatures less than about 90°C.
Fewer experimental studies address the hydrothermal alteration of bentonites under non-isothermal conditions. Cuevas et al. (1997) investigated the effects of simultaneous heating and hydration of a natural montmorillonite clay from Almeria, Spain. The clay was uniaxially compacted inside a cylindrical stainless steel cell (diameter = 15 cm; height = 14.6 cm) with an
initial dry density of 1.62 g cm-3 and initial water content of 11.2%. The cell was equipped with
an extraction piston enabling a constant pressure of 60 MPa to be continuously applied to the clay sample. Deionized water was injected at a pressure of 1 MPa into the sample through 2 hydration ports located at the bottom of the cell. A flat heater was positioned at the top of the cell, where the temperature was fixed at 100°C. A thermal steady state was achieved within 15 hours after heating commenced. Temperatures varied from 100°C at the top of the cell to 65°C at
the bottom, giving a linear temperature gradient of 2.8°C cm-1. The test lasted for 2619 hours.
Key results with regard to changes in mineralogy and physical properties of the clay are: 1) that trace amounts of salt impurities were rapidly solubilized and transported toward hotter regions of the clay, and 2) the distribution of exchangeable cations in the clay was altered with increasing
temperature in favor of Mg2+ at the expense of Na+. The authors do not report any other
discernable changes in the bulk mineralogy of the clay.
Poinssot et al. (1998a) [see also Poinssot et al. (1996a, b)] enclosed powdered nuclear waste glass between two layers of argillaceous buffer materials in a sealed gold tube filled with distilled water. The tube was placed in a cold-seal vessel and subjected to a thermal gradient (200-300°C at the hot end, room temperature at the cold end) for 100 days at 14 MPa. The
relevance of the experimental results to the present study is difficult to assess due to the presence of glass in the system, but Poinssot et al. (1998b) note that trends in elemental mass transfers are similar to those observed in field experiments at Stripa (see below), i.e., Ca, S and Mg are concentrated in solid phases at the hot end of the system, whereas Fe and Al are concentrated in solid phases at the cold end.
2.2 Field
experiments
2.2.1 Stripa tests
These experiments were designed to characterize the effects of heating on the physical, chemical and mineralogical properties of bentonite buffer materials emplaced in crystalline rock (Pusch et
al. 1992b, c). French Fo-Ca 7 bentonite, consisting of interlayered smectite/kaolinite and
kaolinite with minor amounts of quartz, feldspar, hematite, gypsum, pyrite and calcite, was used in these tests. Test parcels consisted of prefabricated bentonite blocks (calculated density ≈ 2000
kg m-3 at full water saturation) surrounding a steel canister (51 mm outer diameter) equipped
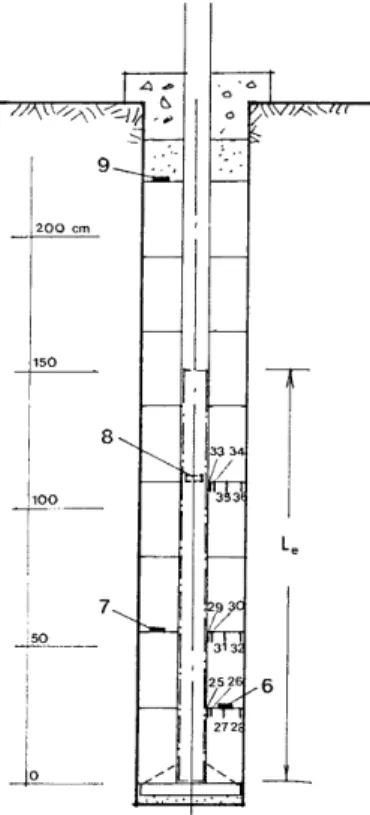
with an electrical heater (Figure 2.2.1_1). The parcels were emplaced in vertical boreholes (200 mm diameter; 2.8 m in length) located in the “Time Scale” drift (≈ 350 m below ground level) in the Stripa mine in central Sweden. The heaters maintained a constant temperature at the steel-buffer interface of about 170°C. The temperature at the steel-buffer-rock surface was about 80°C. The
Figure 2.2.1_1. Schematic diagram of the Stripa tests (from Pusch et al., 1992c). Le refers to the
effective length of the heater. Numbers indicate locations of pressure cells (6 - 9) and thermocouples (25 -36).
experiments were carried out in two separate boreholes: one for a period of 8 months, and the other for about 4 years. The parcels from both tests were recovered using overcoring techniques, and the mineralogy of bentonite samples was characterized using ICP-AES, XRD and SEM analyses. Bentonite porewaters were not sampled in this study.
Pusch et al. (1992b) report results for the 4 year test. Amorphous silica, and possibly also amorphous calcium silicates, were found to have precipitated throughout the clay annulus. The amounts precipitated were not determined quantitatively, but were observed to increase generally toward the hotter canister-buffer boundary (Figure 2.2.1_2). Amorphous silica was especially abundant over a region extending 6 - 8 mm into the bentonite from the canister surface, where
in-situ temperatures were inferred to have been between 150 and 180°C. Neoformed anhydrite was
also present in this zone, and the original dioctahedral smectite had been partially altered to a trioctahedral clay (saponite or stevensite). Bulk ICP-AES analyses indicated significant losses of Si and Al from this zone, and an increase in Ca, Mg and S. Pusch et al. (1992b) infer on the basis of comparisons of XRD patterns between altered and unaltered bentonite samples that the losses in Si and Al were due to dissolution of quartz, feldspars and kaolinite.
Pusch et al. (1992b, c) interpret these results as follows:
• dissolution of quartz, feldspars and kaolinite (and possibly also smectite) at the hot end of the buffer locally increased the concentrations of dissolved silica and Al in pore solutions, which caused these solutes to diffuse down the resulting concentration (and temperature) gradient toward the cold end. Amorphous silica (and possibly other amorphous solids) precipitated in response to changes in solution chemistry and temperature.
• dissolution of gypsum at the cold end of the buffer, and release of Mg from exchange sites in smectite, locally increased the concentrations of Ca, Mg and sulfate in pore solutions, which caused these solutes to diffuse down the resulting concentration gradient toward the hot end, where anhydrite precipitated due to its retrograde solubility.
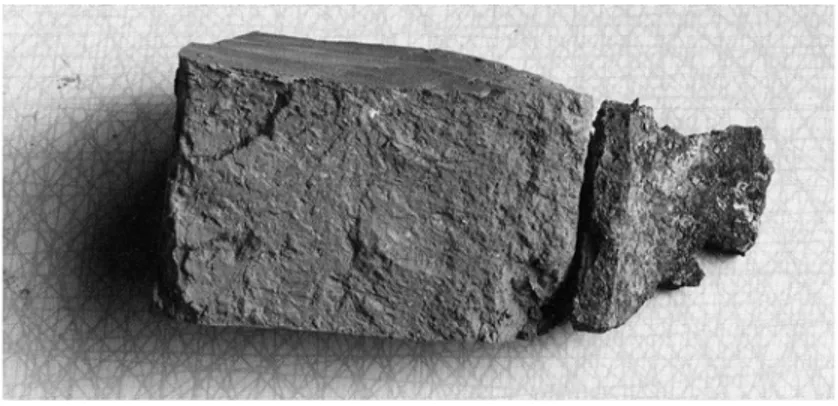
A key finding of the Stripa tests is that the entire thickness of the buffer had been cemented to some extent by precipitation of silica and anhydrite, and that this had significantly altered the
Figure 2.2.1_2. Photograph of altered Fo-Ca 7 clay from the Stripa tests. The darkened region to the right of the sample was nearest the canister.
rheological behavior of the clay. The ductility and swelling capacity of the strongly altered clay near the canister surface were completely lost, and the hydraulic conductivity had increased by three orders of magnitude. It should be emphasized, however, that the temperatures evaluated in these tests were considerably higher than those expected in the KBS-3 near field. It is therefore uncertain whether similar alteration of the KBS-3 buffer under expected near-field conditions (i.e., at lower temperatures but over longer periods of time) could occur.
2.2.2 Äspö (LOT) tests
The behavior of MX-80 bentonite when exposed to relatively high temperatures and moderate temperature gradients is being investigated in the “Long Term Test of Buffer Materials” (LOT) Project at the Äspö Hard Rock Laboratory (HRL) in southern Sweden. Two pilot experiments were completed in 1998 after a test period of 1 year (5 other longer-term experiments are currently underway). Karnland et al. (2000) describe these experiments and key results of laboratory testing. Results for the “S1” test are considered here because only pure MX-80 was used in this experiment (various mineral additives were used in the other pilot test to simulate
adverse conditions of high pH and elevated K+ concentrations in buffer porewaters).
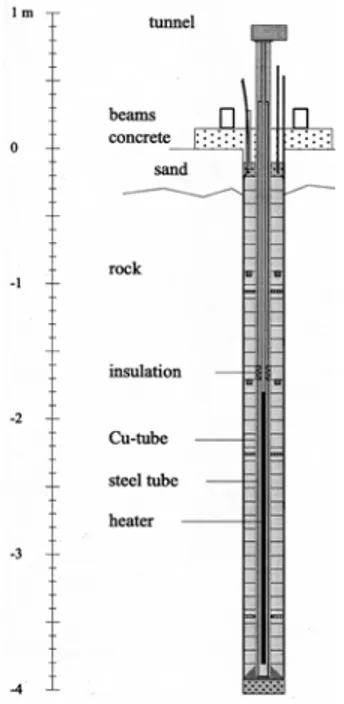
The S1 test parcel consisted of a central heater surrounded by a copper canister (54 mm outer diameter), which in turn was surrounded by 40 cylindrical rings of highly compacted bentonite (Figure 2.2.2_1). The parcel was installed in a vertical borehole (300 mm diameter and total depth of 4 m) core-drilled into the Äspö diorite from a point in the TBM tunnel located about 450 m below ground level. The final density of the bentonite, at full water-saturation and after
swelling in the borehole, was calculated to be 2000 kg m-3. The power output of the heater was
Figure 2.2.2_1. Schematic diagram of the LOT S1 pilot parcel (modified from Karnland et al., 2000).
set at 600 W to maintain a nearly constant temperature of 90°C at the surface of the Cu canister and 50°C at the rock surface. The parcel was instrumented with 25 thermocouples and several pressure gauges that were continuously monitored throughout the experiment. The experiment was terminated after approximately 1 year, and the complete parcel was recovered as one piece by overlapping core drilling. Samples of the recovered bentonite were subjected to a variety of analyses, including ICP-AES element analyses of total and clay fractions, XRD analyses of total and clay fractions and SEM analyses of microstructure and elemental compositions. Sampling and analysis of bentonite porewaters was not attempted.
Karnland et al. (2000) made the following observations based on their comparisons of XRD patterns in samples of S1 bentonite and a reference sample of unaltered material:
• no significant changes were observed in the mineralogy of accessory phases, except near the canister-bentonite boundary where gypsum and calcite contents increased significantly, and • a general tendency was noted for the basal spacing of montmorillonite to increase with
increasing distance from the bentonite-rock boundary, with the maximum increase (to 14.5 Å) occurring in samples nearest the canister-bentonite boundary.
Both observations suggest transport of Ca2+, SO42- and HCO3- ions toward the canister, where
gypsum and anhydrite precipitate because of their retrograde solubility, and Ca2+ exchanges for
Na+ in smectite (Karnland et al., 2000). Morphological evidence and element mapping using
SEM confirmed the presence of precipitated gypsum in bentonite near the canister surface. Karnland et al. (2000) could not draw definite conclusions from the ICP-AES analyses because the detected changes were small. Qualitatively, these changes apparently include:
• a reduction in the amount of Si from the hottest part of the parcel with a corresponding increase in Al and Mg.
• a small increase in the amount of Cu in samples closest to the Cu canister, and
• a general loss of S across the annulus cross section, with a profile of decreasing S content with increasing distance from the canister.
These mineralogical and compositional changes had no detectable effect on the density, hydraulic conductivity, swelling pressure, tensile strength and shear strength of the MX-80 test material.
2.3 Natural
analogues
Numerous studies of igneous intrusions into clay-rich rocks have been undertaken to help develop an understanding of the likely long-term effects of transient heating on the chemical, mineralogical, hydraulic and mechanical properties of buffer materials (e.g., Gera et al., 1996;
Metcalfe and Moore, 1998; Pusch et al., 1998; Pellegrini et al., 1999). The intrusive rocks were emplaced into these systems as magma, i.e., at temperatures much hotter than those expected in a KBS-3 repository. Considerable care is therefore required to accurately reconstruct paleotemperatures in these natural systems, and to relate associated changes in the chemical, mineralogical and mechanical properties of the host rock to analogous changes that could occur in the buffer. Other complications in interpreting data characterizing these natural analogues include the possible attendant effects of large-scale circulations of hydrothermal fluids associated with the intrusive event, mineralogical changes in the clay that post-date the temperature-induced changes, alterations associated with uplift and exhumation of the rock, and mass transfer between the intrusive rock and the clay-rich host.
When carefully interpreted, however, the results of natural analogue studies can provide important insights into the long-term behavior of buffer materials affected by heating. A key result of these studies is simply the observation that the impacts of past heating events are preserved in the rock for long periods of time. Although intrusion-emplacement temperatures are high, cooler zones that are more representative of temperature conditions in the near field can be identified in portions of the preserved alteration halo. At temperatures less than 100°C, changes in the chemical and mineralogical properties of the host rock are minor. Somewhat more pronounced changes are observed in the mechanical properties of the rock, including its strength, stiffness and plasticity. Increases in the permeability of the rock are also commonly observed, and may result from microcracking, or some other subtle change to the rock’s microstructure. At temperatures greater than 100°C, changes in the chemistry, mineralogy and mechanical properties of the host rock occur. The extent of these changes appears to depend on heating rates, the availability of water and the extent of mass transfer between the intrusion and host clay.
2.4 Numerical
models
Arcos et al. (2000) use a variety of solution techniques to model reactive-transport processes controlling the spatial and temporal distribution of bentonite accessory minerals (calcite, siderite, quartz and anhydrite) during the non-isothermal period in a KBS-3 repository. Quartz dissolution is assumed to be kinetically controlled whereas equilibrium is assumed for all other heterogeneous and homogeneous reactions. The smectite clays are treated as simple ion-exchangers having a fixed, but unspecified composition. The thermal evolution of the near field is approximated based on the analysis of Tarandi (1983), and the model explicitly accounts for the temperature dependence of most equilibrium and kinetic constants (the temperature dependence of the ion-exchange constants for smectite are unknown due to a paucity of relevant experimental data). Model results suggest that ion-exchange will control the distribution of accessory phases in bentonite, and that the extent of quartz dissolution/re-precipitation will be small during the non-isothermal period.
Arcos et al. (2003) apply the basic modeling approach developed by Arcos et al. (2000) to conditions representing the LOT experiments at the Äspö HRL (Section 2.2.2). Arcos et al. (2003) note that modeling results using this approach do not agree well in some cases with
observed results from the LOT experiments. These disagreements are attributed to uncertainties in initial conditions assumed in the models.
Arthur et al. (2003) use an object-oriented programming approach similar to that described by Arcos et al. (2000) to model reactive-transport processes during the non-isothermal period in a KBS-3 repository. Quartz and calcite were considered in this study as being representative of bentonite accessory phases having prograde and retrograde solubility behavior, respectively. Equilibrium was assumed for most reactions. Quartz dissolution was modeled using a kinetic expression. The thermal evolution of the near field was assumed to follow that modeled by Tarandi (1983), and the temperature dependence of all reactions was accounted for in the model. Results using this highly simplified model suggest that the extent of mineral mass transfer due to thermally induced reactive transport under non-isothermal conditions in the KBS-3 near field will be small.
2.5 Summary
The experimental and natural-analogue studies discussed above consider temperatures, thermal gradients and/or durations that do not closely match conditions expected in the KBS-3 near field during the non-isothermal period. The available modeling studies addressing buffer cementation under such conditions may also be overly simplistic because they do not account for the temperature-dependent solubilities, and reaction kinetics, of the dominant smectite clays. The KBS-3 design concept calls specifically for waste packages to be spaced far enough apart that a maximum temperature of about 85°C is reached at the canister surface about 10 years after deposition, at which time the temperature at the rock-buffer boundary will be about 55°C (e.g., Karnland et al., 2000). The corresponding temperature gradient, assuming a buffer thickness of
35 cm, is 0.9°C cm-1. Temperatures, and temperature gradients, then decrease continuously
across the buffer until the gradients vanish completely and temperatures fall to ambient values (15°C) between 1000 to 10,000 years post-deposition. In comparison, the thermal gradient in the
Stripa tests (Tmax = 170°C, Tmin = 80°C) was 6°C cm-1 for 4 years. Karnland et al. (2000) closely
match KBS-3 near-field temperatures and thermal gradients, but the LOT experiments completed thus far have been carried out for only one year (other tests in this series are planned for as long
as 20 years). Cuevas et al. (1997) evaluated a temperature gradient of ≈3°C cm-1 in their
laboratory tests for 0.3 years (Tmax = 100°C, Tmin = 65°C). Poinssot et al. (1998a) evaluated a
maximum temperature difference between the hot and cold ends of their experimental apparatus of 275°C for 100 days.
This generally poor correspondence between KBS-3 conditions and experimental conditions raises the question whether significant cementation could occur in the buffer if realistic near-field time-temperature histories, and more realistic models of bentonite-water interaction, are taken into account. This question is the main subject of the remainder of this report.
3 Model
evaluation
This section describes our evaluation of a reactive-transport model of buffer cementation using the TOUGHREACT code (Xu and Pruess, 2001; Xu et al., 2004). TOUGHREACT is a simulation program for non-isothermal, multiphase reactive transport in variably saturated porous media. It is applicable to one-, two- or three-dimensional problems, and can accommodate temperatures from 0 to 300°C, pressures from 0.1 MPa to several tens of MPa, liquid saturations between 0 and 1, and ionic strengths to 4 molal. The program uses a sequential iteration approach and implicit time-weighting scheme to solve the governing mass-transport equations independently for each chemical component, followed by Newton-Raphson iteration to solve the reaction equations. TOUGHREACT has been used in previous studies of natural hydrothermal systems (Ontoy et al., 2003; Dobson et al., 2003) and to model the effects of heating and cooling on tuffaceous host rocks in the proposed nuclear waste repository at Yucca Mountain, Nevada (Sonnenthal and Spycher, 2001; Spycher et al., 2003). The code is used here to help calibrate our model of buffer cementation and then to apply the calibrated model to realistic constraints on the time-temperature evolution of the KBS-3 near field.
3.1 Conceptual
model
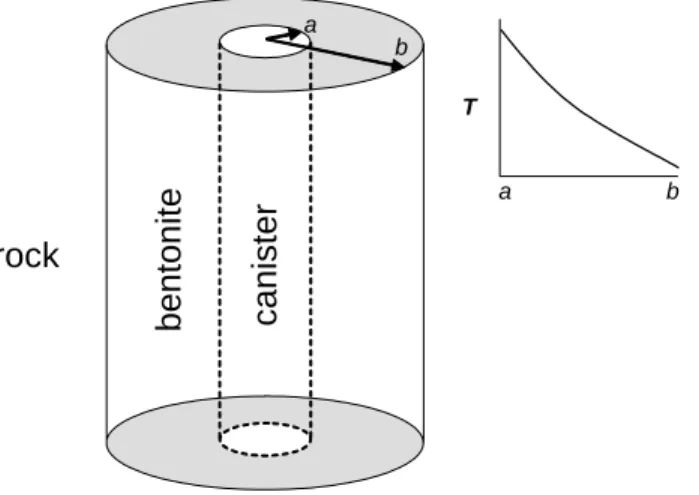
The model system is represented by the one-dimensional radial coordinate system shown in Figure 3.1_1. The inner surface of the buffer is in contact with the copper canister (r = a); the outer surface is in contact with the host rock (r = b). Mass-transport in the buffer is expected to be diffusion controlled because the permeability of this material will be extremely low under repository conditions (e.g., Pusch, 2001). The temperature gradient induces mass transfer among aqueous species and bentonite minerals, and the resultant change in solute concentrations drives diffusional mass transport.
canist e r benton it e rock a b T a b
Figure 3.1_1. Schematic view of the model system and temperature profile between the canister-bentonite boundary (a) and canister-bentonite-rock boundary (b).
These coupled processes are modeled using a mass-balance expression for aqueous species in multicomponent, multiphase systems (e.g., Lichtner, 1996):
r N r ir i i R C D t C r
∑
= = ∇ • ∇ − 1 ) ( ) (φ
ν
∂
φ
∂
(1)In this equation Ci denotes the concentration of the i-th species (mol l-1), D stands for the
diffusion coefficient (m2 s-1),
φ
refers to porosity,ν
ir denotes a stoichiometric coefficient for thei-th species in the r-th homogeneous or heterogeneous reaction and Nr denotes the number of
reactions.
For minerals, the transport term is absent and the mass conservation equation takes the following form: , 1 1 r N r mr m m R t V r
∑
= =ν
∂
∂φ
(2)where
φ
m stands for the volume fraction of the m-th mineral, V refers to the mineral’s molar mvolume (m3 mol-1),
ν
mr represents a stoichiometric coefficient for the mineral in the r-th reactionand Rr denotes the reaction rate (mol s-1).
The heterogeneous reaction rate is assumed to follow a rate law that is compatible with transition-state theory (e.g., Lasaga, 1998):
, 1 θr η r r r k s R =± −Ω (3)
where positive values refer to dissolution and negative values indicate precipitation. In this equation kr stands for the kinetic rate constant (mol m-2 s-1), sr refers to the reactive surface area
per unit volume of the medium, Ωr denotes the saturation index and
θ
andη
are dimensionlessquantities (it is usually assumed that
θ
=η
= 1). The saturation index is given by:r r r K Q = Ω (4)
where Qr represents the ion-activity product and Kr refers to the equilibrium constant.
The temperature- and pH-dependence of the rate constant is accounted for using an Arrhenius-type expression given by Xu et al. (2004):
z n H r z a z z r nu a nu r a T T R E k T T R E k k ⎥ + ⎦ ⎤ ⎢ ⎣ ⎡ ⎟⎟ ⎠ ⎞ ⎜⎜ ⎝ ⎛ − − + ⎥ ⎦ ⎤ ⎢ ⎣ ⎡ ⎟⎟ ⎠ ⎞ ⎜⎜ ⎝ ⎛ − − = exp 1 1
∑
exp 1 1 . (5)In this equation superscripts nu and z refer to reaction mechanisms under neutral and acidic or basic conditions, respectively, k stands for the rate constant at the reference temperature (Tr =
298.15°K), Ea represents the corresponding activation energy (J mol-1) and R, T and nz refer to
the gas constant (J mol-1 K-1), temperature (°K) and reaction order with respect to H+ activity,
respectively.
The transport and reaction terms in the system of Equations (1) and (2) are coupled through the relation:
∑
= − = min 1 1 M m mφ
φ
, (6)where Mmin refers to the total number of minerals in the system. Cumulative changes in the
volume fractions of minerals resulting from all dissolution and precipitation reactions thus affect solute transport through associated changes in porosity.
3.2 Model
calibration
Experimental results from the Stripa and Äspö field tests (Section 2.2) are used in this section to help develop and calibrate a working model of buffer cementation. Results of the laboratory tests described in Section 2.1 were not used in this effort because the available analytical data characterizing reactants and products are not sufficiently detailed. The model discussed below should be re-evaluated when results of the longer term LOT experiments become available.
3.2.1 Model description
The model system is based on that described in Section 3.1 (Figure 3.1_1). The bentonite annulus is divided into 20 computational nodes of equivalent radial width (0.745 cm for Stripa; 0.48 cm for Äspö). Mass-transport is diffusion controlled, the buffer is fully water saturated and temperatures at the canister-buffer and buffer-rock boundaries are fixed and unequal. Pressure is assumed to be hydrostatic throughout the model domain. A zero-flux boundary condition is assumed at the inner surface of the buffer (r = a), and an open boundary condition is assumed at the outer surface (r = b). Mass and energy are allowed to cross the latter boundary, and solute concentrations are thus permitted to change with time. Solute concentrations in the host rock are assumed to be time-invariant. This boundary condition is consistent with the much larger volume and greater mobility of the host-rock’s groundwater compared to buffer porewaters.
3.2.2 Model parameters
Table 3.2.2_1 lists initial and boundary conditions used in simulations of the Stripa and Äspö field tests. The physical and transport properties selected for MX-80 bentonite (Äspö) are from
Table 3.2.2_1. Initial/boundary conditions. Value Condition/property Stripa Äspö Canister radius (m) 0.051 0.054 Borehole radius (m) 0.20 0.15 Temperature (°C) Tbent, max1 170 97 Tbent, min2 76 50
Hydrostatic pressure (MPa) 3.5 4.5
Density (kg m-3) 2000 2000
Porosity (%) 41 41
Permeability (m2) 1.0e-22 1.0e-22
Tortuosity (bentonite) 0.2 0.2 Tortuosity (rock) 0.1 0.1 Thermal cond. (W m-1 °C-1) 1.3 1.3
Diffusion coeff. (m2 sec-1) 1.0e-9 1.0e-9
Water chemistry3,4
pH 9.0 7.7
Na+ 4.13e-3 9.13e-2
Ca2+ 1.30e-3 4.73e-2
Mg2+ 1.40e-4 1.73e-3
HCO3- 1.04e-4 1.64e-4
SO42- 5.50e-4 5.83e-3
Cl- 5.88e-3 1.78e-1
SiO2(aq) 7.31e-5 1.46e-4
AlO2- 1.0e-10 1.0e-10
1 - canister-buffer interface; 2 - buffer-rock interface; 3 - total analytical concentration (mol kg-1 H
2O).
4 - initial in both bentonite and rock.
Pusch (2001) and Karnland et al. (2000). These values are also assumed for Fo-Ca 7 clay (Stripa). Representative groundwater compositions are from Bruno et al. (1999) for the Äspö site, and from Pusch et al. (1992c) for the Stripa site. A pH of 9.0 is assumed in the latter case, and charge balance was established by adjusting the concentration of HCO3-. Figure 3.2.2_1
shows time-invariant temperature profiles in the Stripa and Äspö calibration models.
Table 3.2.2_2 summarizes reaction data for the minerals considered in the simulations. In most cases these minerals were identified as actual reactants or products of reactions occurring in the Äspö and Stripa field tests. The modal mineralogy is based on data provided by Karnland et al. (2000) and Pusch et al. (1992c), respectively. Gypsum was not considered in the simulations because it is thermodynamically unstable relative to anhydrite over the temperature range of interest. Initial simulations also indicated that aqueous silica concentrations were consistently below the solubility of completely amorphous silica, SiO2(am). A less soluble, partially
amorphous polymorph, opal-CT, was therefore used in the simulations to account for the observed precipitation of “amorphous silica” in the Stripa experiments. The chemical compositions of the smectites and saponite are assumed to be reasonably representative of these minerals in general, but may differ significantly compared to the actual compositions of these minerals in the experimental systems. The reactive surface areas of Na- and Ca-smectite are estimated to be 100 times smaller than the specific surface area of reactive edge faces in smectite
40 60 80 100 120 140 160 180 0 5 10 15 T e m p er a tu re ( o C)
Distance from canister surface (cm) Stripa
LOT, S1 parcel
Figure 3.2.2_1. Temperature profiles assumed in calibration models for the Stripa and Äspö (LOT) field tests.
powders determined by Metz et al. (2005). Reactive surface areas for kaolinite, quartz and albite were estimated using intrinsic geometric surface area-to-volume ratios of a cubic shaped mineral with length, width and height = 2
µ
m. All kinetic constants are from Palandri and KharakaTable 3.2.2_2. Mineral reaction data.
Modal mineralogy Kinetic constants1 Mineral
Stripa Äspö sr
(cm2 g-1) (mol mk -2 sec-1) (kJ molEa -1) nz pH range
1.1e-11 23.6 0.34 acid 1.7e-13 35.0 0.00 neutral ca-smectite2 0.41 0.00 4.9e2 3.0e-17 58.9 -0.40 base na-smectite3,4 0.00 0.75 4.9e-12 65.9 0.78 acid 6.9e-14 22.2 0.00 neutral kaolinite 0.41 0.00 3.0e65 8.9e-18 17.9 -0.47 base
quartz6 0.16 0.16 3.0e65 1.0e-14 87.7 0.00 all
6.9e-11 65.0 0.46 acid
2.8e-13 69.8 0.00 neutral
albite6 0.00 0.07 3.0e65
2.5e-16 71.0 -0.57 base
calcite 0.01 0.01 n/a n/a n/a n/a
anhydrite 0.01 0.01 n/a n/a n/a n/a
ca-saponite7 0.00 0.00 n/a n/a n/a n/a
opal-ct 0.00 0.00 n/a n/a n/a n/a
1 - for hydrolysis reactions (precipitation reactions are assumed to follow the same rate law, and to be constrained by the same kinetic constants, as for the corresponding hydrolysis reaction under neutral pH conditions). 2 - Ca0.145Mg0.26Al1.77Si3.97O10(OH)2. 3 - Na0.290Mg0.26Al1.77Si3.97O10(OH)2. 4 - kinetic constants for na-smectite and
ca-smectite are assumed to be identical. 5 - units = m2 m-3. 6 - hydrolysis only. 7 - Ca
(2004), who used a consistent kinetic model based on transition-state theory to retrieve these parameters from experimental sources. The temperature dependence of equilibrium constants for all reactions considered in the simulations is accounted for using a polynomial log K(T) expression incorporated into the thermodynamic database supporting the TOUGHREACT simulations (thermo208.dat; see Xu et al., 2004).
3.2.3 Discussion of results
A common feature of the Stripa and Äspö field tests is the significant net increase in anhydrite (or gypsum) ± calcite in relatively hot regions of the buffer nearest the canister surface. Pusch et
al. (1992b, c) and Karnland et al. (2000) suggest that this is caused by dissolution of anhydrite
and calcite in cooler regions of the buffer and transport of Ca2+, SO
42- and carbonate ions toward
the hotter canister-buffer boundary. Anhydrite and calcite precipitate during transport due to the retrograde solubility of these minerals.
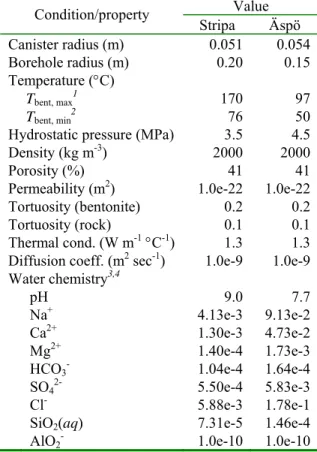
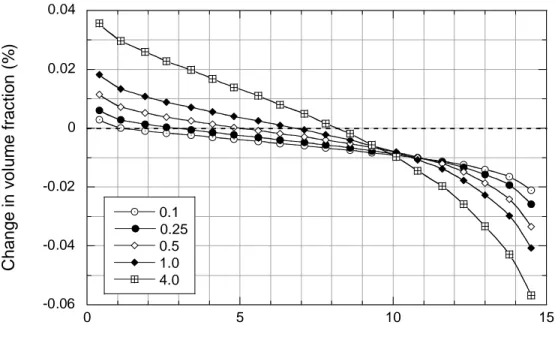
Model simulations are consistent with these observations. Calculated results for anhydrite in the Stripa and Äspö field tests are shown in Figures 3.2.3_1 and 3.2.3_2, respectively, where changes in volume fraction are plotted as a function of distance from the canister’s surface at various times over the experiment’s duration. As can be seen in the figures, initial equilibration of anhydrite with buffer porewaters results in partial dissolution of this mineral along the transport path. Anhydrite then dissolves from colder regions near the buffer-rock interface and precipitates in hotter regions nearest the canister. This results in a net increase of less than about 0.05 vol. % anhydrite in the hottest parts of the buffer, and to net losses of less than about 0.06
-0.06 -0.04 -0.02 0 0.02 0.04 0 5 10 15 0.1 0.25 0.5 1.0 4.0 C h a n g e i n vo lu me fr a c ti o n ( % )
Distance from canister surface (cm)
Figure 3.2.3_1. Spatial and temporal variations in anhydrite abundance in the Stripa simulations. The legend refers to time in years. The initial volume fraction of anhydrite = 0.59%.
-0.05 0 0.05 0 2 4 6 8 10 0.1 0.25 0.5 1.0 Chan g e in v o lu m e f rac ti on (% )
Distance from canister surface (cm)
Figure 3.2.3_2. Spatial and temporal variations in anhydrite abundance in the Äspö simulations. The legend indicates time in years.
vol. % in the coldest parts.
Some of the Ca2+ released by anhydrite dissolution (Figures 3.2.3_1 and 3.2.3_2) replaces Na+ in smectite. The transformation of Na-smectite to Ca-smectite is approximated in the model as a dissolution-precipitation process rather than an ion-exchange process because the temperature-dependence of the ion-exchange constant is unknown. The amount of anhydrite precipitating at the hot end of the buffer therefore depends on the dissolution rate of Na-smectite because this controls the precipitation rate of Ca-smectite and, hence, the aqueous concentration of Ca2+. Preliminary sensitivity analyses addressing this dependence in the Äspö simulations show that increasing the assumed reactive surface area of Na-smectite by two orders of magnitude, which corresponds to the nominal surface area of reactive edge faces in smectite powders (Metz et al., 2005), completely prevents anhydrite from precipitating in the hottest regions of the buffer because aqueous Ca2+ concentrations are then too low.
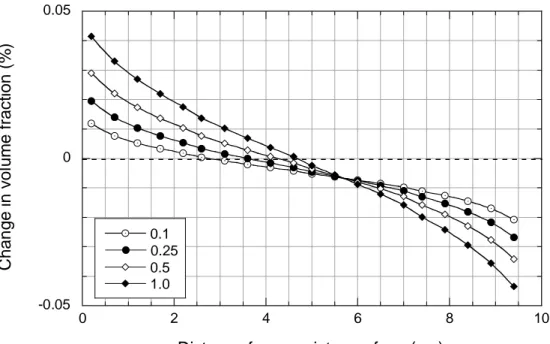
A feature distinguishing the Stripa and Äspö studies is the observed precipitation near canister surfaces of amorphous silica and trioctahedral smectite in the Stripa tests, and their absence in the Äspö tests. Model results are qualitatively compatible with these observations. Figures 3.2.3_3 and 3.2.3_4 show spatial and temporal distributions of amorphous silica (represented by opal-CT) and trioctahedral smectite (represented by Ca-saponite) in the Stripa simulations. Model results agree with experimental observations insofar as the amounts of both minerals are calculated to increase near the canister-buffer boundary. In comparison, opal-CT and Ca-saponite do not precipitate in the Äspö simulations. These differences result from the higher temperatures evaluated in the Stripa tests, which increase the dissolution rate of Na-smectite and also stabilize Ca-saponite relative to Ca-smectite. It is interesting to note that alteration of Na-
-0.01 0 0.01 0.02 0.03 0.04 0.05 0.06 0 5 10 15 0.1 0.25 0.5 1.0 4.0 C h a n g e i n vo lu me fr a c ti o n ( % )
Distance from canister surface (cm)
Figure 3.2.3_3. Variations in opal-CT concentrations: Stripa simulations. Legend as in Figure 3.2.3_1. -0.005 0 0.005 0.01 0.015 0.02 0.025 0 5 10 15 0.1 0.25 0.5 1.0 4.0 C han ge in v o lu m e f rac ti o n ( % )
Distance from canister surface (cm)
Figure 3.2.3_4. Variations in saponite concentrations. Stripa simulations. Legend as in Figure 3.2.3_1.
smectite to Ca-saponite depresses Ca2+ concentrations to such an extent that the amounts of anhydrite precipitated in the Stripa model (Figure 3.2.3_1) are actually somewhat smaller than
those simulated in the Äspö model (Figure 3.2.3_2) despite the fact that higher temperatures and longer experimental durations were involved in the Stripa tests.
Kaolinite, quartz and feldspars experienced significant dissolution in samples of bentonite nearest the canister surface in the Stripa experiments (Pusch et al., 1992c). This observation is incompatible with model simulations (Figure 3.2.3_5), which predict minor dissolution of quartz (not shown in the figure) and precipitation of kaolinite in amounts proportional to the amount of smectite dissolved.
A possible explanation for this disagreement is that the model does not presently account for the hydrothermal alteration of kaolinite-smectite mixed-layers in Fo-Ca 7 clay. Such alteration may involve the following reaction proposed by Meunier et al. (1992):
kaolinite-high/low-charge smectite mixed-layer + quartz + free kaolinite ↔ low-charge smectite. This reaction is not accounted for in our model because the thermodynamic properties of the mixed-layer minerals are unknown. The dissolution of kaolinite and quartz in the Stripa tests may indicate, however, that the above reaction proceeds to the right under these conditions.
3.2.4 Summary
The comparisons discussed above provide some confidence that our calibrated numerical model provides a reasonable, qualitative description of complex reactive-transport processes controlling
-0.3 -0.2 -0.1 0 0.1 0.2 0 5 10 15 Chan g e in v o lu m e f rac ti on (% )
Distance from canister surface (cm)
Figure 3.2.3_5. Variations in kaolinite (solid lines) and Na-smectite (dashed lines) concentrations: Stripa simulations. Symbols correspond to the legend in Figure 3.2.3_1.
bentonite alteration under non-isothermal conditions. Model results are qualitatively compatible with experimental observations from regions of the buffer exposed to the highest temperatures, which indicate precipitation of secondary anhydrite ± amorphous silica (opal-CT) ± calcite, and alteration of Na-smectite to Ca-smectite ± saponite. Model results are not compatible, however, with observations from this region in the Stripa tests indicating extensive dissolution of quartz, kaolinite and feldspars. This disagreement may be attributable to the fact that the model does not presently account for the hydrothermal transformation of high-charge smectites in kaolinite-smectite mixed layers to low-charge kaolinite-smectites, with concomitant dissolution of quartz and kaolinite. There may also be a general tendency for the model to under predict the extent of mineral mass transfer, but quantitative comparisons are not permitted by the available experimental data. Further refinement of the model may thus be required for more quantitative applications, but the model is considered to be adequate in its present form for use in scoping analyses of buffer cementation under KBS-3 conditions.
3.3 Base case model
In this section we apply the calibrated model described above to realistic constraints on the time-temperature evolution of the KBS-3 near field. These expected conditions, which define the “base case” in our model, are discussed below. Alternative conditions define various “sensitivity cases”, which are considered in Section 3.4.
3.3.1 Thermal evolution of the near field
TOUGHREACT was used to model spatial and temporal variations in temperature across the KBS-3 buffer. The objective of the modeling was to match as closely as possible time-temperature histories predicted for the near field in previous SKB studies (SKB, 1999a; Karnland
et al., 2000).
The model system is illustrated in Figure 3.3.1_1. A radial coordinate system is assumed. The outer radius of the canister = 0.525 m, the outer radius of the buffer = 0.875 m, the waste
package is 4.833 m long, and borehole and tunnel spacings are 6 m and 40 m, respectively (SKB, 1999a). Symmetry constraints allow us to consider only a quarter of the model system explicitly. The system is then discretized using a series of finite-difference control volumes. The tops of the rock control volumes are connected to boundary nodes having fixed ambient conditions (T = 15°C, phydrostatic = 5 MPa, full water saturation). Initial conditions in the buffer include T = 15°C,
p = 0.1 MPa and water-saturation = 80%. The rock is assumed to be initially fully water
saturated with T = 15°C and phydrostatic = 5 MPa (i.e., at a repository depth of 500 m). The
geometry between the rock and boundary control volumes is treated as an adjustable parameter to optimize agreement between our model predictions and those of previous SKB studies.
TOUGHREACT is used to solve the fundamental equations for heat and mass transfer governing the evolution of the model system. These equations are described in detail by Pruess (1991) and Xu et al. (2004). Here we note that although the governing mass-balance equations for aqueous species given by Equation (1) (Section 3.1) remains valid under conditions of full water saturation, a small amount of mass transfer may also be driven by resaturation during the initial stages of near-field evolution. The appropriate mass-balance equation under these conditions is given by (e.g., Lichtner, 1996):
, ) ( ) ( ) ( 1 r N r ir i i i R C C DS t C S r
∑
= = • ∇ + ∇ • ∇ −φ
ν
∂
φ
∂
v (7)where symbols are as described in Section 3.1, and S denotes water saturation and v stands for the Darcy velocity vector (m s-1).
Model parameters are summarized in Table 3.3.1_1. These data are taken from, or are based on, parameter values from various sources. The initial decay heat power for waste packages in a KBS-3 repository (1680 W canister-1) is taken from Karnland et al. (2000). The corresponding decay heat history is from Hökmark and Fälth (2003). The selected thermal and hydraulic properties for the buffer, and hydraulic properties for the rock, are from Börgesson and Hemelind (1999). This reference also specifies retention properties for the buffer and rock, and recommends a capillary pressure for the buffer = 1000 MPa. Thermal properties for the rock are from Sundberg et al. (2003). It should be noted that all parameter values listed in Table 3.3.1_1 represent best estimates from among a range of possible values. Alternative estimates in certain cases are considered in Section 3.4.
Optimized model results are shown in Figure 3.3.1_2. The simulated thermal and resaturation profiles are displayed together in this figure because the thermal conductivity of the buffer depends on the extent of water saturation.
Table 3.3.1_1. Parameters in the thermal model.
Parameter Buffer Rock
Thermal conductivity [W m-1 K-1] 1.0 3.0
Density [kg m-3] 2000 2600
Specific heat [J kg-1 K-1] 2500 850
Hydraulic conductivity [m s-1] 10-13 10-7
Figure 3.3.1_2. Temperature and resaturation histories for the KBS-3 buffer in the base-case model. The terms “hot end” and “cold end” refer to the canister-buffer and buffer-rock interfaces, respectively.
The time-temperature profiles displayed in Figure 3.3.1_2 closely match those reported in previous SKB studies (Karnland et al., 2000). The maximum temperature at the canister-buffer boundary (≈ 76°C) is reached about 10 years after waste deposition, whereas the maximum temperature at the buffer-rock boundary (≈ 57°C) occurs about 20 - 30 years later. Small temperature differences persist between the hot and cold ends of the buffer out to 1000 years, but then disappear completely within 10,000 years. Near-field temperatures are then uniform and equivalent to ambient rock temperatures. Buffer temperatures always remain below about 80ºC, consistent with KBS-3 design requirements.
The initially unsaturated buffer imbibes groundwater from the host rock in response to both hydraulic-pressure and capillary-pressure gradients. As can be seen in Figure 3.3.1_2, this resaturation process is estimated to take about 56 years, after which time the entire buffer remains fully saturated with water.
3.3.2 Geochemical evolution of the near field
TOUGHREACT is used in this section with the calibrated model from Section 3.2 and thermal model from Section 3.3.1 to simulate evolving geochemical conditions within the buffer during the non-isothermal period in a KBS-3 repository. Changes in porosity provide a convenient measure of these conditions because such changes reflect the cumulative effects of all mineral dissolution/precipitation reactions in accordance with Equation (6) (Section 3.1).
Figure 3.3.2_1 shows calculated changes in porosity across the buffer at various times. The changes at any given time are most pronounced in the hottest zone near the canister-buffer
0 10 20 30 40 50 60 70 80 90 100 0.1 1 10 100 1000
Time since emplacement [years]
Tem p er at ur e [ C ] 0 0.1 0.2 0.3 0.4 0.5 0.6 0.7 0.8 0.9 1 W a te r S a tu ra ti o n
Temperature ("hot end") Temperature ("cold end") Water Saturation (hot end) Water Saturation ("cold end")
-0.008 -0.006 -0.004 -0.002 0 0.002 0.004 0.006 0.008 0.525 0.575 0.625 0.675 0.725 0.775 0.825 0.875
Radial distance from canister center [m]
Por o s it y ch ange 0.1 yr 1 yr 10 yr 100 yr 1000 yr
Figure 3.3.2_1. Porosity variations in the buffer at various times post-deposition. The canister-buffer boundary is 0.525 m from the canister center; the canister-buffer-rock boundary is 0.875 m from the canister center.
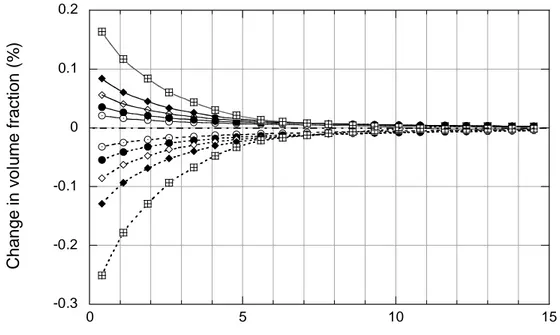
interface, where negative porosity changes indicate net mineral precipitation, and in the coldest zone near the buffer-rock boundary, where increases in porosity indicate net mineral dissolution. Changes in porosity are small, amounting to less than about ± 0.006 (±1.5% of the initial value) after 1000 years. As can be seen with reference to Figure 3.3.1_2, porosity variations over relatively long periods of time at relatively low temperatures and small temperature gradients may be larger than those occurring over relatively short time periods at higher temperatures and steeper temperature gradients.
The underlying reasons for these changes in porosity can seen in Figures 3.3.2_2a-d, where variations in the abundances of Na-smectite, Ca-smectite, anhydrite and calcite, respectively, are plotted as a function of location and time. Dissolution of Na-smectite results in the precipitation of nearly equivalent amounts of Ca-smectite. Because the molar volumes of these two minerals are similar, the net effects on porosity are negligible. The extent of mass-transfer involving these minerals increases with increasing temperature because the rate constant for Na-smectite dissolution increases with increasing temperature (note that local equilibrium is assumed for precipitation of Ca-smectite because rate laws and constants governing the precipitation kinetics of this phase are unavailable).
The retrograde solubility behavior of anhydrite and calcite controls the concentration profiles for these minerals in Figures 3.3.2_2c and 3.3.2_2d. The increase in anhydrite and calcite solubilities with decreasing temperature sets up concentrations gradients among Ca2+, SO42- and HCO3- ions,
which causes them to diffuse down the concentration gradient toward the hotter canister-buffer interface. Neoformed anhydrite and calcite then precipitate as the diffusing ions encounter higher temperatures. For anhydrite, these coupled processes span the entire thickness of the buffer, leading to a progressive loss of anhydrite in zones nearest the buffer-rock boundary and to a
-1.60E-02 -1.40E-02 -1.20E-02 -1.00E-02 -8.00E-03 -6.00E-03 -4.00E-03 -2.00E-03 0.00E+00 0.525 0.575 0.625 0.675 0.725 0.775 0.825 0.875
Radial distance from canister center [m]
N a -s m e ct it e v o lu m e f rac ti on ch a n g e 0.1 yr 1 yr 10 yr 100 yr 1000 yr 0.00E+00 2.00E-03 4.00E-03 6.00E-03 8.00E-03 1.00E-02 1.20E-02 1.40E-02 0.525 0.575 0.625 0.675 0.725 0.775 0.825 0.875
Radial distance from canister center [m]
C a -s m e c tit e v o lu m e fr a c tio n change 0.1 yr 1 yr 10 yr 100 yr 1000 yr -6.00E-03 -4.00E-03 -2.00E-03 0.00E+00 2.00E-03 4.00E-03 6.00E-03 8.00E-03 0.525 0.575 0.625 0.675 0.725 0.775 0.825 0.875
Radial distance from canister center [m]
A n h y dr it e vo lu m e f ract io n chan ge 0.1 yr 1 yr 10 yr 100 yr 1000 yr -2.20E-04 -2.00E-04 -1.80E-04 -1.60E-04 -1.40E-04 -1.20E-04 -1.00E-04 -8.00E-05 -6.00E-05 -4.00E-05 -2.00E-05 0.00E+00 2.00E-05 0.525 0.575 0.625 0.675 0.725 0.775 0.825 0.875
Radial distance from canister center [m]
C a lc ite v o lu m e fr a c tio n c h ange 0.1 yr 1 yr 10 yr 100 yr 1000 yr
Figures 3.3.2_2a-d. Spatial variations in volume fractions of Na-smectite (a), Ca-smectite (b), anhydrite (c) and calcite (d) at various times. (canister-buffer boundary at 0.525 m, buffer-rock boundary at 0.875 m).
continuous increase in neoformed anhydrite in regions nearest the canister-buffer boundary. Similar processes involving calcite are complicated by the enhanced precipitation of Ca-smectite in the hottest regions of the buffer (Figure 3.3.2_2b). This causes calcite to dissolve in these regions, which locally reverses the concentration gradient for HCO3-. Calcite then re-precipitates
at intermediate locations between the canister-buffer and buffer-rock boundaries (Figure 3.3.2_2d).
By comparing Figures 3.3.2_1 and 3.3.2_2a-d, it can be seen that anhydrite is the main contributor to porosity changes in the base-case model. This condition results from the canceling effects of dissolution and precipitation reactions involving minerals having similar molar volumes, as noted above, and to the negligible precipitation of other minerals considered in this model (including calcite and trace amounts of kaolinite, saponite and opal-CT). A point worth emphasizing here is that it is not presently possible to conclude whether the total extent of mineral mass transfer predicted in this model could adversely affect the physical and rheological properties of compacted buffer materials. This is discussed further in Section 4.1.
3.4 Sensitivity cases and scoping calculations
Separate analyses were carried out to determine the sensitivity of base-case model results to uncertainties in selected model parameters. Each analysis involved the selection of an alternative
value for a given parameter while keeping all other parameters unchanged. These “sensitivity cases” include:
• decreased thermal conductivity; the thermal conductivity at full water saturation was reduced from 1 W m-1 K-1 to 0.7 W m-1 K-1, a value that is at the low end of the range of uncertainty in this parameter (see Karnland et al., 2000),
• increased permeability; the permeability was increased from 10-22 m2 to 10-20 m2 (i.e., the hydraulic conductivity was increased from 10-13 m s-1 to 10-11 m s-1),
• decreased porosity; the porosity was reduced from 0.41 to 0.25 to evaluate the potential effects on heat and mass transport of dead-end pore spaces in bentonite (e.g., see Pusch, 2003),
• decreased capillary pressure; the capillary pressure was reduced by an order of magnitude from the base-case value of 1000 MPa,
• decreased tortuosity; the tortuosity was reduced from the base-case value of 0.2 to 0.01 to consider the possible effects on solute transport of extremely tortuous pathways in fine-grained, highly compacted buffer materials, and
• increased tortuosity; the buffer tortuosity was increased to unity to bound a hypothetical case in which diffusional transport is unaffected by tortuous pathways.
Model results for these sensitivity cases are discussed in Sections 3.4.1 and 3.4.2. Other scoping analyses are considered in subsequent sections.
3.4.1 Effects on resaturation
Buffer resaturation is controlled by all the parameters considered in the sensitivity cases. Table 3.4.1_1 summarizes the effects of these cases on resaturation times. It can be seen that the resaturation time is reduced by an amount that is essentially directly proportional to the assumed increase in hydraulic conductivity. Similar effects are noted for porosity, which, when decreased by a factor of 1.6, shortens the resaturation time by essentially the same factor (because less time is needed to fill smaller pore spaces). The reduction in capillary pressure doubles the resaturation time because the imbibition potential is reduced accordingly. Changes in thermal conductivity and tortuosity have relatively small effects on resaturation times. Overall, the sensitivity cases considered here produce a range of resaturation times varying from one year to over 100 years. This range is consistent with the results of other studies (e.g., SKB, 1999a).
Table 3.4.1_1. Resaturation times in sensitivity cases (base case = 56 years).
Sensitivity Case Resaturation times [yr] Decreased thermal conductivity 55
Increased permeability 1
Decreased porosity 35
Decreased capillary pressure 127
Decreased tortuosity 63
3.4.2 Effects on porosity
Figure 3.4.2_1 summarizes the effects of the sensitivity cases on porosity after 1000 years. As noted earlier, changes in porosity are of particular interest because they result from the cumulative effects of all mineral dissolution/precipitation reactions occurring in the buffer over a given period of time. As can be seen in the figure, porosity changes overall are especially sensitive to changes in the thermal conductivity and tortuosity. These physical parameters may thus play an important role in controlling the geochemical evolution of the buffer.
Some specific results of the sensitivity cases regarding porosity are also noteworthy. The case involving a reduction in thermal conductivity increases the temperature at the canister-buffer boundary from 76 to 87°C, but the temperature at the buffer-rock boundary increases only slightly. The resultant steepening of the temperature gradient enhances anhydrite mass-transfer, which in turn largely controls changes in porosity for reasons discussed in Section 3.3.2. This explains why the porosity at the canister-buffer boundary increases about 1.4 times compared to the base case, while corresponding changes in porosity at the buffer-rock boundary are negligible.
Figure 3.4.2_1 indicates a leveling off of porosity variations near the buffer-rock boundary in the sensitivity case involving an increase in tortuosity (i.e., tortuosity is assumed to have no effect on solute transport in this hypothetical, bounding case). This plateau results from complete dissolution of anhydrite1, and thus marks the position of an anhydrite-dissolution front in the
-0.016 -0.012 -0.008 -0.004 0 0.004 0.008 0.525 0.575 0.625 0.675 0.725 0.775 0.825 0.875
Radial distance from the canister center [m]
P o ro si ty cha n ge Base Case Increased permeability Decreased thermal conductivity Decreased porosity
Decreased capillary pressure Decreased tortuosity Increased tortuosity
Figure 3.4.2_1.Spatial porosity variations in the base case and sensitivity cases after 1000 years (canister-buffer boundary at 0.525 m, buffer-rock boundary at 0.875 m).
1 The initial anhydrite volume fraction = 0.0059. This figure is calculated using the mode for anhydrite (volume
buffer after 1000 years. Because porosity variations are largely controlled by anhydrite abundance, this plateau also represents the approximate maximum possible increase in buffer porosity. This maximum value is fixed by the initial volume fraction of anhydrite in the buffer Conversely, the case involving a reduction in tortuosity results in the smallest porosity changes among the sensitivity cases considered (Figure 3.4.2_1). This is because anhydrite mass transfer is strongly inhibited by the corresponding decrease in diffusive mass transport of Ca2+ and SO4
2-ions.
Other sensitivity cases involving an increase in permeability, reduced porosity and reduced capillary pressure have relatively small effects on porosity changes relative to the base case (Figure 3.4.2_1). These sensitivity cases do have an important effect on resaturation, however (Section 3.4.1), which implies that resaturation, including advective solute transport, does not strongly influence the geochemical evolution of the near field. Model results thus far indicate that vaporization of porewater during the initial heating phase of buffer resaturation (Figure 3.3.1_2) is not sufficiently robust to significantly increase solute concentrations.
3.4.3 Reversibility
SKB suggest that any buffer cementation occurring in the KBS-3 near field would be at least partially reversible if the underlying reactive-transport processes involve minerals having retrograde solubilities (e.g., SKB, 1999b). This is because such minerals would tend to dissolve as the buffer cools beyond the period of peak temperatures and maximum thermal gradient (Figure 3.3.1_2).
This possibility was evaluated by extending our base-case model out to a period of 10,000 years. Thermal effects induced by repository heating will have completely dissipated by this time, and the entire near field will exist at the ambient rock temperature of 15°C.
Results are shown in Figure 3.4.3_1, where porosity variations, resulting mainly from anhydrite dissolution/precipitation (Section 3.3.2), are plotted as a function of space and time. As can be seen, cooling beyond 1,000 years reverses the amount of porosity reduction in a region of the buffer near the canister-buffer boundary. These changes are small, however, and have little impact on total porosity changes that were produced throughout the buffer during the preceding non-isothermal period. These results suggest that although some mineralogical changes produced by buffer cementation are certainly reversible in principle, such changes, and associated effects on the buffer’s physical properties, may persist over very long periods of time.
3.4.4 Reaction kinetics
In this section we consider how uncertainties in our kinetic model of smectite dissolution might affect the base-case results. These uncertainties come mainly from estimates of the reactive surface area, sr [Equation (3)], and may be appreciable for several reasons. Estimates based on