Laboratory Instructions as a Cause of
Student Dissonance
Anil Dey, Martin Hell, Carl Christian Rolf, Paul Stankovski, Martin Ågren
Abstract—Improving the quality of education is the goal of all pedagogical research. By using student surveys and course evaluations problem areas can be identified in most courses offered by universities. In this paper we perform a large-scale student survey in order to find the causes of, and remedies to, a widespread student dissonance in a mandatory course with over 100 students at Lund University.
Our research shows that aiming for deeper learning, without providing time and a stimulating environment, can be worse than settling for expository learning. This problem has persisted for years despite attempts by the course administrators to solve the problem.
We propose that major improvements can be achieved, both in learning and pass rates, primarily by improving the lab instructions but also by using a more intellectually stimulating lab equipment.
I. INTRODUCTION
In this paper we aim to explain and remedy the major dif-ferences in pass-rates for a laboratory given to both electrical engineering (EE) and computer science (CS) students at the largest university in Sweden. Almost all EE students fail the lab, whereas nearly every CS student passed.
We performed a student survey in order to identify the problem areas. In particular, we asked about the level and quality of the lectures and laboratories. Previous attempts to get student feedback have been made by the lab session manager [3]. However, our survey was more extensive, with answers from almost 100 students per education.
In our analysis we identified the laboratory manual as the main cause for concern. We explore many reasons for the student performance, including the fact that the EE students were finally given the CS lab manual as a way to increase pass-rates.
II. BACKGROUND
The core curriculums of both the electrical engineering and the computer science programs contain one mandatory electronics course each. The courses cover the same basic topics and contain very similar lectures and labs.
The issue we are studying is a laboratory session given to the electrical engineering students. Almost all of the 120 stu-dents failed to complete the assigned tasks within the allotted time, and had to return for extra sessions. The corresponding laboratory is given to the computer science students, of which 80 % finished on time.
The laboratory manuals for CS and EE differ significantly. One obvious difference is that the manual given to the computer science students has a simpler layout with plenty
Uppgifter Uppgift 1
I denna uppgift kommer du att studera frekvenssvaren från de låg- och högpassfilter ni designat och plotta motsvarande Bodediagram.
Uppgift 1.1
Koppla upp ditt lågpassfilter med brytfrekvensen 350 Hz på en Boe-Botens kopplinsplatta. (Robotens strömbrytare skall vara i läge 0.) Använd tongeneratorn för att generera en insignal. Koppla in den enligt förberedelseuppgift 2 till filtret. Plotta Bodediagrammet genom att mäta amplitud och fas för signaler mellan 100 Hz och 10 KHz. Tänk på att diagrammet har logaritmisk frekvensskala då ni väljer mätpunkter. För in era mätvärden både som en tabell i er labbdagbok, och i diagrammet längst bak i labbhandledningen. Glöm inte att gradera axlarna i frekvens, fas respektive dB så att det stämmer med era mätvärden.
Uppgift 1.2
Upprepa föregående uppgift för ditt högpassfilter med brytfrekvensen 1500 Hz. Anteckna mätvärdena och plotta bodediagrammet.
Uppgift 1.3
Jämför era plottar med de asymptotiska resultaten i Figur 6.15 i boken ”Electrical Engineering”. Kommentera skillnaderna. Anteckna dessa i er labbdagbok.
Uppgift 1.4
Belasta utgången av ditt högpassfilter från föregående uppgift med en resistans av samma storleksordning som R. Anteckna svaren på följande:
! Bestäm brytpunkten för det nya nätet. ! Förklara eventuella förändringar.
Uppgift 1.5
Koppla bort lasten.Mät amplituden på insignalen, spänningen över R och spänningen över C med oscilloskopet (Multimetern klarar inte frekvenser över 1kHz). Stämmer Kirchhoffs spänningslag? Anteckna era observationer.
Tänk på att jordförbindelsen på de bägge probarna är ihopkopplade i oscilloskopet. För att kunna mäta spänningen över en komponent mitt i en krets så används funktionen ”Diff” hos oscilloskopet – fråga labbhandledarna hur man gör.
Fig. 1: Laboratory manual for the CS students.
of figures and not as much condensed text, see Fig. 1. The corresponding manual given to the electrical engineering students looks more "professional" and consists mostly of condensed text, see Fig. 2. Upon closer inspection, the CS manual clearly gives step-by-step instructions on what to do. In the case of EE, the assignments are more guides on what is to be achieved, rather than clear instructions on how to reach that goal.
Another difference in the laboratory exercises is that the computer science laboratories take place on a robot, which for each lab has a new program that the students can examine and understand. Usually, the program will consist of "faulty" programming, causing the robot to malfunction. The task is to build a circuit to compensate for the "faulty" programming, making it, e.g., drive in a straight line instead of in a circle. The analogous lab for the electrical engineering students consists of building the same circuit on a standalone board, and simply measure their circuit and draw graphs of what they see.
We consider the CS lab to be more expository than the EE lab, which is cost effective [2], but not the best choice
Spänningsaggregatet
ESS010 - Elektronik, Lund University. 43
Utförande
Koppla upp dina filter på kopplinsplattan.
1. I brytpunkten har utsignalamplituden sjunkit till relativt insignalen. Bestäm brytpunkten genom att variera frekvensen på tongene-ratorn och studera utsignalamplituden från nätet. Anslut båda probarna, en på insignalen och en på utsignalen.
2. Det asymptotiska bodediagrammet, amplitud och fas, är räta linjer med känd lutning samt brytpunkter. Det uppmätta bodediagrammet skiljer sig ytterst lite från det asymptotiska utom just i brytpunkten. För att kunna plotta diagrammet behövs då endast två till tre punkter på varje kurvdel samt brytfrekvensen. Gör mätningar och plotta diagrammen för både amplitud och fas. Angående fasmätning se appendix A.
3. Rita in det asymptotiska Bodediagrammets linjer i samma plot.
4. Belasta utgången med en resistans av samma storleksordning som R och bestäm brytpunkten. Förklara eventuella förändringar.
5. (Obs! koppla bort en probe helt i denna mätning på grund av risk för
kort-slutning genom jordklämmorna)
Mät amplituden på insignalen, spänningen över R och spänningen över C med oscilloskopet (Multimetern klarar inte frekvenser över 1kHz). Det gäller att vgenerator = vresistor + vkondensator. Stämmer Kirchhoffs spän-ningslag enligt din mätning? Förklara!
EXTRAUPPGIFT: Undersökning av “Svarta lådan”
Utförande
Använd dina kunskaper för att så långt det är möjligt karaktärisera innehållet i en okänd koppling utdelad av handledaren. Försök att göra en kretsmodell som beskriver uppträdan-det.
EXTRAUPPGIFT: Karaktärisering av förstärkare med komersiellt mätinstrument.
Institutionen har ett audiotestinstrument Audio Precision Mark II som används kommersiellt i tester av audioförstärkare. Instrumentet styrs från en PC där det finns många färdiga test-procedurer och data kan lagras. En mätuppställning är förberedd för demonstration och en handledare visar möjligheterna.
1⁄( 2)!0,7
Fig. 2: Laboratory manual for the EE students.
for learning [1]. In this paper we will show that the robot based CS lab may still make students think harder about the problems, stimulating deeper learning [5].
III. STUDENTSURVEY
In order to get a clear picture of the experiences and view-points held by the students, we decided to use a questionnaire. We did not possess any prior knowledge regarding expected problem areas, hence, the questionnaire was designed as a broad spectrum survey. The development of the questionnaire was inspired by the design guide in [4].
All the present EE and CS students were asked to rate their opinion about the eight statements below on a scale from "do not agree at all" to "fully agree". By giving four possible answers, we forced the participants to form an opinion other than "neutral" or similar, hoping this would give better answers. In total, we received 104 answers from EE students, three of which were discarded due to failure to indicate the lab session. From CS students, we received 79 valid answers.
We asked the eight questions presented below.
1) The lectures contained information that was relevant to the lab.
2) This information (see Q1) was easy to understand. 3) The laboratory instructions were easy to comprehend. 4) The instructions gave enough information to complete
the lab in a useful manner.
5) I considered myself well-prepared when I arrived to the lab.
6) The teaching assistants did their best to help me through the lab.
7) I found the lab too difficult.
8) I had problems with the lab equipment.
We also let the students comment, in free-text, on what they believed could be improved by the next laboratory session in the course they were currently taking as well as the same laboratory given next year.
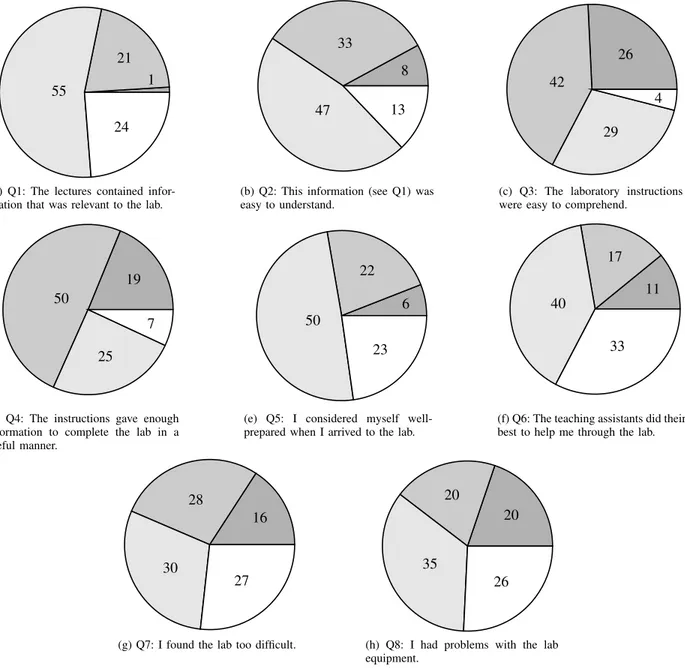
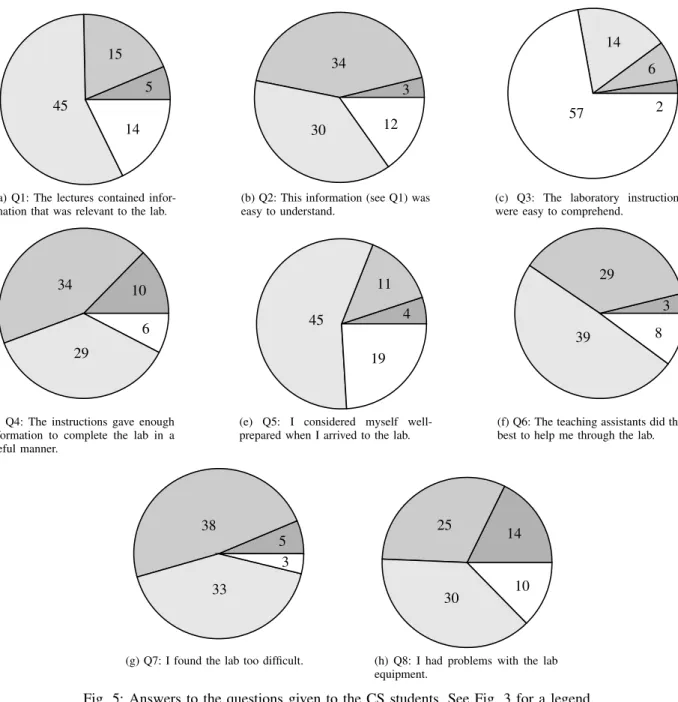
A. Results
The 180 answers in our survey, are summarized in Fig. 4(a)-(h) and Fig. 5(a)-4(a)-(h) where Fig. 3 explains how to interpret the pie charts. In short, darker colors indicate disagreement while lighter colors signify agreement. Parts of our analysis uses data and correlations that are available upon request.
0 1
2 3
Fig. 3: Legend for Fig. 4 and Fig. 5. Each chart begins at "three o’ clock" and progresses counter-clockwise in the manner illustrated here. The range 0-3 corresponds to the range in answers from "do not agree at all" to "fully agree".
IV. SURVEYANALYSIS A. Lectures
Both the CS and EE students feel that the lectures contain information relevant to the lab session. Furthermore, they find this information reasonably easy to understand, see Fig. 4a-(b) and Fig. 5a-4a-(b). Students that find it easy to understand lab-relevant information in the lectures are often more at ease with interpreting the lab manual. The EE students felt that the lectures were easier to understand, but they still ranked the manual as hard to understand.
21 1 55
24
(a) Q1: The lectures contained infor-mation that was relevant to the lab.
8 33
47 13
(b) Q2: This information (see Q1) was easy to understand.
26 42
29 4
(c) Q3: The laboratory instructions were easy to comprehend.
19 50
25 7
(d) Q4: The instructions gave enough information to complete the lab in a useful manner.
6 22
50
23
(e) Q5: I considered myself well-prepared when I arrived to the lab.
11 17
40
33
(f) Q6: The teaching assistants did their best to help me through the lab.
16 28
30
27
(g) Q7: I found the lab too difficult.
20 20
35
26
(h) Q8: I had problems with the lab equipment.
Fig. 4: Answers to the questions given to the EE students. See Fig. 3 for a legend.
B. Laboratory Manual
Our survey results clearly show that the laboratory manual is regarded as nearly incomprehensible by EE students. With four top scores and 26 bottom ones (out of 101), the distribution of the answers is shifted well below average, see Fig. 4c. This gives the manual an exceptionally low score. The instructions are a major problem for the students, as further indicated by Fig. 4d. This is also communicated through the free-text answers. Comments like "Improve the manual!" were abundant. As indicated by Fig. 5d, the CS students were fairly satisfied with both the level and relevance of their lab manual. C. Laboratory Preparations
Both CS and EE students generally regarded themselves as being quite well-prepared for their laboratory session, see
Fig. 4e and Fig. 5e. This is interesting in itself, but curiously, even the well-prepared students did not find the laboratory session easy.
D. Teaching Assistants and Equipment
There were only small differences in the rating that CS and EE students gave the equipment, see Fig. 4h and Fig. 5h. The difference in rating for the teaching assistants, shown in Fig. 4f and Fig. 5f, may be mostly because of frustration by the EE students. Most of the assistants were the same for both the CS and EE students.
5 15
45
14
(a) Q1: The lectures contained infor-mation that was relevant to the lab.
3 34
30 12
(b) Q2: This information (see Q1) was easy to understand.
6 14
57 2
(c) Q3: The laboratory instructions were easy to comprehend.
10 34
29
6
(d) Q4: The instructions gave enough information to complete the lab in a useful manner.
4 11 45
19
(e) Q5: I considered myself well-prepared when I arrived to the lab.
3 29
39 8
(f) Q6: The teaching assistants did their best to help me through the lab.
5 38
33
3
(g) Q7: I found the lab too difficult.
14 25
30 10
(h) Q8: I had problems with the lab equipment.
Fig. 5: Answers to the questions given to the CS students. See Fig. 3 for a legend.
V. CONCLUSIONS
Our main conclusion is that the laboratory manual given to the electrical engineering students needs to be improved. The results of our survey clearly show that EE students find the lab much harder, see Fig. 4g and Fig. 5g. Since there are only small differences in the actual assignments, the lab instructions seem to be the main concern. In fact, all other parts of the EE course fare reasonably well. Even the difficulty of the lab is considered acceptable by the students, despite the fact that hardly any of them passed without a remedial session. Again, the CS students were much happier with the difficulty of their lab, despite having a harder time understanding the lectures.
The good thing about the EE manual is that it aims at a deep approach to learning. However, if the time constraints are too
high, there is no time for understanding. Hence, the students are forced to take a surface approach to learning, which fails since the assignments are too difficult for this approach. The CS manual may be more expository, but experimenting on a robot may counter surface learning to some extent.
A. Improvements
Our main recommendation is to modify the lab manual. The manual given to CS students was used as a last resort in order to help the EE students. Therefore, a good place to start is to change the instructions to resemble those of the CS students. Another improvement is to change the lab itself. A more hands-on approach might be easier to understand for first year students. Using real world experimentation rather than measure, the plot may stimulate students to work harder.
REFERENCES
[1] D. Bligh. What’s the use of lectures?, Intellect Books, 5th revised edition, 1998.
[2] G. Brown and M. Atkins. Effective teaching in higher education. Methuen & Co. 1988.
[3] B. Larsson and A. Ahlberg. Continuous assessment in engineering education: a pilot study, Pedagogisk inspirationskonferens, LTH/Lund, Genombrottet, 2003.
[4] W.-C. Leung, How to design a questionnaire, British Medical Journal, Student Edition, June 2001.
[5] P. Ramsden. Learning to teach in higher education, Second Edition, RoutledgeFalmer, 2003.