3-D Seismic Interpretation of Tectonics and Sedimentation within the Upper
Cretaceous Lewis Shale and Fox Hills Sandstone
Baggs, Wyoming
by Ernest A. Hull
ii
A thesis submitted to the Faculty and Board of Trustees of the Colorado School of Mines in partial fulfillment of the requirements for the degree of Master of Science
(Geophysics). Golden, Colorado Date_____________ Signed:__________________________ Ernest A. Hull Approved:_________________________ Dr. Thomas L. Davis Professor of Geophysics Thesis Co-Advisor Approved:_________________________ Dr. Neil F. Hurley
Professor of Geology and Geological Engineering Thesis Co-Advisor Golden, Colorado Date_____________ _________________________ Dr. Terence K. Young
ABSTRACT
The purpose of this study is to use 3-D seismic data to examine sedimentation within the Lewis Shale and Fox Hills Sandstone of the southern Washakie and northern Sand Wash basins near Baggs, Wyoming. The study area is dominated by left lateral movement on a wrench fault interpreted to be the western extension of the Cheyenne Belt, a Precambrian suture. The eastern portion of the study area contains part of the South Baggs and West Side Canal gas fields, a significant gas field in the eastern Green River Basin. The two fields are separated by a northwest trending fault within the study area.
Subsurface mapping indicates that tectonics played an active role during deposition of the Lower and Middle Lewis (Dad member) sediments. Isochron maps show that faults controlled thick and thin areas in these intervals. During deposition of the Upper Lewis and Fox Hills Sandstone, tectonics ceased to affect sedimentation, isochron maps show relatively uniform thickness in the vicinity of mapped faults. The main anticlinal structure appears to have been a depocenter during Lower and Middle Lewis time. This suggests that some structural inversion has occurred.
Faults strike in three primary directions, northwest, northeast and east-west. These strike directions fit well with left lateral wrench fault patterns predicted by published outcrop, subsurface and clay model studies. Folds and dip directions occur in orientations consistent with such models for left lateral wrench faults. The amount of lateral offset on strike slip faults is difficult to determine. However, in one case, offset of 7 mi (11 km) has been documented.
iv
TABLE OF CONTENTS
ABSTRACT ... iii
TABLE OF CONTENTS ... iv
LIST OF FIGURES ... vi
LIST OF TABLES ... viii
ACKNOWLEDGEMENTS ... ix
CHAPTER 1 INTRODUCTION ... 1
Location of Study Area ... 1
Research Objectives ... 5
Available Data ... 5
3-D Seismic Data Set ... 5
Digital Well Logs ... 6
CHAPTER 2 GEOLOGIC SETTING ... 9
Stratigraphy ... 9 Regional ... 9 Local ... 10 Structure ... 10 Regional ... 10 Local ... 18
Regional Tectonic Stress ... 19
Wrench Faulting ... 19
Petroleum Geology ... 21
CHAPTER 3 SEISMIC DATA ANALYSIS ... 28
3-D Compressional Wave Data Interpretation ... 29
Time Structure Maps ... 33
Isochron Maps ... 38
Seismic Amplitude Maps ... 42
Flattened Seismic Horizons ... 42
Discussion ... 51
Stratigraphic Interpretation ... 51
Structural Interpretation ... 54
South Baggs – West Side Canal Gas Field ... 59
CHAPTER 4 CONCLUSIONS AND RECOMMENDATIONS ... 63
Conclusions ... 63
Recommendations ... 65
REFERENCES CITED ... 66
APPENDIX 1 Detailed Processing Flow ... 70
vi
LIST OF FIGURES
Figure 1.1 Shaded relief map showing location of study area ... 2
Figure 1.2 Index map of northwestern Colorado and south-central Wyoming ... 3
Figure 1.3 Location of South Baggs-West Side Canal gas fields ... 4
Figure 1.4 Map view of survey area showing location of digital well logs ... 7
Figure 2.1 Chronostratigraphic chart of Upper Cretaceous, southern Wyoming ... 11
Figure 2.2 Type log of Meridian #27 well ... 12
Figure 2.3 Interpreted Landsat image of the Cherokee Ridge Arch ... 13
Figure 2.4 Structural patterns predicted by Harding (1973) for right-lateral wrench faulting ... 15
Figure 2.5 Geologic sketch map of eastern Wyoming and parts of adjacent states showing exposures of Precambrian rocks and subdivisions of the Archean and Proterozoic terranes ... 16
Figure 2.6 Map illustrating the setting of the southeastern Wyoming Province and the northeastern Colorado Province ... 17
Figure 2.7 Structural orientation of the thrust belt orogen, arches and basins of the Laramide foreland with the local maximum horizontal shortening direction ... 20
Figure 2.8 Angular relations between structures that tend to form in right-lateral simple shear under ideal conditions... 22
Figure 2.9 Annual gas production in BCF from 1968 to June 2000 in the South Baggs gas field ... 26
Figure 2.10 Annual gas production in BCF from 1968 to June 2000 in the West Side Canal gas field... 27
Figure 3.1 Synthetic seismogram of the Meridian #27 well ... 30
Figure 3.2 Seismic base map on the top of the Almond time structure ... 31
Figure 3.3 Seismic line A – A’ showing significant horizons picked within the data set... 32
Figure 3.4 Almond time structure map ... 34
Figure 3.5 Lower Lewis time structure map ... 35
Figure 3.6 Dad time structure map ... 36
Figure 3.8 Total Lewis isochron... 39
Figure 3.9 Lower Lewis isochron... 40
Figure 3.10 Dad isochron ... 41
Figure 3.11 Upper Lewis/Fox Hills isochron ... 43
Figure 3.12 Top of the Almond to top of the Dad isochron ... 44
Figure 3.13 Top of Lower Lewis to the top of the Upper Lewis isochron ... 45
Figure 3.14 Horizon RMS amplitude extraction map 34 ms above the base of the Dad showing a possible channel feature ... 46
Figure 3.15 Horizon RMS amplitude extraction map 70 ms below the top of the Dad showing a possible channel feature ... 47
Figure 3.16 Seismic line C – C’ flattened on the top of the Almond ... 48
Figure 3.17 Seismic line C – C’ flattened on the top of the Dad ... 49
Figure 3.18 Seismic line D – D’ flattened on the top of the Upper Lewis/Fox Hills ... 50
Figure 3.19 Seismic line E – E’ flattened on the top of the Upper Lewis showing a northeast progradation ... 52
Figure 3.20 Pseudo time slice through clinoforms ... 53
Figure 3.21A Top of sandbox model ... 56
Figure 3.21B Interpreted sandbox model of Figure 3.21A ... 56
Figure 3.22 Harding (1974) left-lateral wrench model ... 57
Figure 3.23 Seismic line B-B’ showing a flower structure observed within the data set... 60
viii
LIST OF TABLES
Table 1.1 Table listing digital well logs used in this study ... 8 Table 2.1 Reservoir characteristics for the South Baggs-West Side Canal gas field……24 Table 3.1 Initial production in MCFD from the wells used in this study ... 62
ACKNOWLEDGEMENTS
I would like to thank my co-advisors, Dr. Tom Davis and Dr. Neil Hurley, for their guidance and support throughout this project. Without them, my stay at the Colorado School of Mines would not have been possible. Thanks also go to my
committee members, Max Peeters, Dr. Geoff Thyne, and John Young for their advice. I would like to thank Ed Blott and Joe Broussard for their help with this research. Thanks also go to BP and Unocal for valuable summer intern experience and for providing help with the Landmark interpretation software.
Special thanks go to Charlie Rourke for always having a smile on her face, forever acting in a professional manner, and for help with many of the peripheral, but important aspects of this project. Special thanks go to the Lewis Shale Consortium sponsors, past and present, for their financial support in making this work possible. Thanks go to the students, past and present, who have been involved in the Lewis Shale Consortium.
I would also like to thank my immediate family for their support during this project and throughout my educational and professional career. There has often been an empty chair at many holidays, births, birthdays, weddings and funerals over the years, but they know that wherever I was in the world, I was there in spirit. Special thanks go to my loving grandparents, Everette E. Hull and Ernestine E. Hull. Even though they were not able to see their only grandson become a young man and wear their last name proudly, they will always be there for guidance and support.
I would also like to thank my childhood friends back home in Bakersfield, California, for just being true friends. Perris Way or “The Block”, and all of its precious memories, will always be with me.
1
CHAPTER 1
INTRODUCTION
This study involves a 3-D seismic interpretation of a complex area in the southeastern portion of the Greater Green River basin in Wyoming and Colorado. The area is heavily faulted, and is associated with a prominent basement uplift. Stratigraphic complexities involve prograding deep-water sand lobes of the Dad member of the Lewis Shale (Upper Cretaceous). Gas fields occur in the eastern part of the study area, and exploration and development drilling is being actively pursued in the area.
Location of Study Area
The study area, located in south-central Wyoming near the town of Baggs, Wyoming, is situated on the eastern end of the Cherokee Ridge. This ridge separates the southeastern portion of the Washakie basin from the northeastern portion of the Sand Wash basin (Figure 1.1). The study involves approximately 29 mi2 (46 km2) of 3-D seismic data in portions of Carbon County, Wyoming, T12N and T13N and R92W and R93W, and Moffat County, Colorado, T12N and R93W (Figure 1.2). The eastern portion of the study area lies above the producing fields known as the South Baggs and West Side Canal gas fields (Figure 1.3).
Figure 1.1 Shaded relief map showing location of study area. (After Thelin and Pike, 1991).
3
Figure 1.2 Index map of northwestern Colorado and south-central Wyoming showing study area and gas fields. (After Cronoble, 1969).
Figure 1.3 Location of South Baggs-West Side Canal gas fields near the town of Baggs, Wyoming. Contour interval is 100 ft (33.3 m) subsea depth. (Wyoming Geological Association, 1979).
5
Research Objectives
The main objective of this research is to determine the relationship between tectonics and sedimentation within the Upper Cretaceous Lewis Shale and Fox Hills Sandstone in the study area. Specifically, the study has four objectives:
1. Interpret the seismic expression of the Lewis Shale and Fox Hills Sandstone.
2. Map faults and folds within the data set.
3. Determine the role of the Cherokee Ridge, if any, in controlling the deposition of late Cretaceous sediments within this area of the Cretaceous Seaway.
4. Explain production at the South Baggs-West Side Canal fields within the context of the seismic data.
Available Data
3-D Seismic Data Set
A 29 mi2 (46 km2) 3-D seismic data set was loaded into a Silicon Graphics workstation with Landmark interpretation software, version 98.5. All seismic data interpretations and manipulations were performed utilizing a variety of Landmark interpretation software products.
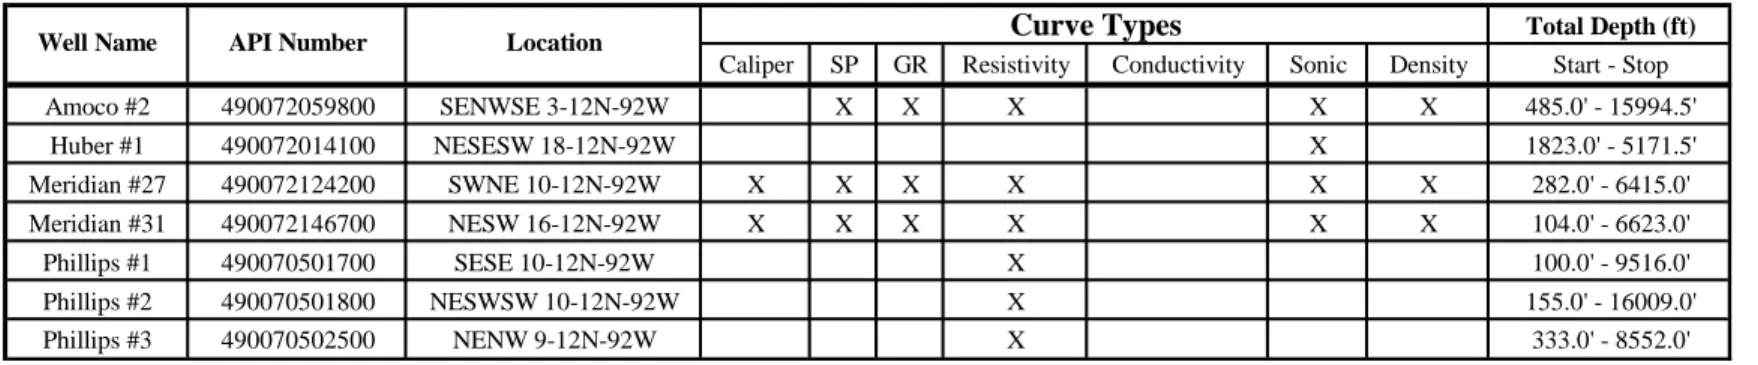
Table 1.1 has a list of wells and well curves and Figure 1.4 shows well locations. One-dimensional synthetic seismograms have been computed using those well logs that contain density-sonic combinations.
An outside seismic service contractor with expertise in Rocky Mountain acquisition environments processed the data set according to the processing flow in Appendix 1. The author made no attempt to reprocess the data.
The 3-D seismic data set used in this research is proprietary and is the property of the geophysical contractor that provided this researcher access to it. Locations are described only in general terms, with selected seismic profiles, cross sections and/or horizon interpretations that do not display line, trace or shot point numbers due to confidentiality concerns.
Digital Well Logs
Seven digital well logs within the research area contain a variety of curve types. Generally, they contain resistivity, gamma ray, sonic and density curves. Log curves are used to identify the significant subsurface contacts in the research area. Significant contacts include: 1) the uppermost sandstone of the Mesaverde Group, commonly known as the Almond Sandstone, 2) the middle sandy member of the Lewis Shale, referred to as the Dad Sandstone or Dad member, 3) the Lewis Shale and Fox Hills transition, and 4) the top of the Fox Hills Sandstone.
Threedigital well logs with density and sonic combinations were used to compute one-dimensional synthetic seismograms in the research area. Together with resistivity and gamma ray curves, the synthetic seismograms were used to determine the locations of significant contacts within the 3-D seismic data set.
7
Table 1.1 Table listing digital well logs used in this study.
Total Depth (ft) Caliper SP GR Resistivity Conductivity Sonic Density Start - Stop Amoco #2 490072059800 SENWSE 3-12N-92W X X X X X 485.0' - 15994.5' Huber #1 490072014100 NESESW 18-12N-92W X 1823.0' - 5171.5' Meridian #27 490072124200 SWNE 10-12N-92W X X X X X X 282.0' - 6415.0' Meridian #31 490072146700 NESW 16-12N-92W X X X X X X 104.0' - 6623.0' Phillips #1 490070501700 SESE 10-12N-92W X 100.0' - 9516.0' Phillips #2 490070501800 NESWSW 10-12N-92W X 155.0' - 16009.0' Phillips #3 490070502500 NENW 9-12N-92W X 333.0' - 8552.0'
9
CHAPTER 2
GEOLOGIC SETTING
Stratigraphy
Regional
The Lewis Shale and Fox Hills Sandstone of northwestern Colorado and south-central Wyoming were deposited during the final transgression and regression of the Western Interior Seaway. This event, known as the Bearpaw transgressive-regressive cycle, lasted about 2.4 million years.
The Lewis Shale overlies the Almond Formation and underlies the Fox Hills Sandstone. Both the Almond Formation and the Fox Hills Sandstone intertongue with the Lewis Shale on a regional scale. The Lewis Shale consists of 2200-2600 feet (734-867 m) of shale, siltstone and sandstone (Gill et al., 1970).
The Lewis Shale consists of three internal members, which are informally known as the Lower Lewis, Dad and Upper Lewis members. The Lower Lewis member is composed of several hundred feet of black shale (Pyles, 2000). Hale (1961) first described the Dad member as a 1000-1400 ft (333-467 m) thick sequence, consisting of sandstones and minor shales. The Upper Lewis member is a dominantly dark gray to
limestone and siltstone concretions (Gill et al., 1970). Regionally, the Upper Lewis member is several hundred feet thick, and consists of shale and siltstone.
The Fox Hills Sandstone intertongues with the shales of the underlying Lewis Shale and overlying shales and sandstones of the Lance Formation. The Fox Hills consists dominantly of thick units of friable sandstone and shale. Sandstone units are pale yellowish gray, very fine to fine grained, weather yellowish gray to light brown, and commonly contain fossiliferous sandstone concretions (Gill et al., 1970). Regionally, the Fox Hills Sandstone is 200 to 700 ft (67-233 m) thick. See Figure 2.1 for a
chronostratigraphic chart of the area.
Local
Within the area of investigation, the vertical thickness observed on well logs of the Lower Lewis, Dad Member, Upper Lewis and Fox Hills Sandstone is 992 ft (331 m), 608 ft (203 m), 362 ft (121 m) and 265 ft (88 m), respectively. See Figure 2.2 for the Meridian #27 well, the well from which these thicknesses were measured.
Structure
Regional
The study area is dominated by a distinct lineament on Landsat imagery that measures 71 mi (114 km) in length and defines a feature that has been termed the Cherokee Ridge Arch (Figure 2.3). Many of the surface and subsurface structural features observed along the Cherokee Ridge have been interpreted to be the result of deformation caused by right-lateral movement on a subsurface wrench fault (Bader,
11
Figure 2.1 Chronostratigraphic chart of the Upper Cretaceous, southern Wyoming. (Modified after Schell, 1973).
13
Figure 2.3 Interpreted Landsat image of the Cherokee Ridge Arch. Red line
represents the Colorado-Wyoming border. Green lines are Bader (1987) interpretations. (After Bader, 1987).
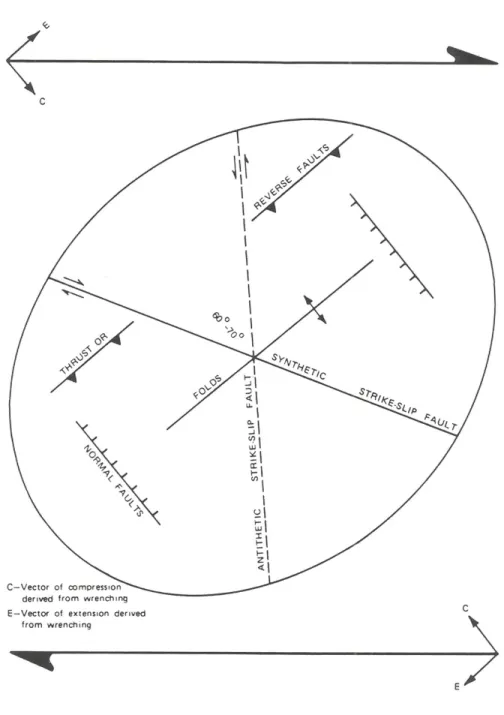
1987). Regionally, these features have been shown by Bader (1987) to match the
structural patterns predicted by Harding (1973) and others for a right-lateral wrench fault (Figure 2.4).
The lineament on Landsat imagery associated with the Cherokee Ridge has been interpreted to be the surface expression of a primary, master right-lateral wrench fault. Surface mapping indicates that the lineament does not break through to the surface, but its geographic location is in the approximate location of a previously mapped major subsurface east-west trending fault that cuts Cretaceous and Tertiary horizons (Bader, 1987). On Landsat imagery, this lineament does not extend into the crystalline rocks of the Sierra Madre to the east and has not been delineated by surface mapping in the area (Karlstrom et al., 1983).
Several east-west and northwest structural trends of Precambrian age have been noted as being prominent in basement rocks of the Wyoming foreland (Thomas, 1971; Brown, 1984). The most significant structural trend in the study area is the Cheyenne Belt, which represents the southern boundary of the Wyoming Province and the northern boundary of the Colorado Proterozoic province (Figure 2.5). The Cheyenne Belt has been interpreted as an Early Proterozoic collision zone that marks the boundary between the Archean craton of the southern Wyoming province and accreted Early Proterozoic island-arc terranes to the south (Hills and Houston, 1979; Karlstrom and Houston, 1984; Duebendorfer and Houston, 1986) (Figure 2.6). East of the study area, regional seismic refraction, seismic reflection and gravity profiles across the Cheyenne Belt as well as isotopic limits on crustal architecture have been shown to be consistent with this
interpretation. Similar work has not been performed west of the Sierra Madre mountains in the study area of this thesis.
Bryant (1985) used isotopic dating of basement rocks in the Uinta Mountains to determine that the southern edge of the Archean continental margin trends east-west at that site. Bader (1987) noted that although the Cherokee Ridge wrench is not in perfect
15
Figure 2.4 Structural patterns predicted by Harding (1973) for right-lateral wrench faulting. The west- northwest trending synthetic strike-slip faults appear to match surface lineaments mapped by Bader (1987) and shown in Figure 2.3.
Figure 2.5 Geologic sketch map of eastern Wyoming and parts of adjacent states showing exposures of Precambrian rocks and subdivisions of the Archean and Proterozoic terranes. After Karlstrom and Houston (1996).
17
Figure 2.6 Map illustrating the setting of the southeastern Wyoming Province and the northeastern Colorado Province. After Karlstrom and Houston (1996).
alignment with Archean continental margin trends to the east (Sierra Madre) and west (Uinta Mountains), it may represent the remnants of an Archean continental margin. Although the Cherokee Ridge may represent the western extension of the Cheyenne Belt, this has not been documented in the published literature.
Local
Previous studies have documented the surface and subsurface expression of faults and folds in the area. In general, subsurface structural trends are similar to those
observed on the surface. However, it has been observed by Cronoble (1969) and Bader (1987) that faults tend to decrease in abundance with depth – perhaps due to the presence of flower structures.
Faults within the study area have two principle strike trends, northwest and northeast, with the northwest-trending faults appearing to be the most dominant.
Northwest-trending faults are en echelon, steeply dipping fault planes that do not flatten with depth.
A major east-west trending, nearly vertical fault extends across the northern portion of the study area for over 24 mi (39 km). Within the study area, this fault is downthrown to the north, whereas to the west, outside of the study area, the sense of displacement is down to the south (Cronoble, 1969). This change in sense of
displacement has been referred to as a “scissor-like effect” and is described by Stone (1969), Wilcox et al. (1973), Law and Barnum (1979), Nelson and Krausse (1981), and Robinson and Barnum (1986). This scissoring effect along a fault has been attributed to strike-slip movement (Stone, 1969; Nelson and Krausse, 1981).
The dominant fold in the area is the Cherokee Ridge, which regionally plunges to the west within the study area. Surface mapping indicates the presence of three
19
subparallel folds, however these folds cannot be traced to the subsurface (Cronoble, 1969; Bader, 1987).
Regional Tectonic Stress
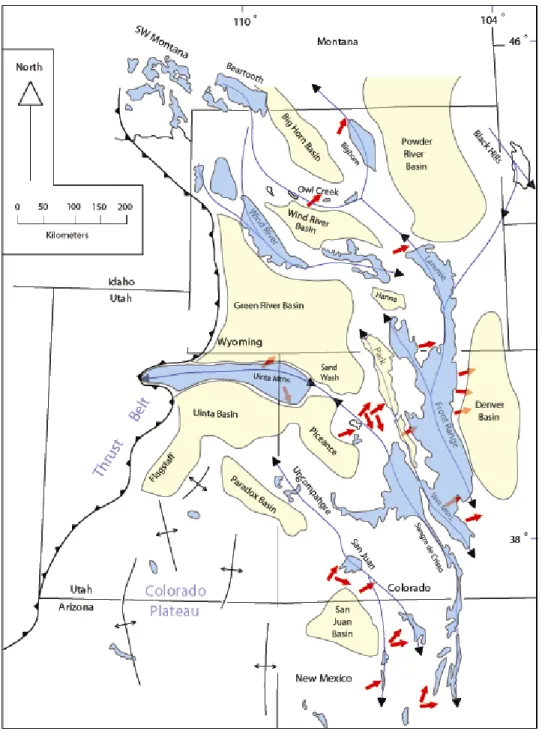
Figure 2.7 shows the structural orientation of the thrust belt orogen, arches and basins of the Laramide foreland with the local maximum horizontal shortening directions. Zoback and Zoback (1989) showed the present day stress in the western continental U.S. is in a northwest direction. Rahmat (2000) used borehole breakout analysis to show a northwest (N30-40W) direction of maximum present day stress in wells located in T10N R93W, just southwest of the study area. Lorenz (1995) concluded that Laramide
compressional forces are more significant to the regional stress than east-west Sevier compression. Gries (1983) stated that foreland structures which were initially developed by east-west compression, changed in the early Laramide to a northwest direction and then north-south by late Laramide. Erslev (2001) suggested that a shift in regional stress occurred from east-west to north-south. Changes in stress orientation are observed in the study area. In other parts of the world, changes in stress orientations have resulted in structural inversion.
Wrench Faulting
Diagnostic criteria for the identification of wrench faulting include the observation of the following features:
Figure 2.7 Structural orientation of the thrust belt orogen, arches and basins of the Laramide foreland with the local maximum horizontal shortening directions. Red arrows indicate local maximum horizontal shortening direction. (Erslev, 2001).
21
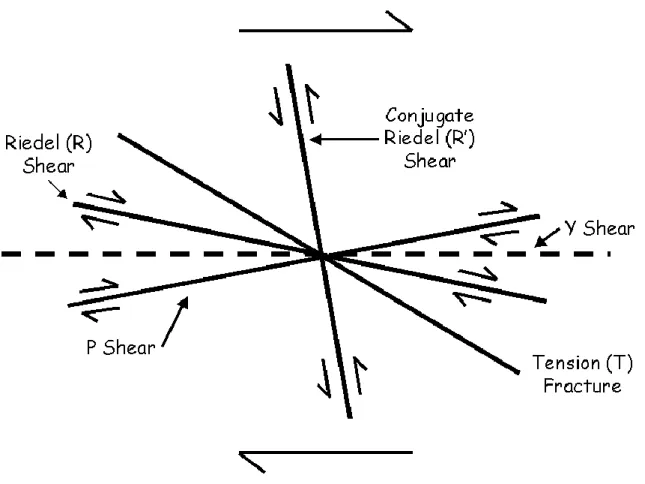
1. The Y shear, a master fault or faults parallel to the principal displacement zone, is characterized by a linear or curvilinear principle displacement zone in map view (Christie-Blick and Biddle, 1985).
2. P shears or secondary synthetic faults. Develop after the formation of the Riedel (R) shears. They have the same sense of displacement as the Riedel shears, and form at an angle to the principal displacement zone that is of about the same magnitude but of opposite sign.
3. Synthetic strike slip faults or Riedel (R) shears. Wilcox et al. (1973) predicted these faults to be high angle, form at angles between 10-30 to the master wrench.
4. Antithetic strike-slip faults or conjugate Riedel (R’) shears. These are
expected to form at angles of 70-90 to the strike of the wrench (Wilcox et al., 1973). They may exhibit a flattened, reversed-S pattern in map view.
5. Extension or tension fractures (T). These form in response to simple shear at about a 45 angle to the master fault.
6. En echelon faults and folds. These are located within and adjacent to the principle displacement zone. Stepped arrangements occur with relatively short structural elements such as parallel faults or folds.
7. Flower structures. Flower structures (Christie-Blick and Biddle, 1985) are upward diverging fault splays (Christie-Blick and Biddle, 1985).
Figure 2.8 shows the angular relations between structures for a right-lateral wrench model under the ideal conditions described above.
Petroleum Geology
The eastern portion of the study area lies above the producing fields known as the South Baggs and West Side Canal gas fields. Both were discovered independently,
Figure 2.8 Angular relations between structures that tend to form in right-lateral simple shear under ideal conditions. (Christie-Blick and Biddle, 1985).
23
(Parker and Bortz, 2001). The South Baggs gas field was discovered in April, 1947, with initial production from the Lance Formation and Fox Hills Sandstone. The discovery well was drilled by Phillips Petroleum and Kerr-McGee Oil Industries in SE ¼, SE ¼ of Section 10, T12N, R92W. Initial production was 375 MCFD. Prior to the discovery well, noncommercial gas was encountered in the Wasatch and Fort Union Formations. In 1954, gas was discovered in the “middle sandy member” of the Lewis Shale, today known as the Dad Sandstone. Later discoveries have developed commercial gas in the Mesaverde and Fort Union Formations.
The West Side Canal gas field was discovered in July, 1964, with initial
production from two zones in the Lance Formation (Cronoble, 1969). The discovery well was drilled by Kirby Royalties in SE ¼, SE ¼ of Section 17, T12N, R92W. Initial
production was 375 MCFD. Prior to the discovery well, noncommercial gas was
encountered in the Wasatch and Fort Union Formations. In 1954, gas was discovered in the “middle sandy member” of the Lewis Shale, today known as the Dad Sandstone. Later discoveries have developed commercial gas in the Mesaverde and Fort Union Formations. The West Side Canal gas field was discovered in July, 1964, with initial production from two zones in the Lance Formation. The discovery well was drilled by Kirby Royalties in SE ¼, SE ¼ of Section 17, T12N, R91W. Initial production was 17,000 MCFD from two zones in the middle and lower Lance Formation. Subsequent drilling resulted in commercial discoveries in the Lewis, Fox Hills and Fort Union Formations (Cronoble, 1969). Table 2.1 summarizes the reservoir characteristics of the South Baggs-West Side Canal field.
Recent activities include a natural gas development project being proposed by Merit Energy Company of Dallas, Texas. The project is formally known as the South Baggs Area Natural Gas Project and it proposes to drill and develop up to 50 natural gas wells over a period of approximately 10 years. At the time of writing, the project is currently under review by the U.S. Bureau of Land Management and the Environmental
Table 2.1 Reservoir characteristics for the South Baggs-West Side Canal gas field. Information from limited core analyses, porosities and permeabilities were determined from producing formations. Porosity and permeability values for the Lewis Formation were obtained from the Dad member. Core analysis was performed in the Baggs-Government No. 5 well, C, NE ¼, NW ¼ of Section 8, T12N, R92W. (Modified after Cronoble, 1969).
Formation
Range
Average
Range
Average
Wasatch
21.9 - 31.7
27.5
24.0 - 3970.0
1070.0
Fort Union
25.2 - 34.8
28.5
643.0 - 3129.0
1770.0
Lance
12.5 - 30.3
26.0
33.0 - 1597.0
410.0
Fox Hills
16.8 - 24.9
21.0
1.6 - 259.0
50.0
Lewis
9.3 - 20.1
14.5
0.1 - 1.9
0.3
Mesaverde
Porosity (%)
Permeability (md)
25
Production from the Baggs-West Side Canal field consists primarily of gas with minor amounts of oil and water. Cumulative gas production (through October, 2000) of the South Baggs and West Side Canal gas field is approximately 53.7 BCF and 164.3 BCF, respectively (Petroleum Information Corporation and the Wyoming Oil and Gas Conservation Commission). Figures 2.9 and 2.10 show annual production history information.
Figure 2.9 Annual gas production in BCF from 1968 to June 2000 in the South Baggs gas field. Data from 1968 to 1977 were obtained from the Petroleum Information Corporation, Littleton, Colorado. Data from 1978-2000 were obtained from the Wyoming Oil and Gas Conservation Commission.
South Baggs Production
0.0
0.5
1.0
1.5
2.0
2.5
3.0
3.5
1966
1971
1976
1981
1986
1991
1996
2001
Year
G
as
P
rod
u
ct
ion
(
B
C
F
)
27
Figure 2.10 Annual gas production in BCF from 1968 to June 2000 in the West Side Canal gas field. Data from 1968 to 1977 were obtained from the
Petroleum Information Corporation, Littleton, Colorado. Data from 1978-2000 were obtained from the Wyoming Oil and Gas Conservation
Commission.
West Side Canal Gas Production
0.0
5.0
10.0
15.0
1966
1971
1976
1981
1986
1991
1996
2001
Year
G
as
P
rod
u
ct
ion
(
B
C
F
)
CHAPTER 3
SEISMIC DATA ANALYSIS
Seismic data analysis in this study consisted of two parts: construction of
synthetic seismograms and seismic data interpretation. This chapter discusses all aspects of seismic investigation used in this study
Synthetic Seismograms
A synthetic seismogram is an artificial seismic reflection record manufactured by assuming that a waveform travels though an assumed model (Sheriff, 1994). Synthetic seismograms are computed from wellbore data and are then correlated to seismic data over a particular zone of interest. The wellbore and seismic data are then compared to determine formation tops as well as reflection characteristics.
Using the sonic and density log combinations available for a particular well, a wavelet is convolved with the reflection coefficient to create a synthetic seismic trace. Two zero-phase synthetic seismograms were run, an Ormsby wavelet with a bandpass filter of 10-20-40-60 Hz and an Ormsby wavelet with a bandpass filter of 5-10-60-70 Hz were used. Ed Blott, a consultant in Denver with extensive Rocky Mountain experience, created the synthetic seismograms. By personal communication, he has suggested that the Ormsby wavelet and the chosen filters work very well in the study area. Three of the
29
seven wells used for this study contained density and sonic log combinations necessary to perform synthetics. Figure 3.1 shows a synthetic seismogram in the Meridian #27 well. Appendix 2 shows the other two wells for which synthetics were created. The significant horizons of the Lewis Shale and Fox Hills Sandstone are displayed on this figure. The top of the Almond-Lower Lewis contact is represented by a peak, the Lower Lewis-Dad contact is represented by a trough, the Dad-Upper Lewis contact is represented by a subtle trough and the Fox Hills-Lance contact is represented by a peak. The synthetic seismograms agreed well with the reflectors in the data set. The Dad-Upper Lewis contact was the most difficult horizon to interpret as it exhibited a very weak amplitude on the synthetics and within the data set. The other significant horizons were relatively easy to map with the data set as predicted by the synthetics.
Seismic Data Interpretation
3-D Compressional Wave Data Interpretation
The 3-D seismic data interpretation was performed using Seisworks – 3D interpretation software. After the computation of synthetic seismograms, the formation tops of interest were tied to the seismic data. These formation tops were interpreted within the seismic data set in a 3-D sense. Figure 3.2 is a base map of the seismic data set that shows the locations of seismic lines illustrated in this thesis. Figure 3.3 is an arbitrary seismic line taken from the data set that shows all interpreted horizons. Horizon interpretations were made, at a minimum, every tenth line in the inline and crossline directions for every horizon interpreted. Time structure maps were prepared for every
Figure 3.1 Synthetic seismogram of the Meridian #27 well. Red/Blue seismic is data from study area in the vicinity of this well. Yellow picks are horizons picked in this study. Positive amplitudes are in blue, negative amplitudes are in red and zero crossings are in white. Figure 1.4 shows the location of this well. (1) normal is a zero-phase Ormsby wavelet with a bandpass filter of 10-20-40-60 Hz. (2) normal is a zero phase Ormsby wavelet with a bandpass filter of 5-10-60-70 Hz. (Synthetics were generated by Ed Blott).
31
Figure 3.2 Seismic base map on the top of the Almond time structure showing the locations of seismic lines A – A’, B – B’, C – C’, D – D’ and E – E’. Color scale in ms.
Figure 3.3 Seismic line A – A’ showing significant horizons picked within the data set. Orange lines are interpreted faults. Positive amplitudes are in blue, negative amplitudes are in red and zero crossings are in white. Yellow time markers are shown every 100 ms. Figure 3.2 is the index map that shows the location of this line.
33
interpreted, as well as “intra-seismic amplitude extraction maps.” These maps were made by the successive addition or subtraction of 5 ms of time from each significant horizon to create intra-seismic amplitude extraction maps that can be thought of as pseudo-time slice maps. The objective in creating seismic amplitude extraction maps was to determine if any channel or channel-like features could be found within the zones of interest. If no channel features could be found, the amplitude extraction map was not used. Six isochron maps were generated within the zones of interest. Selected flattened seismic profiles were produced for each horizon within the data set. The listed products derived from the 3-D seismic volume were used to interpret the structural and stratigraphic evolution of the zones of interest within the seismic data set. The data quality in the northwestern corner of the study area is poor, making this area difficult to interpret. Therefore, isochron, time structure and amplitude extraction maps should be considered unreliable in that part of the survey.
Time Structure Maps
Time structure maps were produced for every horizon mapped (Figures 3.4, 3.5, 3.6 and 3.7). The color convention used for all time structure maps is that dark red represents a relative structural high, and light blue indicates a relative structural low. Dark red, linear features are interpreted faults. The Almond Formation represents the most laterally continuous, easily mappable horizon within the data set. Therefore, the structural features observed on the Almond Formation best represent the general trends within the data set. It is the structural complexity of certain areas within the data set, not necessarily varying amplitudes, which make the other horizons difficult to interpret. Discussions regarding structural interpretation patterns within the data set will refer to the Almond time structure. Figure 3.4 is the time structure map of the top of the Almond
Figure 3.4 Almond time structure map. Fault interpretations are in dark red. Travel time in ms.
35
Figure 3.5 Lower Lewis time structure map. Fault interpretations are in dark red. Travel time in ms.
Figure 3.6 Dad time structure map. Fault interpretations are in dark red. Travel time in ms.
37
Figure 3.7 Upper Lewis/Fox Hills time structure map. Fault interpretations are in dark red. Travel time in ms.
Formation. Three main fault trends within the data set include: east-west trending faults in the northern portion of the study area, and northwest and northeast-trending faults in the eastern half of the study area. Other features include a high in the southeastern quadrant bounded by the northwest and northeast trending faults. Three time structure maps: Lower Lewis, Dad and Upper Lewis/Fox Hills (Figures 3.5, 3.6 and 3.7,
respectively) show similar trends as the Almond. However, the Almond time structure map best represents the general structural trends within the data set.
Isochron Maps
Isochron maps were created between the horizons mapped. The color convention used for all isochrons is dark red representing a relative thick grading down to a light blue indicating a relative thin. Figure 3.8 is the Lewis Shale isochron that shows a thickening in the southeastern quadrant of the study area. This area of thickening is bounded by faults to the east and west of the study area. To the east of the easternmost bounding fault is a structural low, which returns to a structural high again, both bounded by faults. Contour intervals are shown every 25 ms, with annotation every 50 ms. The Lower Lewis isochron displays a similar pattern as the Lewis Shale isochron with contour intervals of every 10 ms, and annotation every 20 ms (Figure 3.9). The Dad isochron shows a significant change from the Lewis and Lower Lewis isochrons (Figure 3.10). The thick in the southeastern quadrant is no longer present and the most obvious features are six isolated isochron thick areas. The eastern portion shows a general thinning. Contour intervals for the Dad are every 10 ms, with annotation every 20 ms. The Upper Lewis isochron displays a differential accommodation pattern with respect to the
39
Figure 3.8 Total Lewis isochron. Contour interval is 10 ms with annotation every 20 ms.
Figure 3.9 Lower Lewis isochron. Contour interval is 10 ms with annotation every 20 ms. X and Y represent isochron thicks that may correlate on either side of the fault (dashed line). If so, the lateral offset is approximately 7 mi (11 km).
41
underlying Dad isochron (Figure 3.11). That is, in some areas where the Dad sandstone member shows a thick, the Upper Lewis shows a thin. Conversely, in some areas where the Dad shows a thin, the Upper Lewis shows a thick. Contour intervals of every 10 ms were posted, with annotations every 20 ms. Two additional isochron maps of the top of the Almond – top of the Dad and top of Lower Lewis – top of Upper Lewis were generated (Figures 3.12 and 3.13). The patterns on these two isochron maps display a consistent pattern with the four previously mentioned isochron maps.
Seismic Amplitude Maps
Seismic amplitude maps were produced to search for possible channel features within the Dad member of the Lewis Shale. Two rms velocity amplitude maps were generated that show possible channel features within the Dad. Figure 3.14 is a channel feature 70 ms below the top of the Dad horizon and Figure 3.15 is another channel feature 34 ms above the base of the Dad horizon. Both channel features are faint, not laterally extensive and are located in areas of relative thins on the Lower Lewis and Dad isochrons. Positive amplitude values are shown in blue, negative values in red, and intermediate values in white for both amplitude maps.
Flattened Seismic Horizons
The four seismic horizons interpreted were flattened to show the structural and stratigraphic evolution within the area (Figures 3.16, 3.17 and 3.18 show seismic lines, and Figure 3.2 show the base map). Blue represents positive amplitude and red
43
Figure 3.11 Upper Lewis/Fox Hills isochron. Contour interval is 10 ms with annotation every 20 ms.
Figure 3.12 Top of the Almond to top of the Dad isochron. Contour interval is 25 ms with annotation every 50 ms.
45
Figure 3.13 Top of the Lower Lewis to the top of the Upper Lewis isochron. Contour interval is 25 ms with annotation every 50 ms.
Figure 3.14 Horizon RMS amplitude extraction map 34 ms above the base of the Dad showing a possible channel feature. Positive amplitudes are in blue, negative amplitudes are in red and zero crossings are in white.
47
Figure 3.15 Horizon RMS amplitude extraction map 70 ms below the top of the Dad showing a possible channel feature. Positive amplitudes are in blue, negative amplitudes are in red and zero crossings are in white.
Figure 3.16 Seismic line C – C’ flattened on the top of the Almond. Positive
amplitudes are in blue, negative amplitudes are in red and zero crossings are in white. Yellow time markers are shown every 100 ms. Figure 3.2 is the index map that shows the location of this line.
49
Figure 3.17 Seismic line C – C’ flattened on the top of the Dad. Positive amplitudes are in blue, negative amplitudes are in red and zero crossings are in white. Yellow time markers are shown every 100 ms. Figure 3.2 is the index map that shows the location of this line.
Figure 3.18 Seismic line D – D’ flattened on the top of the Upper Lewis/Fox Hills. Positive amplitudes are in blue, negative amplitudes are in red and zero crossings are in white. Yellow time markers are shown every 100 ms. Figure 3.2 is the index map that shows the location of this line.
51
illustrates what was observed in the isochron and time structure maps. A significant thick is observed in the Lower Lewis in addition to a relatively smaller thick in the Dad, with this area bounded by northwest and northeast trending faults observed on the time structure maps. The overlying Upper Lewis is relatively flat. Figures 3.16 and 3.18, flattened on top of the Upper Lewis and Almond, respectively, show a similar pattern. Figure 3.19 is flattened on the top of the Lower Lewis. This section shows possible clinoforms within the Dad that prograde to the northeast.
Discussion
Stratigraphic Interpretation
Figure 3.19 is an arbitrary, flattened seismic line on the top of the Lower Lewis oriented northeast – southwest. This image shows apparent clinoforms in the Dad Sandstone that prograde from the southwest to the northeast, indicative of a southwest sediment source. Figure 3.20 is an amplitude extraction map through the middle of the clinoforms showing northwest-southeast trending features that may indicate clinoform progradation to the northeast. An alternative interpretation could be that lobe edges or channels and sedimentation are orthogonal to the interpreted clinoform direction.
Figures 3.14 and 3.15 are two rms amplitude extraction maps taken 70 ms below the top of the Dad and 34 ms above the base of the Dad, respectively. These amplitude extraction maps show the presence of possible channels within the Dad Member of the Lewis Shale. Because these channel features are laterally confined to an area of less than 10 miles, a possible source direction cannot be inferred. It is likely that these channel
Figure 3.19 Seismic line E – E’ flattened on the top of the Upper Lewis showing a northeast progradation. Positive amplitudes are shown in blue, negative amplitudes are shown in red and zero crossings are shown in white. Yellow time markers are shown every 100 ms. Figure 3.2 is the index map that shows the location of this line.
53
Figure 3.20 Pseudo time slice through clinoforms. Figure 3.2 is the index map that shows the location of this line.
features can be laterally traced in the subsurface, however possible reasons why they cannot be seen in the subsurface include: 1) channel features are below the resolution of the seismic data, 1/4, 2) the areas where channel features occur cannot be mapped because they are highly faulted, or 3) the methodology used for extracting “intra-seismic amplitude” maps progressively deviates from the original horizontal surface from which they were extracted.
Isochron maps show that faulting played a significant role in sedimentation within the study area. The Lower Lewis isochron (Figure 3.9) exhibits a pronounced thick area in the easternmost portion of the study area, suggesting that during the sedimentation of Lower Lewis sediments this area exhibited a relative structural low. During deposition of the Dad Sandstone, this area continued to be a relative structural low, but not as
significant as the Lower Lewis sediments. By the time of Upper Lewis deposition, faulting ceased to play a significant role in sedimentation.
Structural Interpretation
Local structural features observed within the data set are interpreted to be the result of deformation related to left-lateral movement on a subsurface wrench fault. These features agree well with structural patterns predicted by Harding (1974) and McClay (2001), and locally disagree with the observations of Bader (1987). The
interpreted Landsat photo by Bader shows the lack of interpreted faults around the area of this study. It is possible that structural features at the surface, on a regional level, agree with a right-lateral wrench model.
Landsat imagery interpreted by Bader (1987) indicates the surface expression of a right-lateral wrench fault that transects the study area and manifests itself on the surface as the Cherokee Ridge Arch. This wrench fault is interpreted here to be the western
55
extension of the Cheyenne Belt. The Cheyenne Belt is interpreted by Karlstrom (1998) to be the result of Precambrian sutures. It has been postulated by others (Stone, 1977) that these Precambrian sutures of the Cheyenne Belt have been reactivated episodically during the Phanerozoic. Within the study area, Bader (1987) asserted that movement along this lineament may represent both left-lateral and right-lateral offset during the Phanerozoic.
This study investigates a relatively small, highly deformed portion of a larger wrench fault system. Determining where the study area lies in relation to previous wrench fault work in the area (Bader, 1987) proves a to be a significant challenge in this study. Furthermore, determining the sense of displacement on the master wrench fault proved to be difficult as a result of the scale of this study. Scaled sandbox models
performed by McClay and Bonora (2001) seem to provide a good analog to the structural features observed within the study area. Figure 3.21A is a map view of the top surface of a model performed by McClay and Bonora (2001). This experiment shows the structural deformation observed after 10 cm of displacement, where every centimeter represents 1 kilometer. The study area is interpreted to be located within the yellow rectangle. The triangular pop-up structure, bounded by northwest and northeast trending faults looks similar to the structural features observed within the eastern half of the study area. Figure 3.4 shows the Almond time structure map. Folds and dip directions interpreted from the sand box models (Figure 3.21B) also appear on the Almond time structure. The
northwest trending fold in the eastern portion of the study area agrees with the patterns predicted by Harding (1974) for a left-lateral wrench system (Figure 3.22). Following the color bar conventions used for the Almond time structure, the general dip trends interpreted within the sandbox models also agree well with the Almond time structure. The master wrench fault interpreted by Bader (1987) and the main wrench fault in the sandbox models by McClay and Bonora (2001) lie in the northwest corner of the data set. This fault occurs north of the intersection of the northwest and northeast trending faults in
Figure 3.21A Top of sandbox model. (From McCLay and Bonora, 2001).
Figure 3.21B Interpreted sandbox model of Figure 3.21A. (From McCLay and Bonora, 2001).
57
seismic interpretations agree well. However, there are significantly more faults
interpreted within the study area than are observed within the sandbox models. McClay and Bonora (2001) noted in their experiments that when the distance between opposing forces is reduced from 10 cm to 5 cm, the complexity of internal structure is increased and the pop-up structures are more pronounced. It is interpreted that the distance between opposing forces related to wrench faulting in the study area is relatively close, less than 6 mi (10 km), and can easily explain the increased number of interpreted faults within the study area.
The timing of wrench fault movement within the study area can be interpreted from isochron maps. The Lower Lewis isochron (Figure 3.9) shows a significant time thick in the area bounded by the northwest and northeast trending faults. This suggests that during deposition of the Lower Lewis sediments, the wrench fault and related faulting was active. By the time of Dad deposition (Figure 3.10), faulting was not as significant. By the time of the Upper Lewis/Fox Hills deposition (Figure 3.11),
movement on the faults ceased altogether. Although movement on faults can be inferred from the isochron maps during Lewis Shale deposition, it does not preclude recurrent movement on these same faults during subsequent Laramide compression or Tertiary extension. The amount of offset that can be observed from features on opposite sides of the northeast faults on the Lower Lewis isochron is approximately 7 mi (11 km).
The Lower Lewis isochron time thick and the Almond time structure represents what is interpreted to be an inverted basin. That is, a relative low area that was
accommodating sedimentation is now uplifted and represents a relative high. Within the study area, the Lower Lewis isochron relative thick represents the low and the Almond time structure in the same area as the Lower Lewis isochron is now a structural high.
Three dominant sets of fault trends are interpreted within the data set that are believed to be a part of a wrench system. These faults are oriented east-west, 90, northeast, 60, and northwest, 330, from north. The master wrench fault runs east-west
59
or 90. Northeast trending faults represent Riedel Shear (R) faults in this left-lateral wrench system. These faults are predicted by Harding (1973) to occur at angles of 10-30 to the master fault. In this study, these faults make an angle of 30 with the master wrench fault. Northwest trending faults do not fit well with the predicted patterns of Harding, however they may represent conjugate Riedel Shears (R’), as shown in figure 2.8. These faults are predicted to occur at angle of 10-30 to the master fault. In this study, these faults are interpreted to occur at an angle of 60 to the master fault. Figure 3.23 is seismic line B-B’ that shows the presence of flower structures. Flower structures are one of the diagnostic criteria for the identification of wrench faulting.
Changes in stress orientation have occurred in the area. There was an
approximate east-west shortening during the Late Cretaceous, which may have changed to north-south shortening during the Eocene (Gries, 1983). The present-day northwest-oriented maximum horizontal stress represents another change (Lorenz, 1995; Rahmat, 2000). The conclusion is that changing stress orientations may have given rise to structural inversion in the study area.
South Baggs – West Side Canal Gas Field
Several observations offer insight concerning the presence and production of commercial hydrocarbons within the study area. The thick intervals observed on the Lower Lewis and Dad Member isochron maps, which are bounded by faults, correspond to areas of production within the South Baggs gas field. It appears that the northwest trending fault in the eastern portion of the study area, which bounds the isochron thick intervals in the Lower Lewis and Dad, is the boundary between the South Baggs and West Side Canal gas fields.
Figure 3.23 Seismic line B-B’ showing a flower structure observed within the data set. Positive amplitudes are shown in blue, negative amplitudes are shown in red and zero crossings are shown in white. Figure 3.2 is the index map that shows the location of this line.
61
intervals. Faulting may have increased natural fracture quantity, which could increase or decrease permeability, depending on whether the fractures are open or healed.
Well name versus initial production rates are shown in Table 3.1. The Amoco #2 and Huber #1 wells indicate initial production from the Madison and Wasatch
formations, respectively. The other wells indicate initial production from the Lewis with one well, Phillips #1, indicating zero production. The wells with production are in close proximity to faults interpreted with the Lewis Shale intervals. The Phillips #1 well is in the middle of the triangular pop-up structure, as discussed previously, and far away from interpreted faults. This observation indicates that faults may have a significant influence on permeability and production. Furthermore, areas of production within Lewis intervals are located within the relative time thicks of the Lower Lewis and Dad members,
indicating that faults may have had a significant influence on production within the study area. One of my recommendations for future work involves a more careful study of the relationship between faulting and production in the area.
Table 3.1 Initial production in MCFD from the wells used in this study. Data obtained from the Wyoming Oil and Gas Conservation Commission.
Amoco 2 490072059800 920^ Huber #1 490072014100 3600# Meridian #27 490072124200 730* Meridian #31 490072146700 2* Phillips #1 490070501700 0 Phillips #2 490070501800 10* Phillips #3 490070502500 384*
Well Name API Number Initial Production (MCFD)
* Production from Lewis ^ Production from Madison # Production from Wasatch
63
CHAPTER 4
CONCLUSIONS AND RECOMMENDATIONS
Conclusions
The following conclusions are drawn from this study:
Locally, the Cherokee Ridge Arch is the surface expression of a left-lateral wrench fault system. This wrench fault system is interpreted to be the western extension of the Cheyenne Belt, a Precambrian suture zone.
Synthetic seismograms created for 3 wells show a match to reflectors in data set. The Almond was the best, most continuous reflector. Four horizons were mapped and presented as time structure maps.
Three dominant sets of fault trends within the data set were interpreted. These faults are oriented east-west, 90, northeast, 60, and northwest, 330, from north. The master left-lateral wrench fault run east-west or 90, northeast trending faults represent Riedel Shea (R) faults. Northwest trending faults do no fit well with predicted patters, but they may represent conjugate Riedel Shears (R’). Flower structures within the data set are evidence of wrench faulting.
Isochron maps show that faulting played a significant role in sedimentation within the study area. Lower Lewis and Dad Sandstone members exhibit a time thick that is bounded by faults in isochron maps produced, suggesting that during the sedimentation of Lower Lewis sediments this area exhibited a relative structural low. The Upper Lewis isochron map exhibits no significant time thicks, which suggests faults ceased to play an active role in sedimentation.
Deposition preferentially occurred within a down-dropped fault block on the southeastern side of the study area. The area was later elevated to a structural high by structural inversion. Changes in stress orientation observed within the study area resulted in structural inversion.65
Recommendations
Recommendations for future work include:
Interpret a more areally extensive 3-D seismic data set to get a broader view of the Cherokee Ridge structure.
Obtain a complete digital log suite and interpret a grid of cross sections that is then integrated with the seismic data.
Further integrate well data with production histories and correlate this to seismic interpretations.REFERENCES CITED
Asquith, D. O., 1970, Depositional topography and major marine environments, late Cretaceous, Wyoming: AAPG Bulletin, v. 54, p. 1184-1224.
Bader, J. W., 1987, Surface and subsurface structural relations of the Cherokee Ridge Arch, south-central Wyoming: Unpublished M.S. Thesis, San Jose State University, San Jose, California, 68 p., 7 plates.
Biddle, K. T., and Christie-Blick, N., 1985, Deformation and basin formation along Strike-Slip Faults: in Biddle, K. T., and Christie-Blick, N., ed., Strike-Slip
Deformation, Basin Formation, and Sedimentation, SEPM Special Publication 37, p. 1-34.
Brown, W. G., 1984, Basement involved tectonics – foreland areas: AAPG, Continuing Education Course Note Series 26, 92 p.
Bryant, B., 1985, Structural ancestry of the Uinta Mountains: in Picard, M. D., ed., Geology and energy resources, Uinta basin of Utah, Utah Geological Association Publication 12, p. 115-120.
Cronoble, J. M., 1969, Geology of the South Baggs – West Side Canal gas field, Carbon County, Wyoming and Moffat County, Colorado: Unpublished M.S. Thesis, Colorado School of Mines, Golden, Colorado, 46 p., 7 plates.
Cronoble, J. M., 1969, South Baggs-West Side Canal gas field, Carbon County, Wyoming and Moffat County, Colorado: in Barlow, J. A., ed., Wyoming Geological Association Guidebook, 21st Annual Field Conference, p. 121-137.
Duebendorfer, E. M., and Houston, R. S., 1986, Kinematic history of the Cheyenne belt: A Proterozoic suture in southeastern Wyoming: Geology, v. 14, p. 171-174.
Gill, J. R., Merewether, E. A., and Cobban, W. A., 1970, Stratigraphy and nomenclature of some upper Cretaceous and lower Tertiary rocks in south-central Wyoming: U.S. Geological Survey Professional Paper 667, 53 p.
Gries, R., 1983, North-south compression of Rocky Mountain foreland structures: in Lowell, J. D., ed., Rocky Mountain foreland basins and uplifts, Rocky Mountain Association of Geologists, p. 9-32.
67
Hale, L. A., 1961, Late Cretaceous (Montanan) stratigraphy eastern Washakie basin Carbon County, Wyoming: in Wiloth, G. J., ed., Wyoming Geological Association Guidebook, 16th Annual Field Conference, p. 129-137.
Harding, T. P., 1974, Petroleum traps associated with wrench faults: AAPG Bulletin, v. 58, p. 1290-1304.
Hills, F. A., and Houston, R. S., 1979, Proterozoic tectonics of the central Rocky Mountains, North America: Contributions to Geology, v. 17, p. 89-109.
Karlstrom, K. E., Flurkey, A. J., and Houston, R. S., 1983, Stratigraphy and depositional setting of the Proterozoic Snowy Pass Supergroup, south eastern Wyoming: Record of an early Proterozoic Atlantic-type cratonic margin: GSA Bulletin, v. 94, p. 1257-1274.
Karlstrom, K. E., and Houston, R. S., 1984, The Cheyenne belt; Analysis of a Proterozoic suture in southern Wyoming: Precambrian Research, v. 25, p. 415-446.
Karlstrom, K. E., and Humphreys, E. D., 1998, Persistent influence of Proterozoic accretionary boundaries in the tectonic evolution of southwestern North America: Interaction of cratonic grain and mantle modification events: Rocky Mountain Geology, v. 33, No. 2, p. 161-179.
Law, B. E., and Barnum, B. E., 1979, Wrench faulting and hydrocarbon occurrence in northwestern Powder River basin, Montana and Wyoming [abs.]: AAPG Bulletin, v. 63, p. 833-834.
Lorenz, J. C., 1995, Stresses and fractures in the Frontier Formation, Green River Basin, predicted from basin-margin tectonic element interactions: in Jones, R. W., ed., Resources of southwestern Wyoming: WGA guidbook, p. 45-60).
McClay, B., and Bonora, M., 2001, Analog models of restraining stepovers in strike-slip fault systems: AAPG Bulletin, v. 85, p. 233-260.
Nelson, W. J., and Krause, H. F., 1981, The Cottage Grove fault system in southern Illinois: Illinois State Geological Survey, Circular 522, 65 p., 1 plate.
Parker, J. M., and Bortz, L. C., 2001, West Side Canal gas field, Carbon county, Wyoming: The Mountain Geologist, v. 38, no. 4, p. 211-224.
Rahmat, Nor Ainulhuda Mazniz Nor, 2000, Borehole image analysis of the Cretaceous Lewis Shale, Sand Wash Basin, Moffat County, Colorado: Unpublished M.S. Thesis, Colorado School of Mines, Golden, Colorado, 156 p.
Robinson, L. N., and Barnum, B. E., 1986, Southeastern extension of the Lake Basin fault zone in south-central Montana: Implications for coal and hydrocarbon exploration: The Mountain Geologist, v. 23, p. 37-44.
Schell, E. M., ed., 1973, Wyoming Geological Association 25th field conference
guidebook: Symposium and core seminar on the geology and mineral resources of the Greater Green River basin, Casper, Wyoming, 245 p.
Sheriff, R. E., 1994, Encyclopedic dictionary of exploration geophysics.
Stone, D. S., 1969, Wrench faulting and Rocky Mountain tectonics: The Mountain Geologist, v. 6, p. 67-79.
Thelin, G. P. and Pike, 1991, Landforms of the conterminous United States: Digital shaded relief portrayal. U.S. Geological Survey, Denver, Colorado, Map.
Thomas, G. E., 1971, Continental plate tectonics: southwest Wyoming: in Renfro, A. R., ed., Wyoming Geological Association Guidebook, 23rd Annual Field Conference, p. 103-124.
United States Environmental Protection Agency: Internet web site: http://www.epa.gov/
Weimer, R. J., 1970, Rates of deltaic sedimentation and intrabasin deformation, Upper Cretaceous of Rocky Mountain region: in Morgan, J. P., ed., Deltaic
sedimentation modern and ancient, SEPM Special Publication 15, p. 270-292.
Wilcox, R. E., Harding, T. P., and Seely, D. R., 1973, Basic wrench tectonics: AAPG Bulletin, v. 57, p. 74-96.
Winn, R. D., Jr., Bishop, M. G., and Gardner, P. S., 1985, Lewis Shale, south-central Wyoming: shelf, delta front, and turbidite sedimentation: Wyoming Geological Association Guidebook, 36th Annual Field Conference, p. 113-130.
Wyoming Bureau of Land Management
69
Wyoming Oil and Gas Conservation Commission. Internet web site: http://wogcc.state.wy.us/
Zahm, C. K., P. H. Hennings, E. A. Erslev, and N. F. Hurley, 2001, Beyond the cross section: 3D deformation of classic foreland structures, Wyoming, Field Trip Guidebook, AAPG Field Trip #2; AAPG 2001 Annual Meeting, Denver, CO, 146p.
Zoback, M. L., and Zoback, M. D., 1989, Tectonic stress field of the continental U.S.: in Pakiser, L. C. and Mooney, W. D., eds., Geophysical framework of the
APPENDIX 1 DETAILED PROCESSING FLOW
1) Transfer from SEG D
2) Preprocessing
a) Geometry application and survey merge b) Spherical divergence compensation (T**2.0) c) Elevation statics computation
Datum: 6600 ft
Correctional velocity: 8500 ft/sec
d) 3-D gridding: 110 ft x 110 ft cells e) Trace balance: Window 200-4000 ms
f) Offset RAAC: Residual time and offset amplitude compensation
3) Surface-consistent deconvolution
a) Operator length: 160 ms
b) Computation window: Below first breaks to 3500 ms
c) White noise: 0.01%
d) Trace balance: Window 200 ms below first breaks to 4000 ms
4) Time variant spectral whitening: 10-100 Hz
5) Trace balance: Window 500-6000 ms
6) Zone anomaly processor (ZAP): Attenuation of excessive amplitudes
7) Offset RAAC: Residual time and offset amplitude compensation
8) Trace balance: Window 500-6000 ms
9) Sort to cell order
10) Refraction statics
Gauss-seidel based travel-time analysis with reciprocal velocity analysis
a) Datum: 6600 ft
b) Weathering velocity: 5000 ft/sec c) Correctional velocity: 8500 ft/sec d) Offset range: 4250-6500 ft
71
11) Velocity analysis: half-mile grid
12) Surface consistent residual statics
13) Velocity analysis: half-mile grid
14) Surface consistent residual statics
15) Velocity analysis: half-mile grid
16) DMO velocity analysis: half-mile grid
17) NMO correction 18) Mute a) Mute function: Time (ms) Offset (ft) 0 650 10 660 300 990 500 2530 1200 7810 2400 13300
16) EQDMO and stack: a) Full DMO stack:
b) DMO equalization applied
17) RNA (Random Noise Attenuation): f-xy deconvolution
18) Premigration vertical scaling: RAC
19) Single (minimum) function Stolt migration
20) Residual migration
- two-pass finite-difference migration
APPENDIX 2 Meridian #31 Synthetic Seismogram
Appendix 2 Synthetic seismogram of the Meridian #31 well. (1) normal is a zero-phase Ormsby wavelet with a bandpass filter of 10-20-40-60 Hz. (2) normal is a zero phase Ormsby wavelet with a bandpass filter of 5-10-60-70 Hz.
73
Amoco #2 Synthetic Seismogram
Appendix 2 Synthetic seismogram of the Amoco #2 well. (1) normal is a zero-phase Ormsby wavelet with a bandpass filter of 10-20-40-60 Hz. (2) normal is a zero phase Ormsby wavelet with a bandpass filter of 5-10-60-70 Hz.