AEROMAGNETIC SIGNATURE OF THE GEOLOGY AND MINERAL RESOURCES NEAR THE PEBBLE PORPHYRY CU-AU-MO DEPOSIT, SOUTHWEST ALASKA
by Eric D. Anderson
ii
A thesis submitted to the Faculty and the Board of Trustees of the Colorado School of Mines in partial fulfillment of the requirements for the degree of Doctor of Philosophy (Geology).
Golden, Colorado Date Signed: Eric D. Anderson Signed: Dr. Wei Zhou Thesis Advisor Golden, Colorado Date Signed: Dr. Paul Santi Professor and Interim Department Head of Geology and Geological Engineering
iii ABSTRACT
Aeromagnetic data are used to better understand the geology and mineral resources near the Late
Cretaceous Pebble porphyry Cu-Au-Mo deposit in southwestern Alaska. The reduced-to-pole (RTP) transformation of regional-scale aeromagnetic data show that the Pebble deposit is within a cluster of magnetic anomaly highs. Similar to Pebble, the Iliamna, Kijik, and Neacola porphyry copper occurrences are in magnetic highs that trend northeast along the crustal-scale Lake Clark fault. A high-amplitude, short- to moderate-wavelength anomaly is centered over the Kemuk occurrence, an Alaska-type ultramafic complex. Similar anomalies are found west and north of Kemuk. A moderate-amplitude, moderate-wavelength magnetic low surrounded by a moderate-amplitude, short-wavelength magnetic high is associated with the gold-bearing Shotgun intrusive complex.
The RTP transformation of the district-scale aeromagnetic data acquired over Pebble permits differentiation of a variety of Jurassic to Tertiary magmatic rock suites. Jura-Cretaceous basalt and gabbro units and Late
Cretaceous biotite pyroxenite and granodiorite rocks produce magnetic highs. Tertiary basalt units also produce magnetic highs, but appear to be volumetrically minor. Eocene monzonite units have associated magnetic lows. The RTP data do not suggest a magnetite-rich hydrothermal system at the Pebble deposit.
The 10 km upward continuation transformation of the regional-scale data shows a linear northeast trend of magnetic anomaly highs. These anomalies are spatially correlated with Late Cretaceous igneous rocks and in the Pebble district are centered over the granodiorite rocks genetically related to porphyry copper systems. The spacing of these anomalies is similar to patterns shown by the numerous porphyry copper deposits in northern Chile. These anomalies are interpreted to reflect a Late Cretaceous magmatic arc that is favorable for additional discoveries of Late Cretaceous porphyry copper systems in southwestern Alaska.
Aeromagnetic data help to understand the three-dimensional distribution of plutonic rocks near the Pebble porphyry copper deposit. Magnetic susceptibility measurements show that rocks in the Pebble district are more magnetic than rocks of comparable compositions in the Pike Creek-Stuyahok Hills volcano-plutonic complex. The reduced-to-pole transformation of the aeromagnetic data demonstrates that the older rocks in the Pebble district produce strong magnetic anomaly highs. The tilt derivative transformation highlights a strong, northeast-trending structural grain attributed to Tertiary volcanic rocks. Multiscale edge detection maps near-surface magnetic sources that are mostly outward dipping and coalesce at depth in the Pebble district. The total horizontal gradient of the 10 km upward continued magnetic data map a circular, deep magnetic contact along which the porphyry deposits occur.
Forward and inverse magnetic modeling show that the magnetic rocks in the Pebble district extend to depths greater than 9 km. The magnetic inversion is constrained by a near-surface, three-dimensional geologic model that is attributed with measured magnetic susceptibilities from various rock types in the region. The inversion results indicate that several near-surface magnetic features with moderate susceptibilities converge with depth into magnetic bodies with higher susceptibilities. This deep magnetic source appears to rise towards the surface in several areas. An isosurface value of 0.02 SI is used to depict the magnetic contact between outcropping granodiorite and non-magnetic sedimentary host rocks. The contact is shown to be outward dipping. At depths around 5 km nearly the entire model exceeds the isosurface value indicating the limits of non-magnetic host
iv
material. The inversion results show the presence of a relatively deep, northeast trending magnetic low that parallels lineaments mapped by the tilt derivative. This deep low represents a strand of the Lake Clark fault.
The geodynamic setting of an accreted island-arc terrane represent a region in which several types of mineral resources may occur. The mineral resources from southwest Alaska are classified into greenstone-hosted, oxidized intrusion-related, reduced intrusion-related, and epithermal. Aeromagnetic data are related to the classified mineral resource and outcropping geology to better understand the distribution of gold-rich mineral resources.
Three magnetic domains are defined by the reduced-to-pole, upward continue, and tilt derivative transforms. The greenstone-hosted mineral resources that include VMS are mapped along magnetic lineaments mostly landward of the accreted island-arc. The oxidized intrusion-related mineral resources that include porphyry copper, skarn, and Alaska-type ultramafic-mafic complexes occur along magnetic anomaly highs in the Peninsular and Kahiltna domains. Characteristic short wavelength, high amplitude magnetic anomalies suggest additional Alaska-type ultramafic-mafic complexes and skarn resources in the Kahiltna and Kuskokwim domain. Magnetic depth estimates indicate potential greenstone-hosted and oxidized intrusion-related resources occur beneath 100 m of glacial deposits. Reduced intrusion-related resources are best imaged in the more landward, Kuskokwim magnetic domain. Epithermal resources are not well imaged. The mineral potential map highlights areas most favorable for additional mineral resources.
v
TABLE OF CONTENTS
ABSTRACT ... iii
LIST OF FIGURES ... vii
LIST OF TABLES...ix
ACKNOWLEDGEMENTS ... x
CHAPTER 1. GENERAL INTRODUCTION ... 1
1.1 References ... 3
CHAPTER 2. GEOLOGICAL ANALYSIS OF AEROMAGNETIC DATA FROM SOUTHWESTERN ALASKA: IMPLICATIONS FOR EXPLORATION IN THE AREA OF THE PEBBLE PORPHYRY CU-AU-MO DEPOSIT 2.1 Abstract ... 4
2.2 Introduction ... 4
2.3 Regional Geology ... 5
2.4 Known Mineral Occurrences in the Pebble Region ... 7
2.5 Geology of the Pebble District ... 8
2.6 Aeromagnetic Data ... 10
2.6.1 Regional-scale Aeromagnetic Data from Southwestern Alaska ... 11
2.6.2 Aeromagnetic Data from the Pebble District ... 14
2.7 Discussion ... 18
2.8 Conclusions ... 23
2.9 Acknowledgements ... 24
2.10 References ... 24
CHAPTER 3. THREE-DIMENSIONAL DISTRIBUTION OF IGNEOUS ROCKS NEAR THE PEBBLE PORPHYRY CU-AU-MO DEPOSIT IN SOUTHWESTERN ALASKA: CONSTRAINTS FROM REGIONAL-SCALE AEROMAGNETIC DATA ... 28
3.1 Abstract ... 28 3.2 Introduction ... 28 3.3 Regional Geology ... 29 3.4 Local Geology ... 30 3.5 Aeromagnetic Data ... 32 3.5.1 Reduced-To-Pole Transformation ... 33 3.5.2 Tilt Derivative ... 34
3.5.3 Multiscale Edge Detection ... 36
3.5.4 Total Horizontal Gradient of 10 km Upward Continued Data ... 36
3.5.5 Magnetic Modeling ... 37 3.5.5.1 2.5-D Forward Modeling ... 38 3.5.5.2 3-D Inverse Modeling ... 40 3.6 Discussion ... 45 3.7 Conclusion ... 50 3.8 Acknowledgements ... 51
vi
3.9 References ... 51
CHAPTER 4. AEROMAGNETIC DATA CHARACTERIZE GOLD-RICH RESOURCES IN AN ACCRETED ISLAND-ARC TERRANE: AN EXAMPLE FROM SOUTHWEST ALASKA ... 53
4.1 Abstract ... 53 4.2 Introduction ... 53 4.3 Regional Geology ... 54 4.4 Local Geology ... 55 4.5 Methodology ... 58 4.5.1 Mineral Resources ... 58 4.5.1.1 Greenstone-hosted ... 59 4.5.1.2 Oxidized Intrusion-related ... 60 4.5.1.3 Reduced Intrusion-related ... 66 4.5.1.4 Epithermal ... 67 4.5.2 Aeromagnetic Data ... 69 4.5.2.1 Reduced-to-Pole ... 70
4.5.2.2 Upward Continuation and Total Horizontal Gradient ... 70
4.5.2.3 Tilt Derivative ... 71
4.5.2.4 Short Wavelength, High Amplitude Anomalies... 72
4.5.2.5 Depth Estimates ... 74 4.6 Results ... 74 4.6.1 Greenstone-hosted ... 78 4.6.2 Oxidized Intrusion-related ... 78 4.6.3 Reduced Intrusion-related ... 79 4.6.4 Epithermal... 79
4.6.5 Short Wavelength, High Amplitude Anomalies ... 80
4.6.6 Depth Estimates ... 80 4.7 Discussion ... 82 4.8 Conclusions ... 86 4.9 Acknowledgements ... 87 4.10 References ... 87 CHAPTER 5. CONCLUSIONS ... 92
5.1 Comparison of Magnetic Inversion Results and Drill Hole Magnetic Susceptibility Measurements... 92
5.2 General Conclusions ... 94
5.3 Recommendations for Future Research ... 95
5.4 References ... 96
vii
LIST OF FIGURES
Figure 2.1 Location and regional geology maps of southwestern Alaska ... 6
Figure 2.2 Generalized geologic map of the Pebble district ... 9
Figure 2.3 Map showing the reduced-to-pole (RTP) transformed aeromagnetic data ... 13
Figure 2.4 Map showing aeromagnetic data upward continued to 10 km ... 15
Figure 2.5 Map showing reduced-to-pole (RTP) transformed aeromagnetic data for the Pebble district... 16
Figure 2.6 Cross section A-A’ through the Pebble deposit ... 17
Figure 2.7 Magnetic field profile B-B’ across the Pebble district ... 18
Figure 2.8 Comparison of the interpreted magnetic data sets over the Pebble district ... 19
Figure 2.9 Spatial comparison of porphyry copper deposits in northern Chile and southwestern Alaska ... 22
Figure 2.10 Map showing compilation of aeromagnetic data upward continued to 10 km ... 23
Figure 3.1 Geology map of the Pebble district and Pike Creek-Stuyahok Hills area ... 30
Figure 3.2 Reduced-to-pole magnetic anomaly map of the Pebble district and Pike Creek-Stuyahok Hills area ... 34
Figure 3.3 Tilt derivative map in the Pebble district and Pike Creek-Stuyahok Hills area ... 35
Figure 3.4 Multiscale edge detection analysis of the Pebble district and the Pike Creek-Stuyahok Hills area ... 37
Figure 3.5 Total horizontal gradient of the 10 km upward continued reduced-to-pole data in the Pebble district and Pike Creek-Stuyahok Hills area ... 38
Figure 3.6 2.5-D forward model of rock units with generalized geometries ... 39
Figure 3.7 2.5-D forward model centered on the Kaskanak batholith in the Pebble district ... 40
Figure 3.8 Geologic model used to constrain magnetic susceptibilities during the 3-D magnetic inversion process .. 41
Figure 3.9 A plot of the Tikhonov curve ... 43
Figure 3.10 Maps showing the observed and predicted magnetic responses from Run 4003 ... 43
Figure 3.11 Preferred result of the 3-D magnetic inversions ... 44
Figure 3.12 Depth slices from the results of the 3-D magnetic inversions ... 48
Figure 4.1 Lithotectonic terrane map of southern Alaska and northwestern Canada ... 55
Figure 4.2 Geology map of southwest Alaska ... 56
Figure 4.3 Map showing reduced-to-pole transformed magnetic data for southwest Alaska ... 70
Figure 4.4 Map showing 10 km upward continue transformed magnetic data for southwest Alaska ... 71
Figure 4.5 Map showing the tilt derivative transformed magnetic data for southwest Alaska ... 72
Figure 4.6 Magnetic anomalies of Alaska-type ultramafic-mafic complexes in southwest Alaska ... 73
Figure 4.7 Map of structural indices calculated during the two-step Euler depth analysis ... 75
Figure 4.8 Results of two-step Euler depth analyses of residual magnetic field data over the Kemuk and Audn areas ... 76
Figure 4.9 Results of two-step Euler depth analyses of residual magnetic field data over the Okstukuk Hills and North Kemuk areas ... 77
viii
Figure 5.1 Comparison between measured magnetic susceptibility values on drill holes and preferred magnetic inversion results presented in Chapter 3 ... 93
ix
LIST OF TABLES
Table 2.1 Mineral deposits and occurrences in southwestern Alaska ... 8
Table 2.2 Magnetic susceptibility of common igneous rocks ... 11
Table 2.3 Survey specifications for regional- and district-scale aeromagnetic data sets ... 12
Table 3.1 Summary of magnetic susceptibility measurements on igneous rocks in the Pebble region ... 31
Table 3.2 Parameters for the near-surface geologic model ... 42
Table 3.3 Results of the series of 3-D magnetic inversions ... 42
Table 4.1 Greenstone-hosted deposits and occurrences ... 59
Table 4.2 Oxidized intrusion-related deposits and occurrences ... 60
Table 4.3 Reduced intrusion-related deposits and occurrences ... 66
x
ACKNOWLEDGEMENTS
The Pebble Limited Partnership between Northern Dynasty Minerals and Anglo American are thanked for access to data and logistical support during our field campaigns. This work was funded by the Concealed Deposits project carried out by the Mineral Resource Program at the United States Geological Survey (USGS). This work could not have been completed without the support of several scientists at the USGS. Bob Eppinger, Karen Kelley, and Rich Goldfarb are thanked for both encouraging me to pursue this project and enlightening me with thoughtful, scientific conversations that led to a better understanding of the geology and mineral resources in southwest Alaska. Paul Bedrosian is thanked for putting up with me in the field and teaching me new geophysical surveying
techniques. In addition, our conversations of the puzzling Alaska geology and what the geophysical anomalies mean were truly valuable.
Thesis committee members at Colorado School of Mines are thanked for all their efforts that led to completion of this project. Ron Cohen helped me stay on schedule and see the light at the end of the tunnel. Misac Nabighian was instrumental in processing aeromagnetic data and helping me understand what the data may represent. Thomas Monecke kept me on track and greatly helped focus the project. Murray Hitzman taught me the significance of reaching beyond the traditional mineral deposits literature to better understand geological problems as a whole. Wendy Zhou helped instill much needed self-confidence and taught me the importance of project design and implementation. Although not a committee member, Yaoguo Li is thanked for explaining the proper way to address, and assess, a magnetic inversion problem.
I’d also like to thank my family for their support during this project. My mother and father have always stressed the importance of education. My brothers and sister have encouraged me along the way. My two kids Kaitlin and Jacob and their smiling faces helped get me through difficult times. Lastly, my wife Jenny is thanked for her patience and understanding. I assure you that I will no longer have Alaska geology, mineral resources, or geophysics on my mind during any of our future conversations.
1
CHAPTER 1. GENERAL INTRODUCTION
The Late Cretaceous (~90 Ma) Pebble Cu-Au-Mo porphyry deposit in southwestern Alaska has a current measured and indicated resource of 5,940 Mt at 0.42 percent copper, 0.35 g/t gold, and 0.025 percent molybdenum, with a 0.30 wt percent copper cut-off making it one of the largest resources of copper and gold in the world (Lang et al., 2013). The discovery of the Pebble deposit opens up a large area of southwest Alaska for porphyry copper exploration. The deposit is almost entirely concealed by Quaternary glacial cover. In addition, Tertiary volcanic and sedimentary units overly the eastern part of the deposit. The relatively small outcrop of such a large deposit
suggests that a comprehensive geologic framework is fundamental in understanding the origin of the deposit and the potential for discovery of similar deposits in the area and throughout the world.
At a regional scale, porphyry deposits occur within linear, typically orogen-parallel magmatic belts, which range in length from a few tens to thousands of kilometers (Sillitoe, 2010). However, it has been suggested that major deposits, Pebble deposit included, may also occur in isolation or at least as distant outliers of coherent belts (Sillitoe, 2008). Four magmatic belts have been identified near the Pebble deposit (Reed and Lanphere, 1973; Wallace and Engbretson, 1984). However, the age ranges for these magmatic belts do not include the age of the Pebble deposit and associated igneous rocks. This suggests a better understanding of the regional magmatic history is needed.
At a district scale, porphyry deposits tend to occur as clusters or alignments that may attain 5 to 30 km across or in length, respectively (Sillitoe, 2010). The Pebble Cu-Au-Mo deposit represents only one point within a hypothesized cluster or alignment. Several other hydrothermal centers that are similar in age to the Pebble deposit have been identified (Lang et al., 2013). Thus the Pebble district has the potential to form a cluster of similar porphyry copper deposits. Identifying other areas in the region with similar geology to the Pebble district may also represent potential clusters for similar porphyry copper deposits.
The geology of southwest Alaska represents a growing continental margin. In general, the geology consists of island-arc complexes that have accreted to the North American continent since the Mesozoic. The Talkeetna island-arc complex formed on oceanic crust during the Jurassic. The island-arc complex accreted to North America by Early Cretaceous. Overlapping the island-arc rocks are syn- to post-collisional flysch deposits. Mid-Cretaceous magmatism intruded these flysch deposits. The Pebble district is associated with such magmatism. Also at this time was the intrusion of several zoned ultramafic complexes. During the Late Cretaceous post-collision magmatism intruded the flysch deposits. Because of the diversity of geologic environments through time, there is potential for a several mineral deposit types. The deposit types include: porphyry copper, low- and high-sulfidation epithermal, Alaska-type zoned ultramafic complexes, and reduced intrusion related gold systems. The deposit types are
associated with a variety of igneous rocks that may have differing aeromagnetic signatures. Thus aeromagnetic data may help map geology and mineral resources in southwest Alaska.
The regional setting of the Pebble Cu-Au-Mo deposit is remote with little infrastructure in place and relatively inaccessible making traditional geologic field campaigns difficult. Much of the existing geologic mapping
2
is reconnaissance at a scale of 1:250,000 (Wilson et al., 2006). However, there are also four preliminary geologic maps at a scale of 1:63,360 (Wilson et al., 2003) and a district-scale geologic map over the Pebble deposit (Lang et al., 2013). The surficial geology in the region is predominately glacial cover making bedrock mapping difficult. Regional aeromagnetic data provide a way to see through surficial cover and help establish the three-dimensional geologic framework. Such a framework can be related to ore deposit models and used in further assessing the land for its mineral resource potential.
Aeromagnetic data are fundamental in understanding the regional geologic setting of mineral deposits. The data provide invaluable insight to the geology at depth or under surficial cover such as glacial deposits, forests, sands, and weathered material. In general these data map the distribution of magnetic material within the crust which is largely dependent on the concentration of magnetite, a common accessory mineral in igneous rocks. The igneous rocks associated with the Pebble deposit are magnetite-series and should be readily recognized with aeromagnetic data. Thus aeromagnetic data can be used to map the distribution of igneous rocks associated with the Pebble deposit and can identify areas with similar magnetic signatures. Ancillary geologic information such as mineral resource descriptions and radiometric age dates from areas of similar magnetic signatures can be used to further assess the similarities of these areas to that of the Pebble district.
Aeromagnetic data can be processed in several ways to enhance magnetic features that may lead to a better understanding of the three-dimensional distribution of geologic units. Long and short wavelength anomalies can be separated to enhance deep and shallow features, respectively. This may help understand the three-dimensional distribution of geologic units. Several edge detection techniques have been developed that map the lateral
distribution of geologic units. Such analyses can also be used to establish the dip direction between two contrasting magnetic sources. Magnetic anomalies can also be used to estimate depths to magnetic sources. The combination of these aeromagnetic data processing techniques helps map the near surface distribution of geologic units and can be used to help establish the three-dimensional geologic framework in which these mineral resources formed.
Forward and inverse modeling of geophysical data use surface measurements to understand the three-dimensional distribution of geologic units. These models can be constrained by geologic maps and measurements of physical properties such as magnetic susceptibility, density, and resistivity. Forward modeling allows the user to define the geometries and physical properties of the geologic unit and a calculated field is then produced and compared with the observed data. Trial and error, along with geologic intuition, lead to the most realistic models with the least difference between calculated and observed values. The inversion model is a mathematical attempt to create the subsurface distribution of physical properties that best matches the observed data collected at the surface. The results of both forward and inverse models can be used as input to a three-dimensional geologic map.
Geological modeling can be done in both two- and three-dimensions. A two-dimensional geologic map is a model of surface geology based on geologic observations at the surface and the geology is inferred between
observation points. There is considerable uncertainty involved in such processes, the amount of which is largely dependent on several factors including: scale, detail and quality of observation, reliability of inference between observation points, the complexity of geology, and the density of observation points. A three-dimensional geologic model extends the observations made in the two-dimensional model to the subsurface. Several data sets can be used
3
to extend such observations that include: boreholes, digital elevation models, forward- and inverse-modeled magnetic data, and contact and depth information calculated from magnetic data. Considerable uncertainty is also involved with three-dimensional geologic modeling. Such uncertainty can often be attributed to resolution of data, quality of data or its ability to resolve the geology at depth, and quality of forward- and inverse-models and the constraints used to generate them. Nevertheless, combining two-dimensional geologic models with observations that can extend such into three-dimensions can result in a robust three-dimensional geologic model that can be used to better understand mineral resources at depth.
This thesis integrates various data sets to better understand the mineral resource potential in southwest Alaska. Aeromagnetic data are used to extend the known geologic units that outcrop to areas where the bedrock geology is largely covered by glacial deposits. Existing edge detection techniques help constrain the lateral
distribution of rock types. Forward and inverse modeling techniques, along with estimates to the depths of magnetic sources, are used to help establish the distribution of igneous rocks at depth. A three-dimensional geologic map constrained by aeromagnetic data, geologic maps, boreholes, and topography is produced. The aeromagnetic signature of various rock types through time, in conjunction with mineral deposit models and known location of resources, are used to map the potential for a variety of mineral deposit types that include porphyry copper, low- and high-sulfidation epithermal, Alaska-type zoned ultramafic complexes, and reduced intrusion related gold systems. This work results in a better understanding of the three-dimensional distribution of mineral resources near the Pebble Cu-Au-Mo porphyry deposit in southwest Alaska, an area where bedrock geology is largely concealed by glacial cover.
1.1 References
Lang, J.R., Gregory, M.J., Rebagliati, C.M., Payne, J.G., Oliver, J.L., and Roberts, K., 2013, Geology and magmatic-hydrothermal evolution of the giant Pebble porphyry copper-gold-molybdenum deposit, southwest Alaska: ECONOMIC GEOLOGY, v. 108, p. 437-462.
Reed, B.L., and Lanphere, M.A., 1973, Alaska-Aleutian Range batholith: Geochronology, chemistry, and relation to circum-Pacific plutonism: Geological Society of America Bulletin, v. 84, p. 2583-2610.
Sillitoe, R.H., 2010, Porphyry copper systems: ECONOMIC GEOLOGY, v. 105, p. 3-41.
Sillitoe, R.H., 2008, Major gold deposits and belts of the North and South American Cordillera: distribution, tectonomagmatic settings, and metallogenic considerations: ECONOMIC GEOLOGY, v. 103, p. 663-687.
Wallace, W.K. and Engebretson, D.C., 1984, Relationships between plate motions and Late Cretaceous to Paleogene magmatism in southwestern Alaska: Tectonics, vol. 3, no. 2, p. 295-315.
Wilson, F.H., Hudson, T.L., Grybeck, D., Stoeser, D.B., Preller, C.C., Bickerstaff, D., Labay, K., Miller, M.L., 2003, Preliminary geologic map of the northeast Dillingham quadrangle (D-1, D-2, C-1, and C-2), Alaska: US Geological Survey Open-File Report 2003-0105.
Wilson, F.H., Blodgett, R.B., Blome, C.D., Mohadjer, S., Preller, C.C., Klimasauskas, E.P., Gamble, B.M., and Coonrad, W.L., 2006, Digital data for the reconnaissance bedrock geologic map for the northern Alaska Peninsula area, southwest Alaska: U.S. Geological Survey Open-File Report, 2006-1303.
4
CHAPTER 2. GEOLOGICAL ANALYSIS OF AEROMAGNETIC DATA FROM SOUTHWESTERN ALASKA: IMPLICATIONS FOR EXPLORATION IN THE AREA OF THE PEBBLE PORPHYRY CU-AU-MO
DEPOSIT
A paper published in Economic Geology
Eric D. Anderson,1,2 Murray W. Hitzman,2 Thomas Monecke,2 Paul A. Bedrosian,1 Anjana K. Shah,1 and Karen D. Kelley1
1U.S. Geological Survey, Denver, Colorado 2Colorado School of Mines, Golden, Colorado
2.1 Abstract
Aeromagnetic data are used to better understand the geology and mineral resources near the Late
Cretaceous Pebble porphyry Cu-Au-Mo deposit in southwestern Alaska. The reduced-to-pole (RTP) transformation of regional-scale aeromagnetic data show that the Pebble deposit is within a cluster of magnetic anomaly highs. Similar to Pebble, the Iliamna, Kijik, and Neacola porphyry copper occurrences are in magnetic highs that trend northeast along the crustal-scale Lake Clark fault. A high-amplitude, short- to moderate-wavelength anomaly is centered over the Kemuk occurrence, an Alaska-type ultramafic complex. Similar anomalies are found west and north of Kemuk. A moderate-amplitude, moderate-wavelength magnetic low surrounded by a moderate-amplitude, short-wavelength magnetic high is associated with the gold-bearing Shotgun intrusive complex.
The RTP transformation of the district-scale aeromagnetic data acquired over Pebble permits differentiation of a variety of Jurassic to Tertiary magmatic rock suites. Jura-Cretaceous basalt and gabbro units and Late
Cretaceous biotite pyroxenite and granodiorite rocks produce magnetic highs. Tertiary basalt units also produce magnetic highs, but appear to be volumetrically minor. Eocene monzonite units have associated magnetic lows. The RTP data do not suggest a magnetite-rich hydrothermal system at the Pebble deposit.
The 10 km upward continuation transformation of the regional-scale data shows a linear northeast trend of magnetic anomaly highs. These anomalies are spatially correlated with Late Cretaceous igneous rocks and in the Pebble district are centered over the granodiorite rocks genetically related to porphyry copper systems. The spacing of these anomalies is similar to patterns shown by the numerous porphyry copper deposits in northern Chile. These anomalies are interpreted to reflect a Late Cretaceous magmatic arc that is favorable for additional discoveries of Late Cretaceous porphyry copper systems in southwestern Alaska.
2.2 Introduction
Discovery of the Late Cretaceous Pebble porphyry Cu-Au-Mo deposit in southwestern Alaska, which has a current measured and indicated resource of 5,940 Mt at 0.42 percent copper, 0.35 g/t gold, and 0.025 percent molybdenum, with a 0.30 wt percent copper cut-off (Lang et al., 2013), has made this remote region highly
prospective for porphyry copper deposits of similar age. The original discovery was made by Cominco geologists in 1988 (Bouley et al., 1995). Drilling has since shown that the deposit contains the largest gold resource and fifth largest copper resource of any known porphyry deposit (Lang et al., 2013).
5
Because of extensive Tertiary and Quaternary cover (Detterman and Reed, 1973; Beikman, 1974; Eakins et al., 1978; Case and Nelson, 1986; Wilson et al., 2006), mineral exploration in southwestern Alaska relies to a large extent on geophysical techniques. Regional-scale aeromagnetic data may be particularly useful because they cover a large area and porphyry copper deposits are commonly found in linear, orogen-parallel belts (Sillitoe and Perelló, 2005; Sillitoe, 2010). Intrusions hosting such deposits are dominantly of magnetite-series affiliation (Ishihara, 1981; Seedorff et al., 2005) and these can be mapped using magnetic data.
The present study shows that regional- and district-scale aeromagnetic data are particularly useful in helping establish the local geological setting of the Pebble deposit. Filtering techniques permit mapping of the igneous rocks associated with the Pebble deposit and allow the recognition of areas within the region with magnetic patterns similar to Pebble, several of which are associated with outcropping intrusive rocks that are age equivalent to those hosting the Pebble deposit. These data suggest the presence of a regional and largely concealed Late
Cretaceous magmatic arc in southwestern Alaska that is highly prospective for porphyry copper deposits similar in age to the 90 Ma Pebble deposit.
2.3 Regional Geology
The geology of southwestern Alaska consists of a series of amalgamated lithotectonic terranes that have been accreted to the North American craton since the Jurassic (Figure 2.1; Wallace et al., 1989; Decker et al., 1994; Plafker and Berg, 1994; Hampton et al., 2010; Goldfarb et al., 2013). Overlapping these exotic terranes are syn- to post-collisional flysch deposits and volcaniclastic strata that formed in the foreland basins of the accreting terranes (Wallace et al., 1989; Hampton et al., 2010; Goldfarb et al., 2013). Subduction of oceanic crust during the Jurassic and Cretaceous led to the formation of numerous volcano-plutonic complexes, some of which host porphyry copper deposits.
The Pebble deposit is related to igneous rocks that post-date the deposition of the Late Jurassic to Late Cretaceous Kahiltna assemblage (Wallace et al., 1989; Kalbas et al., 2007; Hampton et al., 2010). Rocks of the Kahiltna assemblage crop out along a ~400-km-long, northeast-striking belt within the Kahiltna basin (Figure 2.1). They are mainly flysch deposits interpreted to have been derived primarily from the igneous rocks of the Peninsular terrane to the southeast, with local contributions from the Triassic Chilikadrotna Greenstones to the northwest (Wallace et al., 1989; Wilson et al., 2006).
The Peninsular terrane is a Triassic to Jurassic island arc complex that was accreted to the North American craton by the Early Cretaceous (Detterman and Reed, 1980; Jones et al., 1987; Ridgway et al., 2002; Trop et al., 2002, 2005; Clift et al., 2005). The terrane includes mafic to andesitic flows and volcaniclastic rocks, limestone, and mudstone. These rocks structurally overlie and are intruded by Jurassic plutonic rocks of the Talkeetna arc (Reed and Lanphere, 1973; Reed et al., 1983; Rioux et al., 2010). The plutonic rocks include gabbroic to granitic
compositions, but are dominated by quartz diorite and tonalite rocks (Detterman and Reed, 1980; Reed et al., 1983). The Togiak terrane located west of the Peninsular terrane is an island arc complex that contains Late Triassic to Early Cretaceous basaltic to dacitic volcanic and volcaniclastic rocks and graywacke (Decker et al., 1994). These rocks were accreted to the North American craton during the middle to late Early Cretaceous (Box, 1985).
6
Figure 2.1 Location and regional geology maps of southwestern Alaska.A. Index map. B. Lithotectonic terrane map of the region. Exotic oceanic terranes (Peninsular and Togiak terranes) were accreted to the southern margin of Alaska. These exotic terranes are overlapped by flysch deposits in the Kahiltna and Kuskokwim basins. The Pebble deposit is hosted in the flysch rocks in the Kahiltna basin. C. Index map showing the outlines of the regional aeromagnetic surveys. D. Generalized geologic map modified from Wilson et al. (2006). Triassic sedimentary rocks were intruded by Jurassic island-arc igneous rocks, and all are overlain by flysch deposits. These rocks were later intruded and overlain by Cretaceous to Paleogene volcano-plutonic rocks. Also shown are mineral occurrences in the study area and the locations for Figures 2.2 and 2.5.
7
The Peninsular and Togiak terranes are separated by the Farewell terrane (Figure 2.1) that contains a Lower Paleozoic through Lower Cretaceous continental margin sequence of sedimentary rocks (Decker et al., 1994). Flysch deposits of the Lower to Upper Cretaceous Kuskokwim Group unconformably overlie rocks of the Farewell and Togiak terranes and were structurally emplaced over the Kahiltna assemblage (Wallace et al., 1989; Decker et al., 1994).
Cretaceous to Paleogene igneous rocks crop out extensively in southwestern Alaska (Figure 2.1; Reed and Lanphere, 1973; Wallace and Engebretson, 1984; Moll-Stalcup, 1994; Bundtzen and Miller, 1997; Wilson et al., 2006; Amato et al., 2007). The intrusive rocks include granite, granodiorite, syenite, monzonite, and diorite. Limited gabbroic rocks have been mapped. The volcanic rocks are mostly of rhyolitic, dacitic, and basaltic compositions.
Several NE-striking crustal-scale faults have been recognized in southwestern Alaska (Figure 2.1; Detterman et al., 1976; Beikman, 1980). The Lake Clark fault extends from Lake Clark northeast into the Alaska-Aleutian Range batholith (Detterman et al., 1976). Based on offsets measured on aeromagnetic anomaly maps, Haeussler and Saltus (2005) estimated that there has been approximately 26 km of dextral offset along the Lake Clark fault since the Eocene. Ivanhoe (1962) suggested that approximately 10 km of offset has occurred since the Tertiary based on offsets of geological units. The Pebble district is located southwest of the mapped extent of the Lake Clark fault. The fault has not been recognized west of Lake Clark (Detterman and Reed, 1973, 1980; Plafker et al., 1975; Koehler, 2010).
The Mulchatna fault is parallel to the Lake Clark fault (Beikman, 1980). In general, the fault coincides with the boundary between the Kuskokwim and the Kahiltna basins and is interpreted to have significant dextral strike-slip and/or dip-strike-slip displacement since the Late Cretaceous to Paleocene (Wallace et al., 1989). The Bruin Bay fault separates rocks of the Alaska-Aleutian Range batholith from sedimentary rocks to the southeast. The fault is
interpreted as a high-angle reverse fault (Detterman and Hartsock, 1966; Detterman et al., 1976). The Holitna fault is interpreted to be northwest side up high-angle reverse with a dextral component (Wilson et al., 2006).
2.4 Known Mineral Occurrences in the Pebble Region
The Pebble region hosts numerous mineral occurrences (Figure 2.1; Table 2.1). In addition to the Pebble deposit, porphyry-type mineralized rocks have been recognized in the Kahiltna basin at the Kijik, Neacola, and Iliamna prospects. The Kijik prospect contains veins and disseminated pyrite, pyrrhotite, chalcopyrite, and galena in porphyritic dacite that has undergone extensive propylitic and silicic alteration (Nelson et al., 1985; Young et al., 1997; U.S. Geological Survey, 2008). At Neacola disseminated pyrite and bornite are found in a granodiorite with K/Ar hornblende ages of approximately 95 Ma (Young et al., 1997; U.S. Geological Survey, 2008). The Iliamna Cu (Au-Mo) occurrence has porphyry-style mineralized rock that is of uncertain age (J. Harrop, written commun., 2011).
The Kuskokwim basin and Togiak terrane also host a number of mineral occurrences (Figure 2.1). The Shotgun occurrence contains arsenopyrite, chalcocite, chalcopyrite, pyrrhotite, and sphalerite in quartz veins that cut hornfels adjacent to 70 to 68 Ma granitic intrusions (Rombach and Newberry, 2001). Arsenopyrite- and stibnite-bearing quartz veins cutting diorite, quartz monzonite, and quartz diorite are common at the Bonanza Hills prospect (U.S. Geological Survey, 2008). The quartz monzonite has a K/Ar biotite age of approximately 64 Ma (Eakins et al.,
8
1978). The Kemuk prospect contains anomalous platinum, titaniferous magnetite, chalcopyrite, native copper, and sphalerite within an Alaska-type ultramafic complex that is composed of clinopyroxene-, olivine-, and hornblende-bearing rocks (Humble Oil Refining Company, 1959; Foley et al., 1997; U.S. Geological Survey, 2008). Biotite from the ultramafic rocks has been dated at 86 Ma (Iriondo et al., 2003). The occurrence is buried by 30 m to more than 140 m of glacial overburden and was identified by drilling that followed up an aeromagnetic anomaly (Humble Oil Refining Company, 1959).
Table 2.1 Mineral deposits and occurrences in southwestern Alaska
Name Commodities
(minor) Type Age (Ma) Reference
Bonanza Hills Au, Ag Polymetallic vein 64 Nelson et al. (1985), Eakins et al. (1978) Iliamna Cu (Au, Mo) Porphyry unknown (J. Harrop, written
commun., 2011) Kemuk PGE, Fe, Cu,
Zn Alaska-type ultramafic complex 86 Humble Oil Refining Company, (1959), Foley et al. (1997), Iriondo et al. (2003)
Kijik Cu, Au, Mo,
Pb, Zn Porphyry Early Tertiary(?) Nelson et al. (1985)
Neacola Cu, Mo Porphyry 95 Young et al. (1997)
Pebble Cu, Au, Mo
(Ag, Pd, Re) Porphyry 90 Lang et al. (2013)
Shotgun Au (As, Bi, Ce, Cu, T, W, Zn)
Reduced intrusion-related gold; porphyry
70 Rombach and Newberry, (2001)
2.5 Geology of the Pebble District
The Pebble district contains igneous rocks that range from Jurassic to early Tertiary in age (Gregory and Lang, 2009; Lang et al., 2013). These rocks intrude Jurassic to Cretaceous flysch deposits of the Kahiltna assemblage. Associated with these igneous rocks are the Pebble porphyry Cu-Au-Mo deposit and several other porphyry-related occurrences (Figure 2.2).
The Pebble deposit is spatially and temporally associated with igneous rocks that were emplaced during multiple pulses of magmatism. The oldest igneous rocks in the district are Jurassic-Cretaceous basalt and related gabbroic intrusions (Bouley et al., 1995). These rocks crop out at the northern and southern ends of the district. Biotite pyroxenite and diorite sills, cropping out to the southwest of the deposit, were emplaced about 98 to 96 Ma (Lang et al., 2013). Diorite sills host much of the porphyry-style ores. Drilling indicates that the Pebble deposit is genetically related to at least two granodiorite to quartz monzodiorite stocks that underly the eastern and western sides of the deposit and have U-Pb dates of 91 to 89 Ma (Lang et al., 2013). The mainly unaltered Kaskanak batholith, composed almost entirely of granodiorite, crops out 5 km west of the Pebble deposit and has a U-Pb date of 90 Ma (Bouley et al., 1995).
The host rocks of the Pebble deposit have been extensively altered (Lang et al., 2013). The earliest type of hydrothermal alteration is sodic-calcic. The sodic-calcic altered rocks are most strongly developed at depth where the mineral assemblage is characterized by calcite, albite, chlorite, rutile, and epidote. Primary magnetite in the host
9
rocks was altered to hematite. The sodic-calcic alteration assemblage grades upward into a K-silicate alteration assemblage that is characterized by K-feldspar, biotite, and quartz, but lacks magnetite. Zones of sodic-calcic- and potassic-altered rocks are surrounded by a weak propylitic alteration halo in diorite sills that locally contain hydrothermal magnetite. Pervasive illitically altered rocks overprint both the sodic-calcic and potassic alteration assemblages. The Pebble deposit consists of sulfides that are both disseminated and in quartz-carbonate stockwork veins. Dominant sulfide minerals are pyrite, chalcopyrite, bornite, and molybdenite (Lang et al., 2013).
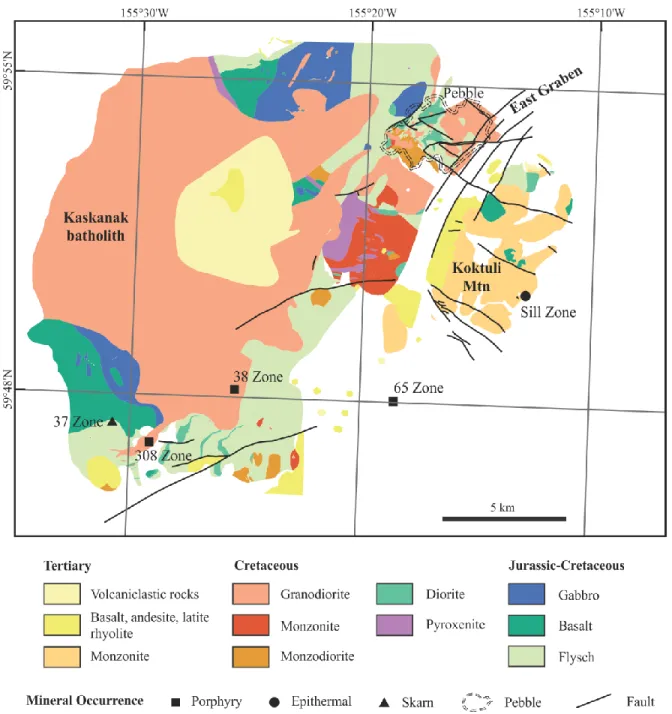
Figure 2.2 Generalized geologic map of the Pebble district.Jurassic-Cretaceous basalt and related gabbroid intrusions and flysch deposits were intruded by Cretaceous igneous rocks. The Pebble deposit is associated with calc-alkaline stocks that are genetically related to granodiorite rocks of the Kaskanak batholith. Tertiary-aged monzonite intrusions and bimodal volcanic rocks are also within the district.
10
The Pebble district contains several other Cretaceous porphyry-related occurrences including the 37, 308, 38, and 65 Zones (Figure 2.2; Lang et al., 2013). The 37 Zone is within diorite and gabbro and consists of Cu-Au mineralized rocks associated with magnetite-bearing, garnet-, pyroxene-, carbonate-, and epidote-calc-silicate-altered rocks and sulfide-bearing veins. The 308 and 38 Zones are in similar settings with hornblende-quartz-monzodiorite to granodiorite porphyry host rocks that are cut by porphyritic monzonite. At 308 and 38, Cu-Au-Mo mineralized rocks are associated with K-silicate-altered rocks that are surrounded by quartz-sericite-pyrite- and propylitic-altered rocks. The 65 Zone contains anomalous molybdenum, copper, and gold in an area of intensely altered rocks that includes quartz-sericite-pyrite, propylitic, and lesser K-silicate assemblages.
The Pebble district has experienced multiple episodes of faulting (Lang et al., 2013). A pre-, syn-, and post-hydrothermal brittle-ductile fault zone trends northeast along the eastern side of the Pebble deposit. Eocene and older brittle extensional faulting led to the formation of the northeast trending East Graben (Figure 2.2). Following its formation, the Pebble deposit was tilted 20 degrees east and the eastern part of the deposit was downthrown as much as 900 m.
Post-Pebble age rocks include porphyritic monzonite intrusions that were emplaced at ~65 Ma into basalts of unknown age in the East Graben (Lang et al., 2013). Monzonite intrusions and bimodal volcanic rocks were formed at ca. 46 Ma and are concentrated in the area of Koktuli Mountain (Lang et al., 2013). The bimodal volcanic rocks are associated with the Sill Zone, a low-sulfidation epithermal-style mineralized zone dated at ~46 Ma (Schrader et al., 2001).
2.6 Aeromagnetic Data
Aeromagnetic data have long been used as an aid in mapping and understanding porphyry-style deposits (Grant, 1985; Woods and Webster, 1985; Roy and Clowes, 2000; Behn et al., 2001; Hildenbrand et al., 2001; Hoschke, 2008). Magnetic anomalies are caused by two different kinds of magnetism: induced and remanent (permanent) magnetization. The induced component is mostly determined by the rocks magnetic susceptibility, which is a dimensionless proportionality constant reported in International System of Units (SI) that indicates the ability of the rock to become magnetized in the presence of a magnetic field and is predominantly a function of magnetite content. The remanent component depends on the thermal, mechanical, and magnetic history of the rock and is independent of the field in which it is measured. In general, the induced component is predominant but the reverse is true in many igneous rocks. Rocks with higher magnetic susceptibilities produce magnetic anomalies with larger variation in the observed magnetic field than do rocks with lower magnetic susceptibilities (Table 2.2).
Granitoids can be classified as being either magnetite- or ilmenite-series (Ishihara, 1981). Magnetite-series rocks are typically derived from oxidized mafic melts generated in the mantle wedge during subduction processes. Ilmenite-series magmas may be similarly derived, but they have contributions from continental crustal rocks that provide carbon as a reducing agent (Ishihara, 1981). The magnetite- and ilmenite-series rocks can be distinguished by their magnetite and ilmenite content with magnetite-series containing more than 0.1 vol percent magnetite and ilmenite-series having an ilmenite + magnetite content of less than 0.1 vol percent (Ishihara, 1981). Thus magnetite-series rocks have relatively higher magnetic susceptibilities. Magnetite- and ilmenite-magnetite-series plutonic belts in the
11
northern North America Cordillera have been mapped by integrating lithological, geochemical, and
geochronometric data with aeromagnetic characteristics and magnetic susceptibility measurements (Hart et al., 2004). The igneous rocks associated with the Pebble porphyry copper deposit belong to the magnetite-series (Lang et al., 2013) and therefore are readily recognized in aeromagnetic surveys.
Table 2.2 Magnetic susceptibility of common igneous rocks (from Ford et al., 2008) Rock Type Magnetic Susceptibility (SI x 10Min. Max. Average -3)
Rhyolite 0.2 35 N.A.
Andesite N.A. N.A. 160
Granite 0 50 2.5
Quartz Diorite, Dacite 38 191 83
Diorite 0.6 120 85
Diabase 1 160 55
Basalt 0.2 175 70
Gabbro 1 90 70
Peridotite 90 200 250
Pyroxenite N.A. N.A. 125
Monzonite, Latite 33 135 85 Acid Igneous Rocks 0 80 8 Basic Igneous Rocks 0.5 97 25
Trachyte 0 111 49
Syenite 0 111 49
N.A. Not Available
Aeromagnetic data may be collected at multiple resolutions. Data resolution depends on both flight line spacing and the height above ground that the survey is flown. High-resolution data are collected along closely spaced flight lines at a low observation height and provide a more detailed map of the distribution of causative sources than do lower resolution data collected at higher observation heights along more widely spaced flight lines. Because the strength of the magnetic field decreases with the cube of the distance to the source, a shallow source body has a shorter wavelength magnetic anomaly than a deep source body. Thus the variations in wavelengths of magnetic anomalies can help to determine the depth to a causative body. The contrasting magnetic patterns within an aeromagnetic data set allow for differentiation of geologic units that have different magnetic properties and susceptibilities.
2.6.1 Regional-scale Aeromagnetic Data from Southwestern Alaska
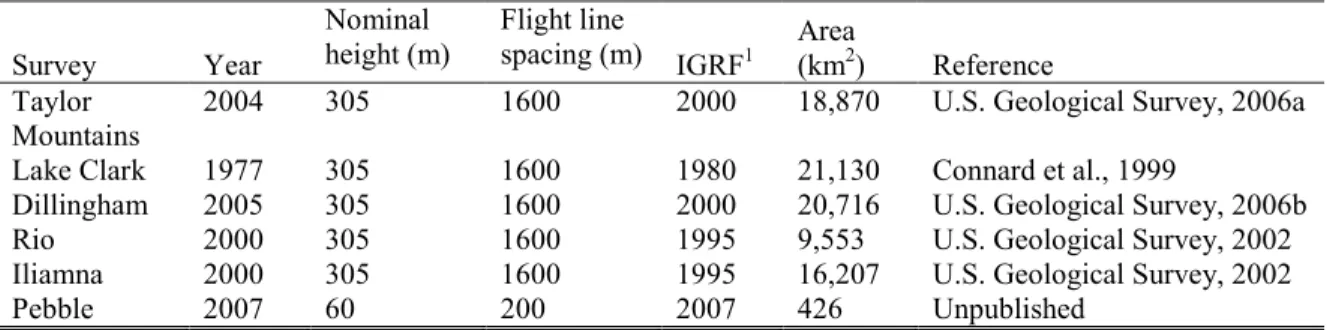
Five regional-scale aeromagnetic surveys were flown in the Pebble region along northwest-trending flight lines (Figure 2.1; Table 2.3). The data from the individual surveys (Connard et al., 1999; U.S. Geological Survey, 2002; U.S. Geological Survey, 2006a, b) were merged into a single, continuous data set with a grid cell size of 400 m (Anderson et al., 2011) and were processed using industry-standard techniques (Luyendyk, 1997). The resulting data set covers approximately 82,500 km2 over four 1:250,000-scale quadrangle map sheets (Taylor Mountains, Lake Clark, Dillingham, and Iliamna).
The merged regional aeromagnetic data were further processed utilizing the reduced-to-pole (RTP) transform method (Baranov and Naudy, 1964; Blakely, 1995) to better align magnetic anomalies with causative
12
geology. The RTP transformation is a technique that recalculates total magnetic intensity data as if the inducing magnetic field had a 90o inclination, as is the case at the north magnetic pole. This operation removes the
dependence of magnetic data on the magnetic inclination and thus minimizes anomaly asymmetry due to magnetic inclination and locates anomalies above their causative bodies. The RTP transformation was applied using an inclination of 72.6° and declination of 18.5°. Because of the relatively steep inclination of the magnetic field in southwestern Alaska, there is only minimal difference between the observed magnetic anomaly and the RTP transformation.
Table 2.3 Survey specifications for regional- and district-scale aeromagnetic data sets Survey Year
Nominal
height (m) Flight line spacing (m) IGRF1 Area (km2) Reference Taylor
Mountains 2004 305 1600 2000 18,870 U.S. Geological Survey, 2006a Lake Clark 1977 305 1600 1980 21,130 Connard et al., 1999
Dillingham 2005 305 1600 2000 20,716 U.S. Geological Survey, 2006b Rio 2000 305 1600 1995 9,553 U.S. Geological Survey, 2002 Iliamna 2000 305 1600 1995 16,207 U.S. Geological Survey, 2002
Pebble 2007 60 200 2007 426 Unpublished
1 International Geomagnetic Reference Field
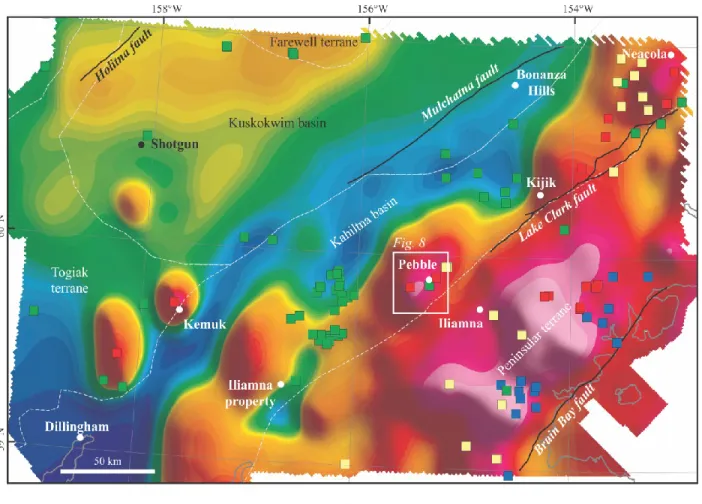
The RTP transformation of the regional aeromagnetic data shows a number of contrasting magnetic anomalies (Figure 2.3). The dominant magnetic trend is northeast-southwest, parallel to the major crustal-scale faults and belts of exposed igneous rocks. The patterns in the magnetic anomaly data generally correlate with known lithotectonic terranes. The area between the Lake Clark and Mulchatna faults is characterized by both high and low magnitude magnetic anomalies within the sedimentary rocks of the Kahiltna basin. The Togiak terrane is
magnetically similar to the Kahiltna basin and contains two prominent magnetic highs. The igneous rocks to the south of the Lake Clark fault are characterized by magnetic highs. To the northwest of the Mulchatna fault, sedimentary rocks of the Kuskokwim basin display broad, moderate magnitude magnetic anomalies.
The Kahiltna basin shows a complex magnetic pattern. The basin has a relatively low magnetic background with scattered magnetic highs of various dimensions and amplitudes. The broad magnetic low correlates with both sedimentary rocks and some Cretaceous to Paleogene igneous rocks (Figures 2.1, 2.3). The broad magnetic low has been referred to as the southern Alaska magnetic trough and interpreted to reflect Mesozoic sedimentary rocks (Saltus et al., 1999). In sharp contrast, clusters of magnetic anomaly highs align northeast-southwest along the Lake Clark fault. The Pebble district is contained within one such high, where Cretaceous to Paleogene igneous rocks crop out (Figure 2.1), suggesting the Cretaceous to Paleogene igneous rocks have both a low and high magnetic signature. Southwest of the Pebble district, clusters of magnetic highs are present beneath Quaternary cover. These highs are composed of moderate- to high-amplitude and moderate- to long-wavelength anomalies. The highs are ovoid in shape with axial dimensions of about 40 x 30 km and long axes trending north-northeast, and thus are transverse to the Lake Clark fault. The highs are spaced between 20 and 60 kilometers apart. Between the highs are low- to moderate-amplitude, short-wavelength anomalies that are commonly associated with mapped Cretaceous to
13
Paleogene igneous rocks. A northeasterly linear trend of low- to moderate-amplitude, short-wavelength magnetic high anomalies 10-20 km south of the Mulchatna fault corresponds to the Chilikadrotna Greenstones.
Figure 2.3 Map showing the reduced-to-pole (RTP) transformed aeromagnetic data.The Pebble deposit is located within a cluster of magnetic anomaly highs. Similar clusters are found to the northeast and southwest along the crustal-scale Lake Clark fault. Dashed white lines indicate lithotectonic terranes from Figure 2.1B. Location for Figure 2.8 is shown.
The Peninsular terrane is dominated by magnetic anomaly highs. The magnetic highs have been referred to as the southern Alaska magnetic high and interpreted to reflect arc-related rocks and their basement (Saltus et al., 1999, 2007). The high-amplitude, short- to moderate-wavelength anomalies extend for more than 200 km along a northeast-southwest trend. The continuity of the magnetic highs is suggestive of a broad belt of magnetite-rich rocks. Two north-northeast trending linear magnetic lows are within the magnetic highs. The southeastern low correlates with steeply dipping, sedimentary rocks along the Bruin Bay fault. The northern low follows the contact between Talkeetna arc rocks and younger volcano-plutonic rocks, but does not show a direct correlation with mapped lithologies. A broad, long-wavelength magnetic anomaly high is observed east of the Bruin Bay fault, suggesting a relatively deep magnetic source related to the Talkeetna arc beneath the Cook Inlet (Saltus et al., 2007).
The Kuskokwim basin is characterized by a broad, moderate-amplitude, long-wavelength magnetic anomaly high. The magnetic pattern suggests a relatively deep magnetic source. The Kuskokwim basin also shows
14
moderate-amplitude, moderate-wavelength magnetic lows surrounded by moderate-amplitude, short-wavelength magnetic highs, as is illustrated by the gold-bearing Shotgun intrusive complex. Moderate-amplitude,
short-wavelength magnetic highs surrounded by moderate-amplitude, short-short-wavelength magnetic lows are found 40 km to the east and west of Shotgun. In both locations there are limited exposures of Cretaceous to Paleogene igneous rocks (Figure 2.1). Also, 30 km to the south of Shotgun is a high-amplitude, short- to moderate-wavelength magnetic high that correlates with outcropping Cretaceous to Paleogene igneous rocks. The Bonanza Hills produce a moderate-amplitude, short-wavelength magnetic high surrounded by a ring of magnetic lows.
The Togiak terrane is dominated by two prominent high-amplitude, short- to moderate-wavelength high magnetic anomalies (Figure 2.3). One of the anomalies is caused by near surface magnetite-rich pyroxenite that has been drilled at the Kemuk occurrence where laboratory results indicate that remanent magnetization predominates over induced (Humble Oil Refining Company, 1959; Foley et al., 1997). The larger anomaly 35 km to the southwest is inferred to be related to ~84 Ma biotite granite and syenite (Iriondo et al., 2003).
In addition to the RTP transformation, an upward continuation transformation of the aeromagnetic data was performed to calculate the magnetic field at an elevation higher than that at which it was originally measured. This transformation attenuates near-surface effects and accentuates the anomalies from deeper magnetic sources (Kellogg, 1953; Blakely, 1995). Thus, this transformation highlights the longer spatial wavelength anomalies at the expense of the shorter wavelength anomalies. The aeromagnetic data from southwestern Alaska were upward continued from the nominal survey height of 305 m to 10,000 m (Figure 2.4).
The upward continued data from the Kahiltna basin show a linear trend of magnetic anomaly highs that correlate with known porphyry-style occurrences (Figure 2.4; from southwest to northeast: Iliamna, Pebble, Kijik, and Neacola). Intrusions at Pebble and the Neacola prospect have similar Late Cretaceous isotopic ages (Young et al., 1997; Lang et al., 2013). The upward continued magnetic anomalies in the Peninsular terrane correlate with igneous rocks of Jurassic age. South of the Lake Clark fault magnetic highs in the Peninsular terrane correlate with a cluster of intrusive rocks with ages similar to those of the Pebble deposit. The magnetic anomalies in the
Kuskokwim basin and Togiak terrane are similar. The two magnetic intrusive centers in the Togiak terrane have radiometric dates similar to the age of the Pebble deposit. The magnetic anomaly 30 km to the south of Shotgun does not have a known dated igneous rock. The 70 to 60 Ma intrusive rocks associated with Shotgun and Bonanza Hills are not evident in the upward continued data, nor are many of the igneous rocks in the Kuskokwim and Kahiltna basins with radiometric dates between 74 and 55 Ma.
2.6.2 Aeromagnetic Data from the Pebble District
A high-resolution aeromagnetic survey was flown over the Pebble district in 2007 (Table 2.3). Flight lines were spaced 200 m apart at a nominal height of 60 m above the surface. The data were processed using industry standard data processing techniques (Luyendyk, 1997).
The reduced-to-pole (RTP) map of these data shows many moderate- to high-amplitude, short-wavelength anomalies characteristic of near-surface magnetic sources (Figure 2.5). Superimposed on this pattern are both
15
moderate- and high-amplitude, long-wavelength anomalies, suggestive of deeper magnetic sources. The magnetic anomalies mostly trend north to northeast.
Figure 2.4 Map showing aeromagnetic data upward continued to 10 km.Also shown are radiometric age dates (U.S. Geological Survey, 1999; Iriondo et al., 2003; Amato et al., 2007; Hart et al., 2012). Igneous rocks older than 84 Ma are associated with magnetic anomaly highs, whereas younger rocks can be found on both magnetic anomaly highs and lows. Dashed white lines indicate lithotectonic terranes from Figure 2.1. Location for Figure 2.8 is shown.
The northeast-striking, high-amplitude (~3000 nT), long-wavelength magnetic highs in the southwestern corner of the district correlate with mapped basalt and gabbro units (Figure 2.5). Similar amplitude anomalies are found on the northern side of the Kaskanak batholith, where they also correlate with known exposures of basalt and gabbro. Neither the basalt nor gabbro units have reported magnetite content or magnetic susceptibilities, but magnetic susceptibilities are inferred to be relatively high (Table 2.2). The longer wavelength anomalies associated with the mapped basalt may indicate the rocks are relatively thick or underlain by gabbro. Both sets of anomalies are superimposed on a moderate-amplitude (~800 nT), long-wavelength magnetic high anomaly. This broad magnetic anomaly correlates with mapped granodiorite within the Kaskanak batholith. The granodiorite has up to 2 % magnetite (Bouley et al., 1995) and a magnetic susceptibility around 30 x 10-3 SI. The large magnetic low within the
16
Kaskanak batholith correlates well with known volcaniclastic rocks (Figure 2.2), indicating they may be nonmagnetic.
Figure 2.5 Map showing reduced-to-pole (RTP) transformed aeromagnetic data for the Pebble district.The simplified geologic units from Figure 2.2 are outlined in black. The broad magnetic anomaly high on the west side of the district is associated with granodiorite rocks in the Kaskanak batholith. Igneous rocks older than the Kaskanak batholith show up as magnetic highs, whereas younger igneous rocks are both magnetic highs and lows. The magnetic highs associated with Tertiary igneous rocks have significantly shorter wavelengths than the anomaly associated with the Kaskanak batholith. The Tertiary monzonite intrusions produce magnetic lows. Also shown are the locations of the profiles depicted in Figures 2.6 (A-A’) and 2.7 (B-B’).
The RTP data do not show a distinct magnetic anomaly over the Pebble deposit (Figure 2.5). Instead the data show a magnetic gradient from high to low (west to east) over the deposit. This may be due to an increase in hydrothermal magnetite content in the shallower western part of the deposit (Lang et al., 2013). Magnetic susceptibility measurements in drill holes indicate a slight increase in magnetite along an east-to-west traverse across the deposit (Figure 2.6). Alternatively, the magnetic gradient may simply indicate that the granodiorite of the Kaskanak batholith deepens to the east as established by drilling.
17
Figure 2.6 Cross section A-A’ through the Pebble deposit.A. Profile of the reduced-to-pole (RTP) data illustrating long and short wavelength anomalies. B. Map view of the RTP data along the cross section. The resource outline is shown in white. Warm colors indicate magnetic highs and cool colors reflect magnetic lows. C. Cross section showing magnetic susceptibility measurements in drillcore. In general, the deposit shows low magnetic
susceptibility. However, elevated values in the shallow west side of the deposit suggest the presence of magnetite which may be contributing to the elevated RTP data. Tertiary volcanic rocks show high magnetic susceptibilities within the East Graben that correlate with RTP anomalies. Also shown in C. is a dashed line indicating the Cretaceous-Tertiary boundary. See Figure 2.5 for section location.
Zones with porphyry-style mineralization elsewhere in the district display magnetic highs (Figure 2.5). These magnetic anomalies may be due to the presence of either hydrothermal magnetite or relatively shallow underlying magnetic rocks.
Moderate- to high-amplitude (~400 nT), short-wavelength anomalies trend north to northeast through the district parallel to the trend of the East Graben (Figure 2.5). These anomalies are similar to those generated above Tertiary volcanic rocks within the East Graben. Magnetic susceptibility measurements of these volcanic rocks indicate that they are highly magnetic, but they have limited spatial extent (Figure 2.6). Similar magnetic anomalies to the north of Kaskanak batholith and to the northeast of Koktuli Mountain suggest the presence of additional near-surface volcanic rocks.
18
A magnetic low spatially related to known outcrops of Tertiary monzonite rocks overlies Koktuli Mountain (Figures 2.5, 2.7) and indicates that these rocks are less magnetic than the granodiorite of the Kaskanak batholith. Low-sulfidation epithermal style mineralized zones are found on the east side of Koktuli Mountain. Hydrothermal alteration associated with the mineralization may have been magnetite destructive, reducing the magnetization of the igneous rocks.
The prominent high-amplitude, moderate-wavelength magnetic high in the center of the district (Figure 2.5) correlates with a mapped biotite pyroxenite unit. The biotite pyroxenite has >10 % magnetite (Bouley et al., 1995; Lang et al., 2013) and a magnetic susceptibility around 300 x 10-3 SI. The anomaly is >8000 nT and more than an order of magnitude larger than other anomalies in the district (Figure 2.7). This magnetic anomaly extends ~2.5 km to the south and ~1.5 km to the east of the pyroxenite outcrop, suggesting that the pyroxenite unit extends to the south and east under cover.
Figure 2.7 Magnetic field profile B-B’ across the Pebble district.The amplitude of the magnetic field is dominated by pyroxenite. The Cretaceous granodiorite produces more intense magnetic anomalies than the Tertiary monzonite. Tertiary basalt produces short-wavelength magnetic high anomalies. See Figure 2.5 for profile location.
2.7 Discussion
The regional aeromagnetic data show that the Pebble district lies within a cluster of magnetic anomaly highs. The district-scale aeromagnetic data indicate that the magnetic highs correlate with mapped biotite
pyroxenite, granodiorite, gabbro, and basalt. The biotite pyroxenite and granodiorite rocks have been dated between 98 and 89 Ma, which coincides with the age of porphyry-style mineralization in the Pebble district (Lang et al., 2013). The Jurassic-Cretaceous gabbro and basalt units have not been dated, but field mapping indicates that these rocks are older than the granodiorite rocks of the Kaskanak batholith. Tertiary basalt within the East Graben appears to be volumetrically minor compared to the granodiorite rocks. The Tertiary monzonite rocks near Koktuli Mountain produce magnetic lows. Thus, the cluster of magnetic highs in the regional RTP data indicates that geology similar to that at Pebble extends under cover for an additional 30 km northeast of the Pebble deposit (Figure 2.3).
The aeromagnetic response to the rocks in the Shotgun and Bonanza Hills areas differs from the cluster of magnetic highs surrounding the Pebble deposit (Figure 2.3). The Shotgun area shows moderate-amplitude, moderate-wavelength magnetic lows surrounded by moderate-amplitude, short-wavelength magnetic highs. Such anomalies are commonly associated with reduced intrusion-related gold systems where plutons have low magnetic response, but are surrounded by magnetic highs reflecting pyrrhotite in hornfels zones (Hart, 2007). Magnetic
19
susceptibility measurements and geochemical data from the Shotgun intrusive complex suggest that the reduced granitoids in the hornfelsed Kuskokwim Group rocks are ilmenite-series (Rombach and Newberry, 2001).
The magnetic anomalies surrounding Bonanza Hills show an annulus similar to that around Shotgun but the highs and lows are reversed. Similar magnetic anomalies are found 40 km west and east of Shotgun. The magnetic anomalies surrounding Bonanza Hills are further complicated by the anomalies associated with the nearby Chilikadrotna Greenstones. More work is needed to fully understand these magnetic anomalies, but it is clear they differ significantly from the anomalies around Pebble.
Palinspastic restoration of Alaska places the igneous rocks associated with the Pebble deposit and Neacola prospect within a magmatic belt subparallel to a Late Cretaceous subduction zone (Young et al., 1997). Hart et al. (2004) suggested the presence of a magnetite-series magmatic belt between the Pebble deposit and the Neacola prospect. The magnetic-field data support the presence of such a magmatic belt and suggest it is extensive with a length of more than 400 km (Figure 2.4). The aeromagnetic data are interpreted to reflect the location of magnetite-series intrusive rocks within this belt.
The regional aeromagnetic data include clusters of magnetic highs similar to those at Pebble along a northeast trend parallel to the Lake Clark fault (Figure 2.3). These clusters are most obvious in the upwardly continued data (Figure 2.4). In the Pebble district the upward continued anomaly is centered over the Kaskanak batholith and the genetically related hydrothermal systems are on the flanks (Figure 2.8). The upward continuation anomalies are suggestive of a relatively deep magnetic source (Blakely et al., 1985; Ressel and Henry, 2006; Saltus et al., 2007). Alternatively, these anomalies could indicate the presence of voluminous, magnetic rocks at the surface, such as basalt flows, although there is little geologic evidence to support this possibility (Figure 2.2). The upward continued magnetic anomaly in the Pebble district is interpreted to reflect the granodiorite rocks of the Kaskanak batholith. On the flanks of the anomaly and batholith are several genetically related porphyry deposits or occurrences (Pebble, 37, 308, 38, and 65 Zones). Porphyry deposits in other districts commonly are found in clusters flanking a batholithic body (Seedorff et al., 2005).
Figure 2.8 Comparison of the interpreted magnetic data sets over the Pebble district.Warm colors indicate magnetic highs and cool colors reflect magnetic lows. A. District-scale RTP data showing the magnetic anomaly highs are largely over the Kaskanak batholith. Also evident are basalts in the East Graben. Younger monzonite rocks on Koktuli Mountain are imaged as a magnetic low. B. Zoomed in regional-scale RTP data showing that the Kaskanak
20
batholith correlates with clusters of magnetic anomaly highs. In contrast are the magnetic anomaly lows on Koktuli Mountain. The graben basalts are evident but are less resolved than in the district-scale data. C. Zoomed in regional-scale upward continued data show the anomaly is centered over the Kaskanak batholith and the Cretaceous age hydrothermal systems are found on the flanks of the anomaly.
The Kijik occurrence, 75 km to the northeast of the Pebble district, is located on the edge of an upward continued anomaly. The intrusive rocks at this occurrence have not been dated. However, spatially associated with this anomaly are three mafic to intermediate dikes with 40Ar/39Ar plateau ages from hornblende between 101 and 97 Ma (Amato et al., 2007), which are only slightly older than the igneous rocks at Pebble. The geochemistry of these calc-alkaline dikes is similar to both typical arc- and rift-related rocks. Whether mineralization at Kijik is genetically related to these calc-alkaline rocks is unknown, but the similar aged igneous rocks together with the interpreted aeromagnetic signature make this area highly prospective for porphyry-style deposits.
Approximately 80 km northeast of Kijik and, within another upwardly continued anomaly, is the Neacola porphyry prospect with ~95 Ma K/Ar hornblende ages on associated igneous rocks (Young et al., 1997). Like the Pebble district, the Neacola hydrothermal system is located on the flanks of an upward continued anomaly. Rocks with radiometric age dates between 101 and 84 Ma, similar to the intrusive rocks at Pebble, are exposed along the flanks of this anomaly.
Upward continued magnetic anomalies also extend to the southwest of the Pebble deposit (Figure 2.4) in an area dominated by Quaternary surficial deposits (Figure 2.1). A magnetic anomaly 90 km to the southwest of the Pebble district coincides with porphyry-style mineralization at the Iliamna prospect that is of uncertain age. This hydrothermal system is on the flanks of the upward continued anomaly. The anomaly 40 km farther to the southwest of the Iliamna prospect has not been investigated.
The granitic intrusive rocks at Shotgun and Bonanza Hills have radiometric age dates between 70 and 64 Ma (Eakins et al., 1978; Rombach and Newberry, 2001). These rocks do not produce magnetic anomalies within the upward continued data, suggesting they lack a relatively deep magnetic source.
Upward continued anomalies also are present off-strike of the Lake Clark fault in the Togiak terrane and Kuskokwim basin. The anomaly at Kemuk is associated with 86 Ma ultramafic rocks. The anomaly 35 km to the southwest of Kemuk has 84 Ma igneous rocks associated with it, however little else is known. The RTP data show the anomaly has a similar wavelength to the magnetic anomaly over Kemuk, however, the axial dimension of the anomaly is significantly longer. The RTP data show several highs along the axis of the composite anomaly, suggesting a series of magnetic sources along the axis. The highs have similar dimensions to the Kemuk anomaly and may indicate additional Alaska-type ultramafic complexes. Further work is needed to better understand this complex anomaly. The magnetic anomaly 30 km to the south of Shotgun is similar to the prominent magnetic anomaly over Kemuk. Both anomalies are elongated along a north-south direction approximately 15 km in size, and fringed by a magnetic low. Although speculative, the similarities suggest the poorly understood magnetic anomaly to the south of Shotgun may represent another Alaska-type ultramafic complex.
High-resolution aeromagnetic data from the Pebble district indicate that the area contains a variety of igneous rocks with different magnetic properties. The oldest rocks associated with the Pebble age igneous event are 98 to 96 Ma biotite pyroxenites. These rocks are strongly magnetic and form a high-amplitude,