Genome-wide association meta-analyses and
fine-mapping elucidate pathways influencing
albuminuria
Alexander Teumer
et al.
#Increased levels of the urinary albumin-to-creatinine ratio (UACR) are associated with higher
risk of kidney disease progression and cardiovascular events, but underlying mechanisms are
incompletely understood. Here, we conduct trans-ethnic (n = 564,257) and
European-ancestry speci
fic meta-analyses of genome-wide association studies of UACR, including
ancestry- and diabetes-speci
fic analyses, and identify 68 UACR-associated loci. Genetic
correlation analyses and risk score associations in an independent electronic medical records
database (
n = 192,868) reveal connections with proteinuria, hyperlipidemia, gout, and
hypertension. Fine-mapping and trans-Omics analyses with gene expression in 47 tissues
and plasma protein levels implicate genes potentially operating through differential
expres-sion in kidney (including
TGFB1, MUC1, PRKCI, and OAF), and allow coupling of UACR
associations to altered plasma OAF concentrations. Knockdown of
OAF and PRKCI orthologs
in
Drosophila nephrocytes reduces albumin endocytosis. Silencing fly PRKCI further impairs
slit diaphragm formation. These results generate a priority list of genes and pathways for
translational research to reduce albuminuria.
https://doi.org/10.1038/s41467-019-11576-0
OPEN
Correspondence and requests for materials should be addressed to A.T. (email:ateumer@uni-greifswald.de) or to C.P. (email:cristian.pattaro@eurac.edu) or to A.Köt. (email:anna.koettgen@uniklinik-freiburg.de).
#A full list of authors and their affiliations appears at the end of the paper.
123456789
H
igher levels of the urinary albumin-to-creatinine ratio
(UACR) are associated with adverse clinical outcomes,
such as end-stage kidney disease, cardiovascular disease
(CVD), and mortality
1–5. Elevated UACR is a measure of kidney
damage that is used to diagnose and stage chronic kidney disease
(CKD)
6, which affects >10% of adults worldwide
7, and represents
a hallmark of diabetic kidney disease
8. Even moderate elevations
in UACR predict poorer health outcomes, independently of the
glomerular
filtration rate
4,5. Lowering of UACR by
pharmacolo-gical inhibition of the renin–angiotensin–aldosterone system
(RAAS) is considered renoprotective standard of care to slow
CKD progression.
9–11RAAS blockage is associated with a
reduction of albuminuria and lower risk of end-stage kidney
disease
12and CVD events
10,13–15. However, the risk of CVD
events among CKD patients remains high
3. A better
under-standing of the pathways related to the development and
con-sequences of albuminuria may facilitate the search for novel
therapies to treat or prevent CKD progression and CVD.
Levels of UACR have a heritable component in
population-based studies and groups at high risk of CKD, such as certain
indigenous populations or persons with diabetes
16–20. However,
the identification of genetic loci for UACR through genome-wide
association studies (GWAS) has proven difficult, and detected loci
showed variable effects across ancestries or disease groups
21.
Initial GWAS of UACR identified only two genome-wide
sig-nificant loci, CUBN
22,23and HBB
24. A complementary approach
using admixture mapping also identified the BCL2L11 locus
25.
One additional
finding in patients with type I diabetes
26was not
detected in type II diabetes patients or the general population.
Only very recently, a Mendelian Randomization study assessing a
potentially causal effect of UACR on cardiometabolic traits based
on data from the UK Biobank (UKBB) reported 33 genome-wide
significant single-nucleotide polymorphisms (SNPs) associated
with UACR
27. The study supported a causal effect of higher
UACR on elevated blood pressure and postulated that inhibition
of UACR-increasing pathways could have anti-hypertensive
effects and thereby reduce CVD risk.
In this project, we characterize known and identify additional
novel genetic loci for UACR through trans-ethnic meta-analysis
of GWAS from 564,257 participants, including an internal
vali-dation step and secondary analyses among participants with
diabetes. To prioritize the most likely causal variants, genes,
tis-sues, and pathways in associated loci, we perform functional
enrichment analyses, statistical
fine-mapping and integrative
trans-Omics analyses, including with gene expression in 47
human tissues and plasma protein levels. Clinical correlates are
identified through genome-wide genetic correlation analyses and
a phenome-wide association scan of a genetic risk score for
UACR in a large independent population. We evaluate translation
to mechanistic insights in proof-of-concept studies for OAF and
PRKCI using an experimental model of albuminuria. Together,
the implicated variants, genes, proteins, tissues, and pathways
provide a rich resource of new targets for translational research.
Results
The workflow of our study, which identified 68 UACR-associated
loci across primary and secondary analyses, is illustrated in
Supplementary Fig. 1.
Primary analysis: identi
fication of 59 loci for UACR. The data
based on 564,257 individuals from 54 studies were combined in a
trans-ethnic meta-analysis of UACR, including 547,361 of
Eur-opean ancestry (EA), 6795 African Americans (AA), 6324 of East
Asian ancestry, 2335 of South Asian ancestry, and 1442 Hispanics
(Supplementary Data 1). The median of the median UACR across
studies was 7.5 mg/g, and an average of 14.9% (range 3.2–70.9%)
of participants had microalbuminuria (MA, UACR > 30 mg/g).
Study-specific GWAS of UACR were carried out using imputed
genotypes (Methods, Supplementary Data 2). We performed
study-specific variant filtering and quality control (QC), followed
by
fixed-effects inverse-variance weighted meta-analysis. There
was no evidence of unaccounted stratification (LD score
regres-sion intercept 0.95; genomic control (GC) parameter
λ
GC1.03).
Downstream analyses were based on 8,034,757 SNPs available
after variant
filtering (Methods). Using SNPs of minor allele
frequency (MAF) > 1% across the genome, the heritability of
UACR was estimated as 4.3%.
We identified 59 UACR-associated loci, defined as 1 Mb
genomic segments carrying at least one SNP associated with
UACR with p < 5 × 10
−8(Methods; Fig.
1
, Supplementary Data 3).
The index SNP mapped within 500 kb of previously reported
index SNPs for UACR at 27 loci, considered known, and the
remaining 32 loci were considered novel. These 59 SNPs explained
0.69% of the variance of the inverse normal transformed UACR
residuals. There was little evidence of between-study heterogeneity
(median I
2statistic 3.2%; Supplementary Data 3), with all index
SNPs showing an I
2of <50%. In meta-regression analysis
(Methods), none of the 59 index SNPs showed evidence of
ancestry-related heterogeneity after multiple testing correction
(p < 8.5 × 10
−4, Fig.
1
; Supplementary Data 3)
28. Regional
association plots of all loci are displayed in Supplementary Fig. 2.
Some of the loci contain biologically plausible candidates in
addition to the known CUBN (cubilin) locus: for example, rare
mutations in COL4A4 (Collagen Type IV Alpha 4 Chain) cause
Alport syndrome, a monogenic disease of basement membranes
that frequently leads to end-stage kidney disease. Recent
sequencing studies show that the phenotypic spectrum of rare
COL4A4 mutations extends to focal segmental glomerulosclerosis,
which typically presents with proteinuria
29,30. Our study extends
the genetic spectrum to common COL4A4 variants associated
with UACR in mostly population-based studies. Another example
is NR3C2 (Nuclear Receptor Subfamily 3 Group C Member 2),
which encodes the mineralocorticoid receptor that mediates
aldosterone action. Pharmacological inhibition of the RAAS is the
mainstay treatment to lower albuminuria, illustrating the
potential for pharmacological intervention on pathways identified
in this project.
Lastly, we estimated the number of expected discoveries and
the corresponding percentage of GWAS heritability explained in
future studies of yet larger sample size (Methods)
31and found
that such studies can be expected to detect additional UACR loci
(Supplementary Fig. 3).
Concordance between CKDGen cohorts and UK Biobank. To
assess the influence of the UKBB, the largest study in the
dis-covery sample (n
= 436,392), we compared association statistics
for the 59 index SNPs from the UKBB to the corresponding
estimates from the 53 other studies participating in the CKDGen
Consortium (n
≤ 127,865). Effect direction was consistent for all
59 index SNPs (p
binomial test= 3.5 × 10
−18; Fig.
2
a), and 53 showed
nominally significant associations in the CKDGen cohorts alone
(p < 0.05; Supplementary Data 4). Two loci with strong effects in
UKBB but not significant in CKDGen were AHR (aryl
hydro-carbon receptor) and CYP1A1 (Cytochrome P450 Family 1
Subfamily A Member 1), potentially reflecting factors related to
standardized sample handling, storage, and measurements in the
UKBB, or population-specific exposures.
Secondary ancestry-speci
fic and diabetes-specific analyses. First,
we conducted ancestry-specific meta-analyses for EA (n =
547,361) and for AA (n
= 6795), where ancestry-specific loci have
been described
32,33. There was little evidence of inflation of the
results (λ
GC1.06 for AA and 1.01 for EA; Methods). These
meta-analyses identified 61 loci in EA, of which 56 overlapped with
those from the primary trans-ethnic meta-analysis
(Supplemen-tary Data 5 and further discussed below), and no genome-wide
significant loci in AA. The known UACR-associated sickle cell
trait variant rs334 in HBB showed suggestive association in the
AA-specific analysis (p = 6.1 × 10
−8).
The other secondary analysis was restricted to 51,541
individuals with diabetes, in whom a larger effect of the known
CUBN locus has been reported
23. This analysis identified eight
loci (Supplementary Fig. 4), four of which were not detected in
the primary meta-analysis (KAZN [Kazrin, Periplakin Interacting
Protein], MIR4432HG-BCL11A, FOXP2, and CDH2). Internal
validation of the UKBB (n
= 21,703) and CKDGen cohorts (n ≤
29,812) statistics found the effects to be direction consistent, of
similar magnitude and at least nominally significant in both
subsets at all eight loci (Supplementary Data 6). Index SNPs at
CUBN and HPN (Hepsin) showed larger effect sizes among those
with diabetes compared with the overall sample (Supplementary
Data 6). Among the novel loci, it is noteworthy that BCL11A, a
transcriptional regulator of insulin secretion
34, is involved in
fetal-to-adult globin switching, as is the known UACR risk gene
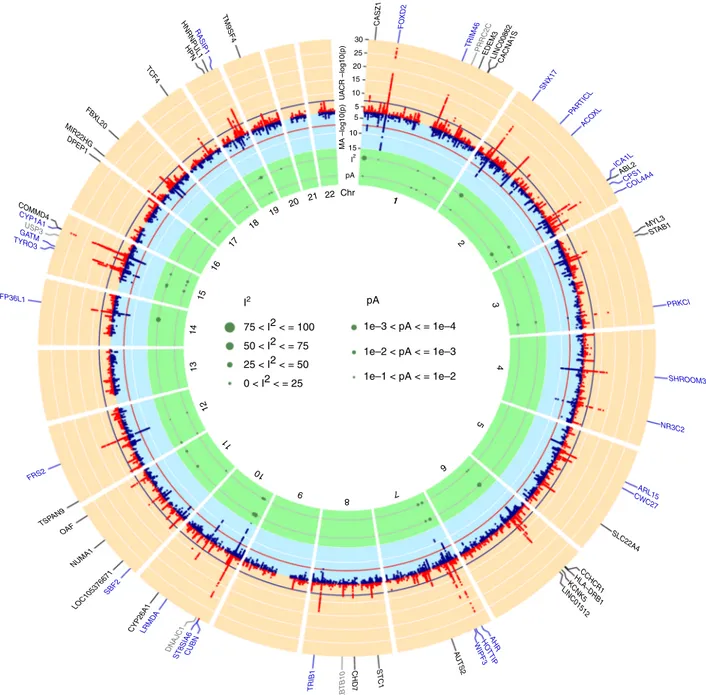
I2 I2 1 75 < I2 < = 100 1e–3 < pA < = 1e–4 1e–2 < pA < = 1e–3 1e–1 < pA < = 1e–2 50 < I2 < = 75 25 < I2 < = 50 0 < I2 < = 25 pA Chr 1 2 4 3 5 6 7 8 9 10 11 12 13 14 15 16 17 18 19 20 21 22 30 CASZ1 FOXD2 TRIM46 EDEM3 PRRC2C LINC00862CACNA1S SNX17 PAR TIC L ACO XL ICA1L ABL2 CPS1 COL4A4 STAB1 MYL3 PRKCI SHROOM3 NR3C2 ARL15 CWC27 SLC22A4 CCHCR1 HLA–DRB1 KCNK5 LINC01512 AHR HO TTIP WIPF3 AU TS 2 STC1 CHD7 ZBTB10 TRIB1 CUBN ST8SIA6 DNAJC1 LRMD A CYP26A1 SBF2 NUMA1 LOC105376671 OAF FRS2 TSP AN9 ZFP36L1 TYR O3 GAUSP3TM CYP1A1 COMMD4 DPEP1 MIR22HG FBXL20 TCF4 HPN HNRNPUL1 TM9SF4 RASIP1 25 20 10 15 5 5 10 MA –log10(p) U A CR –log10(p) 15 pA
Fig. 1 Genome-wide association results. The circos plot provides an overview of the association results: Red band:–log10(p) for association in the
trans-ethnic meta-analysis of urinary albumin-to-creatinine ratio (UACR), ordered by chromosomal position. The blue line indicates genome-wide significance (p = 5 × 10⁻⁸). Black gene labels indicate novel loci, blue labels indicate known loci (known index SNP within ± 500 kb region of current index SNP), gray labels indicate loci not associated with UACR at the nominal significance level (p ≥ 0.05) in the 53 CKDGen cohorts without UKBB. Blue band: –log10(p) for
association with microalbuminuria (MA), ordered by chromosomal position. The red line indicates genome-wide significance (p = 5 × 10⁻⁸). Green band: measures of heterogeneity related to the UACR-associated index SNPs, where the dot sizes are proportional to two measures of heterogeneity, I² and the –log10(p) for heterogeneity attributed to ancestry (pA)
HBB. KAZN encodes for a protein with a role in actin
organization and adhesion
35that is highly abundant in glomeruli.
QQ plots and Manhattan plots of the secondary meta-analyses
are shown in Supplementary Figs. 5 and 6.
Functional enrichment and pathways. We searched for tissues,
cell types, and systems that are enriched for the expression of
genes mapping to the UACR-associated loci (Methods)
36. Based
on all SNPs with p < 5 × 10
−8from the trans-ethnic
meta-analysis, there was no significant (false discovery rate [FDR] <
0.05) enrichment after correction for multiple testing
(Supple-mentary Data 7). Nominally significant associations (p < 0.05)
were observed for 37 annotations mapping into six systems
(urogenital including kidney, endocrine, digestive including liver,
musculoskeletal, respiratory, sense organs; Supplementary Fig. 7)
and
five tissues (exocrine glands, prostate, mucous membrane,
membranes, and respiratory mucosa). These results reveal
plau-sible enrichments although they did not reach significance after
correction for multiple testing.
CASZ1 TRIM46 SNX17 CUBN 0.2
a
c
b
0.1 0.0 UKBB U A CR eff ect siz e [sd of log(U A CR)] –0.1 1.75 1.5 1.2 1.1 –0.1 0.0UACR effect size [sd of log(UACR)]
0.1 0.2
–0.1 0.0
CKDGen without UKBB UACR effect size [sd of log(UACR)]
0.1 0.2 r = 0.97 1.05 1 Microalb umin ur ia odds r atio 0.95 0.9 FOXD2 CASZ1 SNX17 PRKCI SHROOM3 NR3C2 AHR WIPF3 TRIB1 CUBN ST8SIA6 LRMDA FRS2 ZFP36L1 TYRO3 CYP1A1 FBXL20 r = 0.99 SHROOM3 STC1 ZFP36L1 PRKCI SBF2 CWC27 FOXD2 ST8SIA6 HNRNPUL1 KCNK5 SLC22A4 HPN WIPF3 TRIM46 DPEP1 ACOXL CASZ1 LINC01512 TYRO3 ARL15 CUBN SNX17 OAF TM9SF4 NR3C2 LRMDA FBXL20 ZBTB10 NUMA1 MYL3 FRS2 CPS1 TSPAN9 LOC105376671 GATM TCF4 RASIP1 PARTICL AUTS2 USP3 PRRC2C HOTTIP CYP26A1 CYP1A1 DNAJC1 CHD7 CACNA1S AHR EDEM3 ABI2 COMMD4 LINC00862 ICA1L TRIB1 −0.025 0.000 0.025 0.050 0.250 −0.06 −0.03 0.00 0.03 0.06 UKBB urinary creatinine effect size
[sd of urinary creatinine] UKBB ur inar y alb umin eff ect siz e [sd of ur inar y alb umin] r = –0.02
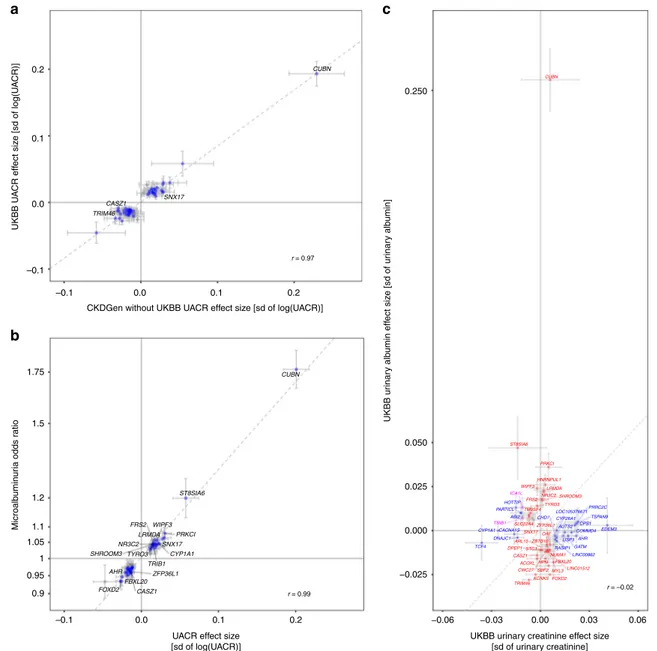
Fig. 2 Internal concordance of the urinary albumin-to-creatinine ratio (UACR) results, and association with microalbuminuria, urinary creatinine and albumin.a Comparison of effect estimates of the 59 genome-wide significant trans-ethnic UACR index SNPs in the UKBB (x-axis) and in the CKDGen cohorts without UKBB (y-axis). Blue dots indicate nominal significance (p < 0.05) in the CKDGen cohorts without UKBB, and loci at genome-wide significance (p < 5 × 10⁻⁸) in that meta-analysis are labeled with the closest gene.b Comparison of effect estimates of the 59 trans-ethnic UACR index SNPs (x-axis) with their corresponding estimate from the GWAS of microalbuminuria (MA; y-axis). Blue dots indicate significance in the MA results after multiple testing correction (p < 0.05/59 = 8.5 × 10⁻⁴), and loci that achieved genome-wide significance (p < 5 × 10⁻⁸) for MA are labeled. In both panels, the dashed line represents the line of bestfit through the effect estimates. c Comparison of effect estimates of the 59 genome-wide significant trans-ethnic UACR index SNPs for their effect on urinary creatinine (x-axis) and urinary albumin levels (y-axis) in the UKBB sample. Blue, red, and purple color indicate significant associations after multiple testing correction (p < 0.05/59 = 8.5 × 10⁻⁴) with urinary creatinine, urinary albumin, and both, respectively. Significant associations are labeled with the closest gene name. The dashed line represents the median y = x. In all panels, error bars indicate 95% confidence intervals (CIs), and the Pearson correlation coefficient r between the effect estimates is shown. The effect directions correspond to the effect allele of the trans-ethnic UACR meta-analysis results
Next, we evaluated whether reconstituted gene sets were
significantly (FDR < 0.05) enriched for genes mapping to
UACR-associated loci, and identified three sets with FDR < 0.01
(embryonic development, partial embryonic lethality during
organogenesis, abnormal placental labyrinth vasculature
mor-phology). The remaining significant gene sets included terms that
can be reconciled with existing knowledge about albuminuria,
including
“tube development”, “abnormal kidney morphology”,
and several terms related to vascular development and
morphol-ogy (Supplementary Data 8).
UACR-associated loci are associated with MA. Clinical MA
(UACR > 30 mg/g) is associated with increased risk for adverse
kidney and cardiovascular outcomes, as well as mortality
3. We
therefore evaluated the association of the 59 UACR index SNPs
with MA by meta-analyzing data from 36 cohorts and 347,283
individuals (Supplementary Data 1; Fig.
1
). Figure
2
b shows that
for all UACR index SNPs, the allele associated with higher UACR
was associated with an increased risk of MA (Supplementary
Data 3). Of the 59 SNPs, 49 were significantly associated with MA
after correction for multiple testing (p < 0.05/59
= 8.5 × 10
−4),
including 17 that reached genome-wide significance. The
low-frequency missense SNP rs45551835 in CUBN showed the largest
effect with an odds ratio (OR) of 1.76 (95% CI 1.67–1.87) per
minor allele. When 232,751 UKBB participants were grouped into
quartiles based on a UACR genetic risk constructed from the 59
index SNPs, each quartile showed a significantly higher OR for
MA compared with the lowest quartile (e.g., OR of 1.69 for
quartile 4 vs. 1, p
= 3.0 × 10
−191, Supplementary Table 1).
UACR loci: association with urinary albumin and creatinine.
The UACR is a ratio. Understanding whether a genetic locus is
more strongly associated with its numerator, albumin, or with its
denominator, creatinine, may provide important physiological
insights. We therefore performed separate tests for urinary
albumin and creatinine in the UKBB sample (n
Ualbumin=
436,398; n
Ucreatinine= 436,412). Of the 59 index SNPs, 31 were
significantly associated with urinary albumin (p < 8.5 × 10
−4), 21
with urinary creatinine, and two with both. The CUBN locus
showed the largest effect on urinary albumin, and was not
sig-nificantly associated with urinary creatinine levels (Fig.
2
c),
fol-lowed by ST8SIA6 (ST8 alpha-N-acetyl-neuraminide
alpha-2,8-sialyltransferase
6),
PRKCI
(protein
kinase
C
iota),
TRIM46/MUC1 (Mucin 1, cell surface associated), HNRNPU
L1/TGFB1 (transforming growth factor beta 1), FOXD2, KCNK5,
WIPF3 (WAS/WASL interacting protein family member 3),
LRMDA, and NR3C2.
A genetic UACR score is associated with medical diagnoses.
Next, we evaluated whether a weighted genetic risk score (GRS)
composed of UACR-increasing alleles was associated with clinical
endpoints in a large, independent electronic medical record
database to detect diagnoses with potentially shared genetic
components or co-regulation. We tested associations with 1422
billing code-based phenotypes of up to 192,868 EA participants
of the Million Veteran Program (MVP) from US Veterans’
Administration facilities
37. Significant associations (p < 3.5 ×
10
−5, 0.05/1,422) were detected with 10 diagnoses: proteinuria,
four related to hyperlipidemia, two related to hypertension, two
related to gout, as well as Fuchs’ dystrophy (Fig.
3
). While the
association with disorders of lipoid metabolism had the lowest
p-value (p
= 4.1 × 10
−11), the association with Fuchs’ dystrophy
showed the greatest magnitude (OR
= 6.68 per SD increase of log
[UACR], 95% CI 3.06–14.59, p = 1.9 × 10
−6), followed by
pro-teinuria (OR
= 2.7, 95% CI 1.76–4.14, p = 5.0 × 10
−6). Many
other associations that approached statistical significance were
related to the kidney and metabolic diseases (Supplementary
Data 9).
The association with Fuchs’ disease, a dystrophy of the corneal
endothelium, was unexpected and assessed in greater detail.
Autosomal-dominant forms of Fuchs’ dystrophy have been
attributed to genetic variation in TCF4 (transcription factor 4)
38,
a novel UACR-associated locus identified here (index rs11659764,
p
= 2.8 × 10
−11; r
2= 0.21, D' = −0.97 with rs613872, a previously
reported Fuchs index SNP
39). After exclusion of the TCF4 index
SNP, the GRS was still significantly associated with proteinuria,
hyperlipidemia codes, gout, and hypertension with nearly identical
ORs, but the association with Fuchs’ dystrophy disappeared (p =
0.2). This illustrates that unexpected significant associations from
PheWAS require careful evaluation.
We also evaluated an association of the GRS with
cardiovas-cular outcomes based on published GWAS and the UKBB
(Supplementary Table 2). This revealed significant (p < 0.007,
Methods) positive associations of the GRS with an increased risk
of hypertension (p
= 2.4 × 10
−21). Conversely, weighted genetic
risk scores based on recently published GWAS of systolic and
diastolic blood pressure as well as of type 2 diabetes were
positively associated with UACR (p
= 3.5 × 10
−63for systolic and
p
= 1.2 × 10
−24for diastolic blood pressure, p
= 1 × 10
−10for
type 2 diabetes; Supplementary Table 2).
Genome-wide genetic correlations of UACR. Albuminuria is
associated with multiple cardiovascular and metabolic traits and
diseases
4,40–42. In addition to the GRS analyses, we thus also
assessed genome-wide genetic correlations between the
EA-specific UACR association statistics and 517 traits and diseases
(Methods; Supplementary Data 10). Significant genetic
correla-tions (p < 9.7 × 10
−5[0.05/517]) were observed for 67 traits
(Fig.
4
). The strongest negative correlations were observed for
urinary creatinine and other urinary parameters, and the largest
positive genetic correlations with different measures of
hyper-tension. These
findings provide support for the observational
association between albuminuria and blood pressure on a genetic
level, the significant associations between the UACR GRS and
hypertension in the MVP population, and the recent Mendelian
Randomization study of UACR
27. Negative genetic correlations
with anthropometric measures are potentially explained by their
positive associations with muscle mass, and hence creatinine
concentrations.
Statistical
fine-mapping and secondary signal analysis.
Statis-tical
fine-mapping was performed using summary statistics to
prioritize SNPs or sets of SNPs (credible set) driving each
asso-ciation signal (Methods). These analyses were limited to EA,
comprising > 97% of the total sample, for whom large data sets to
estimate reference LD for summary statistics-based
fine-mapping
were publicly accessible
43,44. Based on 57 combined genomic
regions from the 61 genome-wide significant loci in EA
(Meth-ods, Supplementary Data 5), we identified 63 independent SNPs
(Supplementary Data 11). Next, 99% credible sets were computed
based on Approximate Bayes Factors, resulting in a set of SNPs
that with 99% posterior probability (PP) contained the variant(s)
driving the association signal for each of the 63 conditionally
independent signals
45. The credible sets contained a median of 25
SNPs (Quartile 1: 10; Quartile 3: 74). Two credible sets at CUBN
and one at PRKCI consisted of a single SNP (Supplementary
Data 12). The previously described CUBN missense SNP
rs45551835 (p.A2914V) had a PP of causing the association signal
of >99.9%. There were 11 small credible sets with
≤5 SNPs,
representing candidate causal variants for further study.
12
Disorders of lipoid metabolism
Hyperlipidemia Mixed hyperlipidemia Fuchs’ dystrophy Hypertension Proteinuria Gout Essential hypertension
Gout and after other crystal arthropathies
Hypercholesterolemia 9 6 –log 10 (p ) Inf ectious diseases Neoplasms Endocr ine/metabolicHematopoietic Mental disorders NeurologicalSense organs
Circulator y system Respir atoty Digestiv e Genitour inar y Pregnancy complications Der matologic Musculosk eletal Congenital anomalies Symptoms Injur ies & poisonings
0
Phenotypes 3
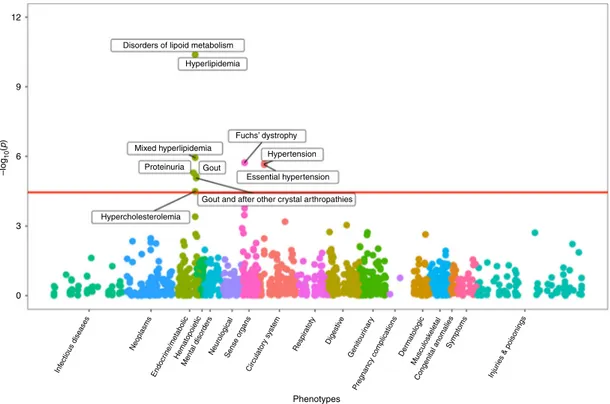
Fig. 3 Phenome-wide association scan of a genetic urinary albumin-to-creatinine ratio (UACR) risk score. PheWAS association results were obtained from EA participants of the Million Veteran Program. Association test -log10(p-values) are plotted on the y-axis, and the corresponding trait or disease category
on thex-axis. Significant results, after correcting for the 1422 phenotypes tested (p < 0.05/1422 = 3.5 × 10⁻⁵), are labeled in thefigure
−0.75 −0.50 −0.25 0.00 0.25 0.50 0.75 1−y ear w eight change Right a rm fat−free mass Left ar m predicted mass Right ar m predicted mass Left ar m f at−free mass Basal metabolic r ate Whole body f at−free mass Whole body w ater mass
Trunk predicted massTr unk f at−free mass Weight Left leg f at−free mass Right leg f at−free mass
Left leg predicted mass Right leg predicted mass
Trunk f at mass Sitting height Whole body f at mass Right hand gr ip strength Standing heightLeft leg f
at mass Left ar m f at mass Right leg fat mass Right ar m f at mass Hip circumf erence Left hand g rip strength Trunk f at percentage
Body mass inde x (BMI) Waist circumf erence Body f at percentage Height at age 10 Left leg fat percentage Impedance of left a rm Impedance of r ight ar m Diastolic b lood pressure Self−repor ted h yper tension Diagnosed h yper tension Hype rtension medication in men Hyper tension medication in women Systolic blood pressure Hyper tension mother Hype rtension sib lings Hype rtension f ather
Education: no qualificationsEducation: college degree Education: A l
evel qualificationsUr ine creatinine
Urine potassium Urine sodium
Renal and ureter calculus Wor k tr anspor t: car Time w atching TV Non−w ork transpo rt: car Time spent dr iving Non−w ork transpor t: w alk
Stair climbing frequency No f ather illness No dieta ry supplement No si bling illness No hea rt pro blems No medication in women No medication in men No vitamin supplement Number of treatments/medications No pain exper ienced
Weekly red wine inta ke
Fish oil supplement
Genetic correlation Category Anthropometric Cardiometabolic Education Kidney Personality Other P−value 1e−6 < = P < 9.7e−5 1e−8 < = P < 1e−6 1e−12 < = P < 1e−8 1e−30 < = P < 1e−12 P < 1e−30
Fig. 4 Genetic correlation of urinary albumin-to-creatinine ratio (UACR) with other traits and diseases. Significant (p < 9.7 × 10⁻⁵) genetic correlations based on the genome-wide summary statistics from the EA UACR GWAS and 517 pre-computed and publicly available GWAS summary statistics of UKBB traits and diseases, available through LDHub. Traits are shown on thex-axis, and colored according to broad physiological categories. Genetic correlations between traits and UACR are reported on they-axis. Dot size is proportional to the –log10(p) of the corresponding genetic correlation
All 995 SNPs with PP > 1% were annotated. Regulatory
potential was assessed via mapping into regions of open
chromatin identified from primary cultures of human tubular
and glomerular cells (GEO accession number GSE115961)
46and
from publicly available kidney cells types (ENCODE and
Roadmaps Projects; Methods). Supplementary Data 12
sum-marizes annotation information for all variants with PP > 1% that
mapped into small credible sets or those containing a SNP with
PP > 50%. Among these, there were four missense SNPs in CUBN,
CPS1, EDEM3, and GCKR (Fig.
5
a; Supplementary Table 3). One
non-exonic SNP near NUMA1 with PP > 50% mapped into open
chromatin in both glomerular and tubular primary cell cultures,
and four other SNPs in or near WIPF3, WDR81, CUBN, and
CYP26A1 mapped into putative regulatory regions in other
kidney tissues or cell lines (Fig.
5
b, Supplementary Data 12).
Association with gene expression and co-localization. We
investigated whether the UACR-association signals co-localized
with association signals for transcript abundance of any genes in
cis across 47 tissues, thereby implicating effector genes at
asso-ciated loci (Methods). Gene expression was quantified via
RNA-seq in 44 tissues from the GTEx Project [
https://gtexportal.org/
]
and in kidney cortex from The Cancer Genome Atlas
47, and via
microarray from microdissected glomerular and tubulointerstitial
portions of kidney biopsies from participants of the NEPTUNE
study
48(Methods).
We identified nine genes for which cis eQTLs in kidney tissues
co-localized with the UACR association signals with a high PP
(≥80%), implicating a shared underlying variant (Fig.
6
). These
represent candidate causal genes for further investigation
(Table
1
). Alleles associated with higher UACR were associated
with higher expression of MUC1 and PRKCI across a range of
tissues. This observation is consistent with a gain-of-function
mechanism proposed for the monogenic kidney disorder caused
by MUC1 variation
49. Conversely, alleles associated with higher
UACR were associated with lower OAF and TGFB1 expression.
The co-localization with expression of WIPF3 in glomerular
kidney portions illustrates an example of a potentially regulatory
causal variant, rs17158386, which maps into open chromatin in
kidney tissue (Figs.
5
b,
6
). Across kidney tissues, co-localization
was most often observed in glomerular kidney portions,
consistent with the prominent role of the glomerular
filtration
barrier in albuminuria. Altogether, there were 90 significant
co-localizations in at least one of the 47 evaluated tissues
(Supplementary Fig. 8).
Association with gene expression in trans requires large sample
sizes and was thus evaluated for all index SNPs in whole blood.
Excluding the extended MHC region, there was one SNP
associated with expression of one or more transcripts in trans
in more than one study (Supplementary Table 4): genotype at
rs12714144, upstream of PARTICL on chromosome 2, was
associated with the expression of DPEP3, encoded on
chromosome 16.
Association with protein levels and co-localization analyses.
Recently, large GWAS of plasma protein levels have been
pub-lished, which allow for systematic investigations of associated
variants (pQTLs). Using these data, we investigated the
associa-tion of the 61 EA index SNPs in a pQTL study of 3301 healthy EA
participants of the INTERVAL study
50. Genome-wide significant
associations were identified between 17 UACR-associated SNPs
and plasma levels of 53 unique proteins, for a total of 56
asso-ciations (Supplementary Data 13). Interestingly, concentrations of
three proteins each showed associations with two
UACR-associated index SNPs on different chromosomes, thereby
con-necting the two genetic loci through association with plasma
concentrations of the same protein: SNPs rs34257409 on
chro-mosome 1 and rs838142 on chrochro-mosome 19 with plasma
gastrokine-2 (GKN2) concentrations, rs12714144 on
chromo-some 2 and rs1010553 on chromochromo-some 3 with concentrations of
Janus kinase and microtubule interacting protein 3 (JAKMIP3),
and rs1010553 on chromosome 3 and rs2954021 on chromosome
1.0
a
b
NUMA1
DNAse hypersensitivity sites Roadmap, ENCODE kidney Roadmap, ENCODE epithelial Tubular Glomerular None WIPF3 WDR81 CUBN CYP26A1 0.8 0.6 V a riant poster ior probability 0.4 0.2 0.0 0 50 100 150
Credible set size [#SNPs] 995 SNPs with posterior probability >1%
Credible set size [#SNPs] 995 SNPs with posterior probability >1%
200 250 300 0 50 100 150 200 250 300 1.0 0.8 0.6 V a riant poster ior probability 0.4 0.2 0.0
CUBN p.Ala2914Val CADD
0 10 20 30 CPS1 p.Thr1412Asn EDEM3 p.Pro746Ser GCKR p.Leu446Pro
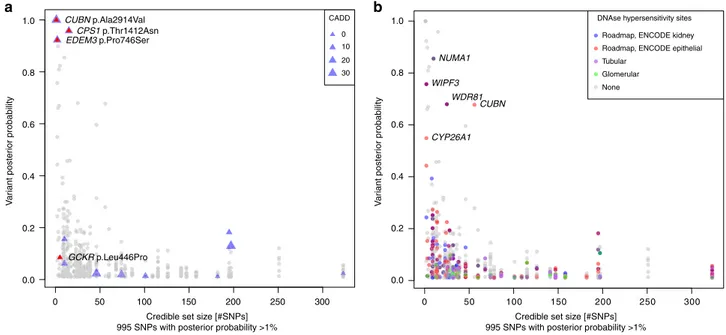
Fig. 5 Fine-mapping and functional annotation of potentially causal variants. Overview of 995 SNPs with a posterior probability of association with urinary albumin-to-creatinine ratio (UACR) of >1%. Thex-axis indicates the 99% credible set size and the y-axis the SNPs’ posterior probability of association. In panela, missense SNPs are marked by triangles, with size proportional to the SNP CADD score. In panel b, SNPs are color-coded with respect to location in regulatory regions of specific kidney tissues. The labels show the closest gene, and are restricted to variants mapping to small credible sets (≤5 SNPs), or to variants with high individual posterior probability (>0.5) of driving the association signal. For theCUBN locus, a credible set was computed for each independent SNP
8 with inter-alpha-trypsin inhibitor heavy chain 1 (ITIH1)
concentrations.
Co-localization of UACR association signals with those for
pQTLs of 38 proteins (Methods, Supplementary Table 5)
provided evidence for a shared underlying SNP for plasma
concentrations of the Out At First Homolog (OAF) protein. This
was consistent with the eQTL co-localization analyses, with the
minor T allele at rs12790943 associated with higher levels of
UACR as well as with both lower OAF transcript levels in
multiple tissues and lower OAF plasma levels (Fig.
7
). Association
patterns with UACR (Fig.
7
a) and OAF transcript levels (Fig.
7
b)
looked similar, as expected for a shared underlying variant. The
pattern looked different for OAF plasma levels, and conditional
analyses revealed two independent SNPs (rs117554512 and
rs508205; r
2= 0, D '= 0.02 in the 1000 Genomes Project EUR
sample). There was no evidence for a shared variant underlying
the associations of UACR and OAF plasma levels for the signal
tagged by the initial index SNP for OAF plasma levels,
rs117554512 (PP H4
= 0; Fig.
7
c), which was also significantly
associated with plasma levels of IL25 in trans (p
= 1.3 × 10
−12,
Supplementary Data 13). Conversely, there was strong evidence
for a shared variant underlying associations with UACR and OAF
plasma levels tagged by the second, independent signal at
rs508205 (PP H4
= 0.99; Fig.
7
d), allowing to follow associations
from genetic variants to transcript, protein, and phentoype. The
SNP rs508205 is located upstream of OAF, and was also the index
variant identified in the trans-ethnic meta-analysis of UACR
(r
2= 0.94 with rs12790943 in the 1000 Genomes
Pro-ject EUR sample). It represents an interesting regulatory
candidate variant because of its relatively small credible set of
eight SNPs, a CADD score of 13, and its localization in open
chromatin in kidney tissue.
In vivo analyses of Drosophila orthologs. Finally, we used a
Drosophila model to establish proof-of-principle that prioritized
candidates can be used to gain mechanistic insights into
albu-minuria. Drosophila nephrocytes are specialized cells that harbor
a slit diaphragm formed by the orthologs of the mammalian slit
diaphragm proteins. These cells exhibit size-dependent molecule
filtration across the slit diaphragm, followed by endocytosis via
the scavenger receptor Cubilin and
finally lysosomal degradation
or storage. Protein endocytosis mainly occurs within a network of
membrane invaginations, the labyrinthine channels. Formation of
the labyrinthine channels depends on presence of functional slit
diaphragms. Thus, these cells reflect aspects of glomerular
(slit diaphragm) and proximal tubular function (protein
endo-cytosis)
51. Studying endocytosis of a tracer molecule able to pass
the slit diaphragm, such as albumin, renders an integrative
read-out of nephrocyte function
52: FITC-albumin uptake declines both
through loss of slit diaphragms and also through impaired
pro-tein endocytosis. We selected three candidates for functional
study, based on their associations with urinary albumin (Fig.
2
c),
support from downstream
fine-mapping and co-localization
analyses (Table
1
), and degree of conservation and availability
of at least two independent Drosophila RNAi lines per gene: OAF,
PRKCI, and WIPF3. Orthologs of OAF (oaf), PRKCI (aPKC), and
WIPF3 (Vrp1) were silenced specifically in nephrocytes by
crossing Dorothy-GAL4 with the respective UAS-RNAi line.
Nephrocytes stained with an available antibody for aPKC
showed a strongly reduced signal using two independent
aPKC-RNAi lines (Supplementary Fig. 9A–C). We observed no effect of
Vrp1-RNAi on nephrocyte function studying FITC-albumin
endocytosis (Supplementary Fig. 9D, E). In contrast, we detected
a significant reduction of tracer endocytosis upon silencing oaf
and aPKC (Fig.
8
a, b). This indicates a functional requirement of
these genes within nephrocytes and supports a role of their
human orthologs in glomerular
filtration or tubular re-uptake of
albumin. To distinguish between these roles, we studied
immunofluorescence of the Drosophila slit diaphragm proteins,
whose staining patterns remain unaltered in isolated defects of
protein endocytosis. Despite the significant impairment of
nephrocyte function, we observed a slit diaphragm staining
pattern comparable to control conditions for oaf-RNAi (Fig.
8
c–f).
This suggests that oaf may be dispensable for slit diaphragm
formation, but likely is involved in protein reabsorption.
Accordingly, co-localization with OAF gene expression in human
kidney was observed in the renal cortex, reflecting largely
tubulointerstitial portions, and protein staining in the Human
Protein Atlas is observed in tubules but not glomeruli.
Conversely, silencing the ortholog of PRKCI entailed an extensive
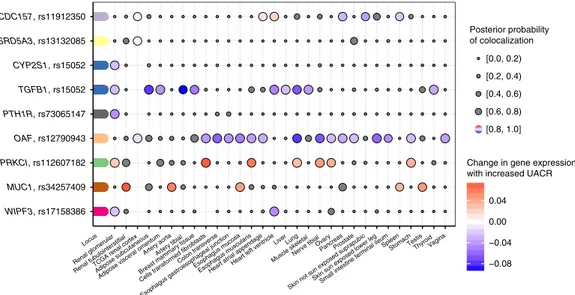
WIPF3, rs17158386 MUC1, rs34257409 PRKCI, rs112607182 OAF, rs12790943 PTH1R, rs73065147 TGFB1, rs15052 CYP2S1, rs15052 SRD5A3, rs13132085 CCDC157, rs11912350 Renal glomerular Renal tubulointerstitialTCGA renal cortexAdipose subcutaneous
Adipose visceral omentum Artery aortaArtery tibial Breast mammary tissue Cells transformed fibroblasts
Colon transverse
Esophagus gastroesophageal junction Esophagus mucosa
Esophagus muscularisHeart atrial appendage Heart left ventricle
LiverLung Muscle skeletal
Nerve tibial Ovary
PancreasProstate
Skin not sun exposed suprapubic Skin sun exposed lower legSmall intestine terminal ileum
SpleenStomachTestis ThyroidVagina Posterior probability of colocalization [0.0, 0.2) [0.2, 0.4) [0.4, 0.6) [0.6, 0.8) [0.8, 1.0] −0.08 −0.04 0.00 0.04
Change in gene expression with increased UACR
Locus
Fig. 6 Co-localization of associations signals for urinary albumin-to-creatinine ratio (UACR) and gene expression in kidney tissues. The plot shows the nine genes for which there is a high likelihood (posterior probability≥ 80%) of a shared causal signal for gene expression in at least one of three kidney tissues and UACR. The loci are colored-coded and shown on they-axis with the closest gene next to the index SNP. Co-localization with gene expression across all tissues (x-axis) is shown as dots, where the size of the dots (implying that eQTL data were available) corresponds to the posterior probability of the co-localization. The change in UACR is color-coded relative to the change in gene expression, or gray in case of a posterior probability < 80%
Table
1
Evidence
for
candidate
causal
genes
at
U
ACR
-associated
variants
Gene SNP H4 coloc Credible set size SNP PP Functional consequence CADD DHS Brief summary of literature and gene function PRKCI rs112607182 1.00 1 1.00 Intergenic, downstream 1.9 – PRKCI encodes a serine/threonine protein kinase that plays a role in microtubule dynamics. Has been identi fi ed as an important factor for actin cytoskeletal regulation in podocytes (PMID: 24096077). Podocyte-speci fi c deletion of aPKClambda/iota in mice results in se vere proteinuria (PMID: 19279126). TGFB1 rs15052 1.00 3 0.75 3′ UTR (HNRNPUL1 ) 9.9 – TGFB1 encodes a transcription factor that controls proliferation, differentiation and other functions in many cell types. Has been implicated as a cause of fi brosis in most forms of experimental and human kidney disease (PMID 10793168). Numerous publications and animal models connect it to diabetic kidney disease, as well as numerous animal models. WIPF3 rs17158386 1.00 2 0.81 Intergenic 11.6 1*, 2*, 3* The protein encoded by WIPF3 is involved in the Cdc42/ N-WASP/Arp2/3 signaling pathway-mediated remodeling of the actin cytoskeleton (PMID: 11553796). PTH1R rs73065147 0.98 14 0.20 Intergenic 15.1 – PTH1R encodes for a receptor for parathyroid hormone, with high expression only in kidney cortex. The PTHrP/ PTH1R system appears to adversely affect the outcome of diabetic and other renal diseases (PMID: 16783882, 21052497). Rare mutations have been reported to cause multiple aut-rec (#215045, #600002), or aut-dom (#125350, #156400) chondrodysplasias or tooth eruption phenotypes. CYP2S1 rs15052 0.95 3 0.75 3′ UTR (HNRNPUL1 ) 9.9 – CYP2S1 encodes for a member of the cytochrome P450 enzyme family, which catalyze many reactions involved in drug and lipid metabolism. It is transcriptionally regulated by AHR, also identi fi ed in the present GWAS meta-analysis, in rats (PMID: 19883719). MUC1 rs34257409 0.89 25 0.10 Intergenic 3.1 1* MUC1 encodes for a membrane-bound member of the mucin family that play an essential role in forming protective mucous barriers on epithelial surfaces. Rare mutations cause medullary cystic kidney disease 1 (#174000), an autosomal-dominan t tubulo-intersti tial kidney disease. Patients show minimal to mild proteinuria in addition to decreased eGFR and renal cysts (PMID: 29217307). OAF rs12790943 0.97 7 0.47 Intergenic 1.8 1* The OAF gene encodes for a transcription factor of the basic helix –loop –helix family. Relatively little is known about its function in humans. SRD5A3 rs13132085 0.92 183 0.03 Intergenic 4.0 – The protein encoded by SRD5A3 gene is involved in the production of androgen 5-alpha-dihydrotesto sterone, and in the conversion of polyprenol into dolichol and thereby N-linked glycosylation of proteins (PMID: 20852264). Rare mutations cause autosomal-recessiv e disorders of glycosylation, type Iq ((#612379) or Kahrizi syndrome (#612713). CCDC157 rs11912350 0.88 85 0.05 Intron SF3A1 0.1 – Very little is known about the role of the CCDC157 gene, there are no speci fi c publications. Co-localization is observed with multiple other transcripts at this locus. PP posterior probability, DHS DN Ase I hypersensitivity site, SNP index SNP from the EA-spe ci fi c meta-ana lysis This table includes all genes with high posteri or pro bability (H4 ≥ 0.8) of co-localization of the U ACR assoc iation signal and gene expression in kidne y tissue s. 1*: ENCODE kidney , 2 * ENCODE epithelial, 3* Roadm ap kidne yloss of slit diaphragm proteins (Fig.
8
g, h; 3D reconstruction
Supplementary Fig. 9K). This implies that the polarity factor
aPKC is directly involved in slit diaphragm formation, consistent
with studies in murine podocytes
53. Staining patterns were
comparable when silencing oaf and aPKC using second RNAi
lines (Supplementary Fig. 9F–I). In summary, the Drosophila data
support a role of OAF in tubular protein endocytosis and PRKCI
in slit diaphragm formation.
Discussion
In this GWAS meta-analysis of UACR, we identified 68 loci in
total, the majority of which was associated with urinary albumin
concentrations and MA. Statistical
fine-mapping and
co-localization analyses with gene expression across 47 human
tis-sues and with plasma protein levels resolved GWAS loci into
novel driver genes and variants. This approach allowed for
translating two genes prioritized in our workflow, OAF and
PRKCI, into mechanistic insights in an in vivo experimental
model of proteinuria. Genome-wide genetic correlation analyses
and a phenome-wide association study of a genetic risk score for
UACR in a large independent population highlighted a common
genetic component or co-regulation with traits and diseases with
renal, hepatic, or endothelial components. Together, these results
represent a comprehensive resource for translational research
into albuminuria.
Until recently, GWAS of UACR in mostly population-based
studies only identified and replicated two loci: CUBN
22,54and
HBB
24, detected through an earlier candidate gene study
33. In
addition to these two loci, we also identified the BCL2L11 locus,
reported in an earlier admixture mapping study
25, with the index
SNP mapping to the neighboring ACOXL gene. Our
fine-mapping workflow did not provide strong evidence for either
ACOXL or BCL2L11 as the likely causal gene. We did not identify
genome-wide significant signals at RAB38 and HS6ST1 among
persons with diabetes, which we reported in an earlier study at
suggestive significance
23. Potential reasons include differences in
quantification and statistical transformation of UACR, different
participating studies, and false-positive results in the initial
report. Twenty-eight of the 61 loci detected in EA individuals
12
a
b
c
d
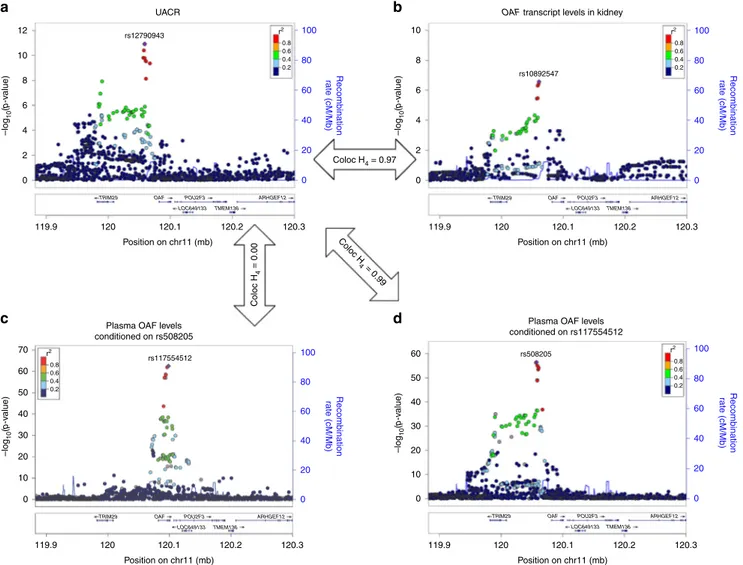
100 80 60 40 20 0 rs12790943 rs10892547 UACRPlasma OAF levels conditioned on rs508205
Plasma OAF levels conditioned on rs117554512
OAF transcript levels in kidney
rs117554512 rs508205 r2 0.8 10 8 6 4 2 0 119.9 120 120.1 120.2 120.3 0.6 0.4 0.2 10 –log 10 (p -v alue) –log 10 (p -v alue) –log 10 (p -v alue) –log 10 (p -v alue) Recombination rate (cM/Mb) 100 80 60 40 20 0 Recombination rate (cM/Mb) 100 80 60 40 20 0 Recombination rate (cM/Mb) 100 80 60 40 20 0 Recombination rate (cM/Mb) 8 6 4 2
TRIM29 OAF POU2F3
POU2F3 ARHGEF12 TRIM29 OAF POU2F3 ARHGEF12
TMEM136 LOC649133 OAF TRIM29 LOC649133 TMEM136 OAF POU2F3 TRIM29 LOC649133 TMEM136 ARHGEF12 ARHGEF12 TMEM136 LOC649133 120.2 120.3 Coloc H4 = 0.97 Coloc H 4 = 0.99 Coloc H 4 = 0.00 120.1 Position on chr11 (mb) Position on chr11 (mb) 120 119.9 119.9 120 120.1 120.2 120.3 120.2 120.3 120.1 Position on chr11 (mb) Position on chr11 (mb) 120 119.9 0 70 60 50 40 30 20 10 0 60 50 40 30 20 10 0 r2 0.8 0.6 0.4 0.2 r2 0.8 0.6 0.4 0.2 r2 0.8 0.6 0.4 0.2
Fig. 7 Co-localization of association signals of theOAF locus. Regional association plots of the OAF locus in the European ancestry urinary albumin-to-creatinine ratio (UACR) GWAS (a), withOAF gene-expression levels in healthy kidney tissue sections (b), and with OAF plasma levels (c, d). The dots are colored according to their correlationr² with the index SNP estimated based on the 1000 Genomes EUR reference samples (gray for missing data). This locus has two independent pQTLs for OAF levels, where panelc shows the association between the index pQTL at the locus (rs117554512) conditioned on its secondary signal (indexed by rs508205), and paneld shows the association with a conditionally independent SNP (rs508205,r2< 0.01 in 1000 Genomes EUR). The secondary signal rs508205 has strong evidence of co-localization with the UACR association signal (posterior probability H4= 0.99,
Methods), while the signal rs117554512 has not (posterior probability H4= 0). There was strong evidence of co-localization between the UACR association
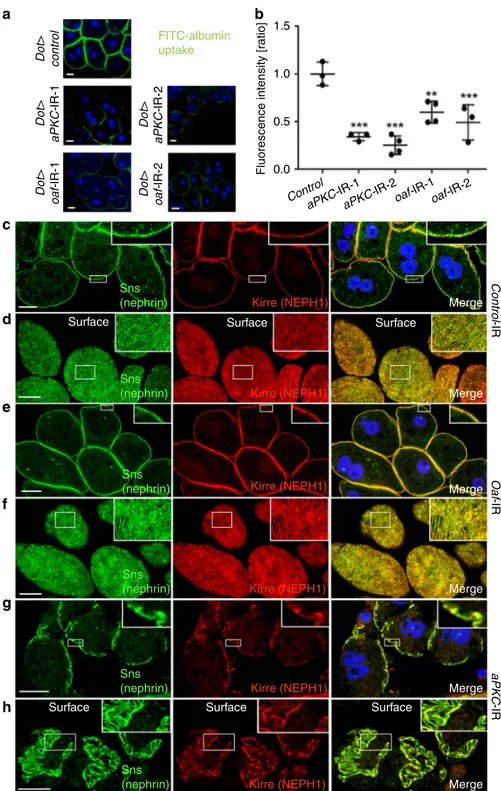
FITC-albumin uptake Dot> control Dot> aPKC-IR-1 Dot> aPKC-IR-2 Dot> oaf-IR-2 Dot> oaf-IR-1 1.5 Fluorescence intensity [r atio] 1.0 0.5 0.0 Control aPKC-IR-1 aPKC-IR-2
oaf-IR-1oaf-IR-2
a
b
c
d
e
f
g
h
Control -IR Oaf -IR aPKC -IR Sns (nephrin) Sns (nephrin) Sns (nephrin) Sns (nephrin) Sns (nephrin) Sns (nephrin)Surface Surface Surface
Surface Surface Surface Merge Merge Merge Merge Merge Merge Kirre (NEPH1) Kirre (NEPH1) Kirre (NEPH1) Kirre (NEPH1) Kirre (NEPH1) Kirre (NEPH1)
Fig. 8 In vivo results ofDrosophila orthologs. The Drosophila orthologs of OAF and PRKCI (aPKC) are both required for nephrocyte function and aPKC-RNAi affects slit diaphragm formation.a Garland cell nephrocytes were exposed to FITC-albumin. Nephrocytes expressing control RNAi exhibit intense endocytosis, while expression of RNAi directed againstoaf and aPKC (ortholog of PRKCI) decreases tracer uptake. b Quantitation of fluorescence intensity from FITC-albumin uptake is shown for the indicated genotypes. Values are presented as mean ± standard deviation of the ratio to a control experiment. Statistical significance was calculated using ANOVA and Dunnett’s post hoc analysis. A statistically significant difference (defined as p < 0.05) is observed foroaf-RNAi-1 (N = 4), oaf-RNAi-2 (N = 3), aPKC-RNAi-1 (N = 3), and aPKC-RNAi-2 (N = 4), where ** indicate p < 0.01 and ***p < 0.001. c Staining the slit diaphragm proteins Sns (ortholog of nephrin) and Kirre (ortholog of NEPH1) in control nephrocytes shows regular formation of slit diaphragms. Airyscan technology partially allows for distinguishing individual slit diaphragms (insets).d Tangential sections through the surface of control nephrocytes reveals the regularfingerprint-like pattern of slit diaphragm proteins. e, f Expression of oaf-RNAi-1 does not entail an overt phenotype, suggesting reduced nephrocyte function may be a consequence of impaired protein reabsorption while slit diaphragm formation is not affected.g, h Expression ofaPKC-RNAi-1 results in a clustered and irregular pattern of slit diaphragm proteins (insets ing) and a complete loss of slit diaphragm protein distinct areas on the cell surface. This suggests the loss of nephrocyte function is a consequence of impaired slit diaphragm formation. All scale bars represent 10µm
were also reported in the recent Mendelian Randomization study
of albuminuria
27, which is not surprising given the inclusion of
UKBB data in our meta-analysis. Still, our study identifies 32
additional loci for UACR in the overall sample, as well as four
among people with diabetes. Moreover, results allow for
prior-itization of loci with respect to their association with urinary
albumin, whereas previous studies have not evaluated whether
UACR-associated loci were driven by associations with urinary
albumin, creatinine, or both.
Previous GWAS of albuminuria have not resolved associated
loci into underlying genes and variants. Our workflow identified
co-localization of UACR-associations with differential gene
expression of PRKCI, TGFB1, WIPF3, PTH1R, CYP2S1, and
MUC1 in glomerular kidney portions and OAF, SRD5A3, and
CCDC157 in tubulointerstitial tissue. Some of these genes already
have established roles in the function of the glomerular
filter in
diabetic (TGFB1)
55,56and monogenic kidney disease (MUC1)
49,
while others such as OAF or WIPF3 represent novel candidates
or, as for PRKCI, have not yet been implicated in humans
53. Our
combination of human and Drosophila studies support a role of
PRKCI in glomerular
filtration function and of OAF in tubular
protein reabsorption, where reduced endocytosis upon gene
silencing reflects the human allele associated with higher UACR
and lower OAF expression and plasma levels. The lack of a
phenotype upon silencing of the WIPF3 ortholog may reflect the
unclear state of orthology, a lack of evolutionary conservation, or
potentially an insufficient knockdown.
Several insights from our study are of clinical interest. First, the
clinical relevance of genes detected in our screen, CUBN and
COL4A4, is underscored by a respective monogenic disease
fea-turing albuminuria and kidney disease, Imerslund-Grasbeck
(MIM 261100) and Alport syndrome (MIM 203780). Second,
the identification of NR3C2, encoding an essential component of
the RAAS, links this pathway to both albuminuria and adverse
clinical outcomes. Pharmacological inhibition of the RAAS has
been shown to be associated with reduced risk of end-stage
kid-ney disease
12and cardiovascular events
10,13–15, suggesting that
genetic studies of UACR in large human populations may identify
pathways amenable to pharmacological intervention that reduce
both albuminuria and CVD risk. Third, the genome-wide genetic
correlations of UACR and the UACR GRS associations may point
toward diseases with a common genetic basis or to co-regulation
of disease-relevant cell types. The latter could be reflected in the
role of the liver in lipid metabolism and albumin production, the
role of the kidney in urate metabolism and albumin excretion,
and the role of the endothelium in hypertension and glomerular
filtration. A potential role of the endothelium and the vasculature
is further corroborated by the significantly enriched pathway
“abnormal placental labyrinth vasculature morphology” and
many other nominally enriched pathways related to angiogenesis,
as well as the identification of the VEGFA (Vascular Endothelial
Growth Factor A; LINC01512) locus, an important growth factor
for vascular endothelial cell migration and proliferation.
Inter-estingly, a recent Mendelian Randomization analysis of UACR
and blood pressure supported a causal relationship between the
two, but reported that SNPs in CUBN and CYP1A1 were only
associated with UACR and not blood pressure. We
find that the
index SNPs in CUBN and CYP1A1 are related to UACR via
tubular albumin reabsorption and an association with urinary
creatinine but not albumin, respectively. This may indicate that
the increased
filtration of albumin in the glomerulus, potentially
as a result of endothelial damage, and not albuminuria per se may
link albuminuria to hypertension and increased CVD risk.
Fourth, albuminuria is a hallmark of diabetic kidney disease and
associated with unfavorable outcomes. Understanding pathways
underlying albuminuria in diabetes may therefore be of particular
relevance, and the four novel diabetes-specific loci identified in
our study may represent a
first step into this direction. Lastly,
translation of GWAS loci into differential plasma protein levels as
observed for OAF is of particular interest, as plasma protein levels
represent both potential biomarkers and interventional targets.
Strengths of our study include its standardized approach to
phenotype definition, its large samples size, internal locus
vali-dation, and the study of participants with diabetes. The
identifi-cation of a previous Amerindian-specific locus
25in our
trans-ethnic analysis underscores the value of studying diverse
ances-tries, but EA individuals are still strongly overrepresented, which
limits the power to detect heterogeneity correlated with ancestry.
Limitations that are not specific to our study are related to the
accurate quantification of UACR, which is influenced by biologic
variation of urinary albumin, by the sensitivity and variation of
albumin assays, and by standardization to urinary creatinine to
account for urine dilution
23. We addressed these issues by
har-monizing UACR calculation across cohorts, and by separate
assessment of associations with urinary albumin and creatinine.
Across-cohort variation was overcome to some degree by the use
of a central lab in the large UKBB, but may also introduce
findings related to UKBB-specific sample handling, storage,
measurement, or exposures. The statistical
fine-mapping focused
on SNPs available in the majority of studies, which might have
limited the discovery of novel associations or the
fine-mapping of
population-specific or low-frequency variants. Such analyses
represent avenues for future research. Other
fine-mapping
methods such as Bayesian approaches that incorporate priors
based on variant annotation exist, but ultimately all statistically
prioritized variants need to be experimentally validated.
In summary, we identified and characterized 68 loci associated
with UACR and highlight potential causal genes, driver variants,
target tissues, and pathways. These
findings will inform
experi-mental studies and advance the understanding of albuminuria
and correlated traits, an essential step for the development of
novel
therapies
to
reduce
the
burden
of
CKD
and
potentially CVD.
Methods
We set up a collaborative meta-analysis based on a distributive data model. An analysis plan was developed and circulated to all participating studies via a Wiki system [https://ckdgen.eurac.edu/mediawiki/index.php/
CKDGen_Round_4_EPACTS_analysis_plan]. Phenotypes were generated and quality checks performed within each study in a standardized manner through scripts provided to all study centers. Before conducting the analyses, studies uploaded automatically generated PDF and textfiles. After approval of the phe-notype quality, ancestry-specific GWAS were performed in each study and uploaded centrally. Files were quality controlled using GWAtoolbox57and custo-mized scripts, harmonized, and meta-analyzed. Details regarding each step are provided below. Each study was approved by the respective ethics committee, and all participants provided written informed consent. Drosophila research was car-ried out in compliance with all relevant ethical regulations. Drosophila experiments are exempt from a specific regulatory approval.
Phenotype definition. Methods for the measurement of urinary albumin and creatinine in each study are reported in Supplementary Data 1. Urinary albumin values below the detection limit of the used assays were set to the lower limit of detection, and the UACR was assessed in mg/g and calculated as urinary albumin (mg/l)/urinary creatinine (mg/dl) × 100. MA cases were defined as UACR > 30, and controls as UACR < 10 mg/g, no other exclusions were applied. These steps were all included in the distributed phenotyping script. MA GWAS analyses were limited to studies with≥100 MA cases.
GWAS in individual studies. In each study, genotyping was performed using genome-wide arrays followed by application of study-specific quality filters prior to phasing and imputation. Genome-wide data were imputed to the Haplotype Reference Consortium (HRC) version 1.1, 1000 Genomes Project (1000G) phase 3 v5 ALL, or the 1000G phase 1 v3 ALL reference panels using the Sanger [https:// imputation.sanger.ac.uk/] and Michigan Imputation Server [https://