Faculty of technology and Society Computer Engineering
Bachelor Thesis
Using BLE mesh network for indoor
tracking
Anv¨andning av BLE mesh n¨atverk f¨or inomhussp˚arning
by
Ali Hassan Anna Ahlquist
Exam: Bachelor of Science in Engineering Subject Area: Computer Engineering Date of final seminar: 28-05-2019 Supervisor: Yuji Dong
Abstract
The Internet of Things brings connectivity of people, services, sensors and other devices enabling a wide range of applications like smart home, smart transport, elder care and much more. The latest innovation of Bluetooth SIG is the Bluetooth mesh topology that allows us to connect wireless devices in a many-to-many relationship. To investigate the potential benefit that the BLE mesh network has to offer for the indoor tracking system. In this thesis we developed an indoor tracking system based on Bluetooth Low Energy technology and mesh topology. The system is developed to track Bluetooth beacon in an indoor office environment. Received Signal Strength is used to calculate distance to the beacon, while the position of the beacon is calculated using Extended Min-Max and Trilateration algorithms. Calculations are performed on server. The results are analyzed through comparison of Root Mean Square Error of both algorithms. In this thesis, indoor tracking is evaluated as part of an assignment given by u-blox.
Sammanfattning
Internet of Things ger m¨anniskor m¨ojligheter att genom tj¨anster dra nytta av sensorer och andra enheter som tillsammans skapar ett brett utbud av l¨osningar som smart hem, smart transport, ¨aldreomsorg och mycket mer. Den senaste innovationen av Bluetooth SIG ¨ar Bluetooth mesh topologi som till˚ater att ansluta tr˚adl¨osa enheter i ett m˚anga till m˚anga f¨orh˚allanden. F¨or att unders¨oka de potentiella f¨ordelar som Bluetooth Low Energy n¨atverk har att erbjuda f¨or inomhussp˚arningssystemet.
I denna avhandling utvecklade vi ett inomhussp˚arningssystem baserat p˚a Bluetooth Low Energy teknik och mesh topologi. Systemet ¨ar utvecklat f¨or att sp˚ara Bluetooth beacon i en inomhus kontorsmilj¨o. Received Signal Strength anv¨ands f¨or att ber¨akna avst˚andet till beacon, medan positionen av beacon ber¨aknas med Extended Min-Max och Trilater-ation algoritmer. Ber¨akningar utf¨ors p˚a servern. Resultaten analyseras genom j¨amf¨orelse av Root Mean Square Error av b˚ada algoritmerna. I denna avhandling utv¨arderas in-omhussp˚arning som en del av ett uppdrag som ges av u-blox.
Acknowledgements
Firstly, we would like to thank u-blox for giving us the opportunity to carry out this thesis. We would like to thank Mats Anderson and Per-Olof H˚akansson for all the help during the thesis. We would also thank our supervisor Yuji Dong and Magnus Krampell for their advice and feedback during the thesis work.
Contents
1 Introduction . . . 1 1.1 Background . . . 1 1.2 Motivation . . . 2 1.3 Research questions . . . 2 1.4 Limitations . . . 2 2 Theoretical Background . . . 42.1 Bluetooth Low Energy . . . 4
2.1.1 Bluetooth LE protocol stack . . . 4
2.1.2 Generic Access Profile (GAP) . . . 5
2.1.3 Attribute Protocol (ATT) and Generic Attribute Profile (GATT) . . . 6
2.2 Bluetooth Mesh . . . 6
2.3 Received Signal Strength (RSS) . . . 7
2.4 Discrete Kalman Filter . . . 8
2.5 Trilateration . . . 8
2.6 Bluetooth Localization Services . . . 8
2.6.1 Real-Time Location Systems (RTLS) . . . 9
2.6.2 Indoor Positioning Systems (IPS) . . . 10
2.7 Hardware . . . 10
3 Related work . . . 11
3.1 The Smart Doorbell: A proof-of-concept Implementation of a Blue-tooth Mesh Network . . . 11
3.2 Smart indoor positioning using BLE technology . . . 11
3.3 A Bluetooth Low Energy Indoor Positioning System with Channel Diversity, Weighted Trilateration and Kalman Filtering . . . 12
4 Method . . . 14
4.1 Method Description . . . 14
4.1.1 Construct a conceptual framework . . . 14
4.1.2 Develop a system architecture . . . 15
4.1.3 Analyze and design the system . . . 15
4.1.4 Build the system (prototype) . . . 15
4.1.5 Observe and Evaluate the System . . . 15
5 Results . . . 16
5.1 Construct a conceptual framework . . . 16
5.1.1 Problem tree . . . 16
5.1.2 Literature study . . . 17
5.1.3 Indoor Positioning System (BLE) . . . 17
5.1.4 Positioning algorithms . . . 17
5.2.1 Beacon Device . . . 20
5.2.2 Node Device . . . 20
5.2.3 Gateway Device . . . 20
5.2.4 Server Device . . . 20
5.3 Analyze and design the system . . . 21
5.3.1 Requirements Specification . . . 21
5.3.2 System Design . . . 21
5.4 Build the system (prototype) . . . 22
5.4.1 Beacon implementation . . . 22
5.4.2 Node implementation . . . 22
5.4.3 Gateway implementation . . . 22
5.4.4 Server implementation . . . 23
5.5 Observe and Evaluate the System . . . 24
5.5.1 RSSI Filtering . . . 24
5.5.2 First test scenario in office environment . . . 25
5.5.3 Results of the first test scenario . . . 25
5.5.4 Second test scenario in office environment . . . 28
5.5.5 Results of the second test scenario . . . 29
5.5.6 Different cases of circles arrangements . . . 31
5.5.7 Comparison of Trilateration and Extended Min-Max algo-rithms . . . 32
5.5.8 Calculation time of algorithms . . . 33
6 Analysis and Discussion . . . 34
6.1 RSSI Filtering . . . 34
6.2 Analysis of result . . . 35
7 Conclusion . . . 37
7.1 Further Work . . . 37
1
Introduction
This section gives the reader an introduction to the background of the thesis, motivation of the work and the problem statement along with research questions, limitations and requirements specifications.
1.1
Background
Phones, tablets and PCs have become portals, which help people experience the surround-ing world and Bluetooth can be found on each of them. Billions of Bluetooth devices are shipping every year, and these devices accommodate us in our everyday needs. Bluetooth is a radio technology that aims to address specific connectivity needs. Recent advance-ments in the technology give Bluetooth opportunity to grow beyond consumer-facing applications into new environments, such as smart buildings, smart industry and smart cities [1].
Bluetooth technology has been in the business of connecting things for a long time, starting with pairing phones and headsets for audio and data streaming. More recently, Bluetooth Low Energy has been developed, aimed to provide high data transfer speed but at the same time considerably reduce power consumption while maintaining appropriate commu-nication range. Bluetooth Low Energy is a base commucommu-nication technology for different topologies, point-to-point (1:1) that enables data transfer, broadcast (1:M) that enables local services and mesh (M:M) that supports device networks. The connection capability of these topologies has become even more powerful with new Bluetooth 5, which delivers higher speed, bigger capacity for data transfer, longer range and less power consumption [2].
The latest innovation of Bluetooth SIG is the Bluetooth mesh topology that changes how people interact with the environment. The Bluetooth mesh allows us to connect wireless devices in a many-to-many relationship. Every device can receive and broad-cast messages and can relay them further to other devices that are not in direct radio range of the originating device. This functionality makes it possible to create large-scale device networks, such as control systems, monitoring systems and automation systems. Smartphones cannot be part of a mesh network yet, but they can communicate with the network and link it to the internet [3].
The stakeholder of this thesis is u-blox AB in Malm¨o. u-blox is an international company that provide positioning and wireless communication technologies for the automotive, in-dustrial and consumer markets. Their products are used to develop solutions for IoT, like wearables, health care, smart cities, smart home and buildings. One type of product is modules that provide short-range wireless communication using Bluetooth, Wi-Fi, and NFC technologies. The latest series of short-range modules is NINA [4], it has Bluetooth 5 and Bluetooth mesh onboard. NINA module can be used together with different sensors or devices to create a mesh network. u-blox is interested if such a network can be used to track mobile devices(assets) that are not part of the mesh network.
1.2
Motivation
The Internet of Things brings connectivity of people, services, sensors and other devices enabling a wide range of applications like smart home and buildings, smart transport, el-der care and much more. With the introduction of Bluetooth mesh, Bluetooth technology surely will become a big part of IoT. Since many IoT systems involve many small devices and sensors that need to send short bursts of data, Bluetooth LE is a suitable protocol as it provides hassle-free and easy setup [1].
With the growth of the IoT domain and expansion of Bluetooth mesh, there will be more networks of connected devices with a many-to-many topology. These networks create an opportunity to implement functions like position tracking.
1.3
Research questions
Bluetooth mesh networking has many applications such as control, monitoring and au-tomation. Assume an existing Bluetooth mesh network of nodes with a known, fixed, position, e.g. the lights in an office lighting system and mobile devices like smartphones moving around. Mobile devices that are not part of the network are Bluetooth beacons sending messages at regular intervals and devices that are part of the mesh network are picking up the messages. Depending on the layout of the network, several fixed devices can pick up the message from the same beacon.
The purpose of this thesis is to make a prototype of a tracking system and investigate if it can be used to track stationary assets within a building. The investigation shall propose a system architecture for such a system and identify the risks and limitations.
• RQ1: Which algorithm should be used to calculate position based on RSSI mea-surements in this project?
• RQ2: How does the amount and placement of the nodes impact the system? • RQ3: What accuracy can be achieved in a mesh-based tracking system? How can
the accuracy be improved?
1.4
Limitations
EVK-NINA-B3 evaluation kits were provided by u-blox to build the prototype of the tracking system. The module build in the EVK is a NINA-B3 series standalone Blue-tooth 5 low energy module.
NINA-B3 modules have a built-in Arm Cortex-M4. When considering Time of Flight the signal travels 20 meters in one processor tick, this makes it impossible to detect dis-tances lower than 20 meters.
NINA-B3 modules have a built-in internal PIFA antenna that does not support Angle of Arrival.
Based on the previous points this thesis will be limited to use Bluetooth technology as a communication technology and RSSI measurements to calculate the distance between
receiver and transmitter devices.
For this thesis, we assume the node devices are stationary and their positions are known and stored in a database(text file in this project). The work in this thesis only considers two-dimension localization. The height above ground is not considered when determining the position of a target object.
The server is implemented using Node-red programming tool and Java-script program-ming language.
2
Theoretical Background
This section introduces the basic concepts of the wireless standard known as Bluetooth Low Energy, explaining how data is organized and what its key limitations are. We also introduce and explain elementary concepts fundamental to BLE, such as protocol stack, broadcasting, and the different roles that devices can assume. This section also presents other relevant concepts like RSSI and positioning algorithms that you are likely to encounter in this thesis.
2.1
Bluetooth Low Energy
Bluetooth Specification (4.0 and above) defines Bluetooth Low Energy as a low-power wireless standard used to send small packets of data like temperature and heart rate. BLE operates in the unlicensed 2.4 GHz ISM (Industrial, Scientific, and Medical) band. The frequency band is divided into 40 physical channels, separated by 2 MHz guard band. Three channels (37, 38, and 39) are used as primary advertising channels, and 37 remain-ings are used as secondary advertising channels and as data channels. BLE employs a frequency hopping transceiver to combat interference and fading. The mandatory symbol rate is 1 Mb/s, which is referred to as the LE 1M PHY. It can optionally support error correction coding, called LE Coded PHY which can use one of two coding schemes: S=2, where 2 symbols represent 1 bit, therefore, supporting a bit rate of 500 kb/s, and S=8, where 8 symbols represent 1 bit, therefore, supporting a bit rate of 125 kb/s. LE Coded PHY provides up to 4 times more range in exchange for lower data rate. An optional data rate of 2 Mb/s is supported, which is referred to as the LE 2M PHY. The LE 2M PHY has a lower range than LE 1M PHY, both supports uncoded data only and can be referred to as the LE Uncoded PHYs [5].
The primary design goal of Bluetooth Low Energy is to optimize energy consumption. This brings forward key limitations that are defined in the Bluetooth 4.0 specification and later.
• Data throughput
The data throughput of BLE devices is limited by the physical radio layer (PHY) and differs depending on the Bluetooth version used. The specification provides the theoretical upper limit of throughput. In the real world, the throughput is typically lowered by a variety of factors like bidirectional traffic, protocol overhead, CPU, radio limitations and many other.
• Operating range
As well as data throughput the actual range of a BLE device depends on different factors like output power of the transmitter, sensitivity of the receiver, operating environment, antenna design and device orientation. That is why the range specified in the BLE specification can be less in practice.
2.1.1 Bluetooth LE protocol stack
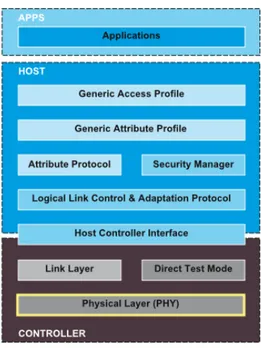
BLE protocol stack is divided into the layers that implement the different packet for-mats, routing, multiplexing, encoding, and decoding that allow data to be sent effectively between devices. The protocol stack in a single-mode BLE device is divided into three
parts: controller, host, and application, each split into several layers that provide the functionality required for a device to operate. The host can communicate with the con-troller through the Host Concon-troller Interface (HCI) [6].
Figure 1: Bluetooth Low Energy protocol stack
2.1.2 Generic Access Profile (GAP)
The Generic Access Profile (GAP) provides a framework that every BLE implementation must follow to interoperate with each other. It determines how devices discover each other, broadcast data, establish secure connections, and perform other operations in a standard, predefined manner. GAP chapter in the core specification defines the following different aspects of device interaction:
• Roles (Broadcaster, Observer, Central, Peripheral)
• Modes (Broadcast, Non-discoverable, Limited discoverable and more) • Procedures (Observation, Limited discovery, General discovery and more) • Security modes and procedures
• Additional data formats
Each BLE device can operate in one or more roles at a time. To perform a GAP proce-dure, a BLE device needs to be in a specific mode and role.
The broadcast mode and the observation procedure create the framework through which a device can send(broadcast) data to one or more listening devices (observers). A broad-caster broadcasts data without any confirmation or acknowledgement, and an observer listens for potential broadcasts [6].
There are now two sets of advertising channels: primary and secondary. The primary ad-vertising channels are the original adad-vertising channels 37, 38, and 39, while the secondary are the rest 37 channels previously used for data transfer. The new added extended ad-vertising PDUs are broadcast only events. Bluetooth 5 allows packets to be up to 255 bytes long. Header data, including a new field called AuxPtr, is transmitted on the pri-mary channels in the context of Bluetooth 5 advertising. The AuxPtr field includes the channel number that the payload will be transmitted on so that receivers know where to find it. The payload is sent to one of the secondary channels allowing larger packets in connection-less scenarios [7].
2.1.3 Attribute Protocol (ATT) and Generic Attribute Profile (GATT) The Attribute Protocol (ATT) protocol is pure client-server: client takes the initiative, server answers. Each Bluetooth LE device is a client, a server, or both. An ATT server stores the attributes, while an ATT client stores nothing and uses the ATT protocol to read and write values on server attributes. Each server contains data organized in the form of attributes that are composed of three elements:
• 16-bit handle that is an identifier used to access an attribute value
• UUID (universally unique identifier) which defines type and nature of the data contained in the value
• value that contains data
The Generic Attribute Profile (GATT) builds on the Attribute Protocol (ATT) and use it as a transport protocol to exchange data between devices. GATT deals only with actual data transfer procedures and formats, how a unit of data is formatted, packed, and sent. GATT maintains the same client-server architecture present in ATT and defines how ATT attributes are grouped into meaningful services. A collection of Services is called a profile. There are some predefined profiles like Heart Rate Profile (HRP) that combines the Heart Rate Service and the Device Information Service. Each service has many characteristics that store useful values for the services and permissions. GATT roles(client, server) are independent of GAP roles (central, peripheral) and are compatible with each other [6].
2.2
Bluetooth Mesh
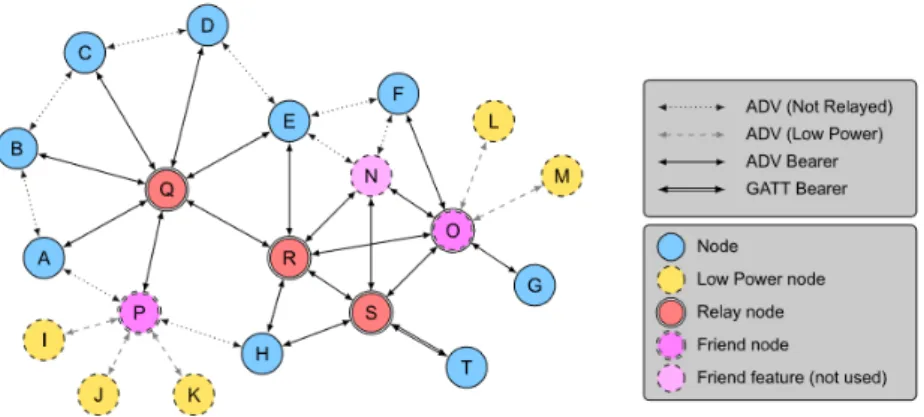
Bluetooth mesh architecture stack builds on full Bluetooth LE stack. It is required to provide fundamental wireless communications capabilities for the mesh. A mesh network is a many-to-many topology (see figure 2), where all devices can communicate with each other. The communication between devices is achieved through messages, that can be relayed further to other devices. This way the end-to-end communication range is not limited to the radio range of one device and can cover bigger distances.
Devices which are part of a mesh network are called nodes and those who are not are called “unprovisioned devices”. All nodes can transmit and receive mesh messages in the network, but they are not limited to this functionality. There are several optional features with special capabilities which a node may have implemented. Those optional features are Relay, Proxy, Friend, and the Low Power (see figure 2). Mesh node can support zero or more of these optional features, and supported feature may be enabled or disabled.
Figure 2: Bluetooth mesh network (figure source: Bluetooth SIG)
For a device to become a part of the network, it must first go through the provisioning process. The device used for provisioning is called a Provisioner. The provisioning process consists of several steps to generate different security keys. One of which is network key also called NetKey. Devices that possess a NetKey are members of the corresponding network and can communicate with each node in the network. Every node in the network must possess at least one NetKey.
Communication in the mesh network is accomplished through messages. There are many different message types, and every type has one unique opcode. Every message has a sender address and a receiver address. There are three types of addresses defined by the Bluetooth mesh:
• Unicast address uniquely identifies a single element.
• Group address is a multicast address which represents one or more elements. • Virtual address can be assigned to one or more elements, on the same or different
nodes.
The act of sending a message is known as publishing. Messages are usually addressed to the group or virtual addresses. Nodes process only messages sent to them, and this is known as subscribing [3].
2.3
Received Signal Strength (RSS)
RSS is used to measure the strength of the radio signal. RSS is widely used on wireless communications to estimate the distance between two devices. For example, to measure the distance between the BLE transmitter and the BLE receiver. RSSI is a relative mea-surement that is mostly defined by chip manufacturers [8].
When the RSSI is measured and transmitted power is know it is possible to calculate the distance between transmitter and receiver. There are three propagation models, Log-Distance Path Loss model, International Telecommunication Union model and empirical model[15]. The difference between them are complexity and the strength of characteriza-tion. The empirical model represented by equation (1) is less complex than other models
and do not have strong characterization.
RSSImeasured= 10nlog(d) + A (1)
Here n is the path loss exponent, d is the distance between transmitter and receiver, A is RSSI measured with 1 meter distance between transmitter and receiver in Line-of-Sight.
2.4
Discrete Kalman Filter
The RSSI value is dependent on the distance between the transmitter and the receiver. However, the RSSI value is strongly influenced by the environment. Consequently, RSSI values have high levels of noise caused by multi-path reflection. Signals reflect against objects in the environment. To address the noise problem and to improve the positioning accuracy, a standard Kalman filter is applied to filter RSSI measurements. The Kalman filter algorithm is implemented similar to [9] and includes two phases as following: Prediction phase: x(t − 1) = Ax(t) + Bu(t) (2) P (t − 1) = P (t) + Q (3) Update phase: K(t) = P (t − 1) P (t − 1) + R (4) x(t) = x(t − 1) + K ∗ (z(t) − x(t − 1)) (5) P (t) = (1 − K(t)) ∗ P (t − 1) (6)
where x(t-1) corresponds to initial state of t-1, Bu(t) corresponds input controll of the system, P(t-1) corresponds to the system error covariance, K(t) is a Kalman gain, Q is state noise, R is the measurement noise covariance.
2.5
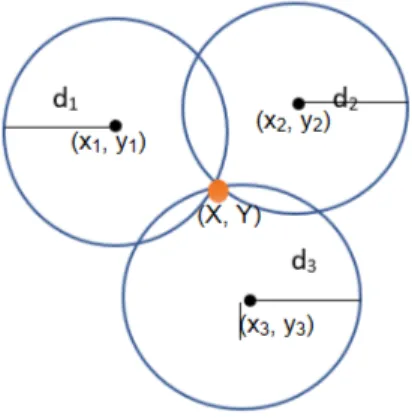
Trilateration
Trilateration is a method used to calculate the intersection of three fixed reference points. Assuming that the distance between the intersection and the reference points is known. On this thesis, the nodes correspond to reference points and the BLE beacon is assumed to be at the intersection. The distance between the reference points and the intersection is estimated by RSSI.
2.6
Bluetooth Localization Services
Several technologies are used to provide indoor positioning such as IEEE 802.11, Blue-tooth, Zigbee, RFID and Ultra-Wideband (UWB). These technologies enable tracking of people and assets within a building based on different techniques such as RSSI. The introduction of Bluetooth low energy in 2010 allowed developers to create low-cost real-time location systems (RTLS) and indoor positioning systems (IPS) [10] to address new market opportunities.
Figure 3: Triletaration
2.6.1 Real-Time Location Systems (RTLS)
Bluetooth RTLS is used to track people and assets. For example, Bluetooth RTLS can be used to track the position of the oscilloscope or employee at a company. The RTLS solution is based on the deployment of BLE nodes in fixed locations. Nodes are connected to a centralized server, and a low power Bluetooth transmitters, often called tags, are attached to all assets that the system tracks. BLE nodes receives information from tags and relays it to the server for monitoring purpose. The information is then used to estimate the position of Bluetooth tags using Trilateration. The accuracy of position estimation depends on several factors, such as the deployment of BLE nodes and the design of the building [10].
2.6.2 Indoor Positioning Systems (IPS)
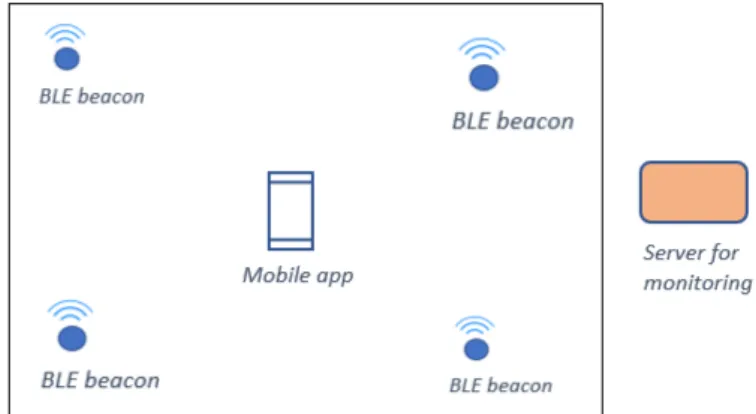
Indoor position systems (IPS) is often used as a wayfinding solution for visitors at airports, shopping malls and the like. Bluetooth IPS are often BLE beacon devices attached to fixed locations, which broadcasts advertising messages (AD) instead of receiving and retransmitting messages. The visitors enable Bluetooth radio on the phone so that the BLE beacons can detect it. Application on the phone can determine its position based on received information from the BLE beacon using the Trilateration. Information consists of BLE beacon position along with the received signal strength (RSS).
Figure 5: IPS based on RSSI and triletartion
2.7
Hardware
EVK-NINA-B3 series are stand-alone Bluetooth low energy modules and is built on the Nordic nRF52832 SoC with Bluetooth low energy v5.0 radio, Bluetooth mesh, Arm R
Cortex -M4 with FPU processor and NFC tag. These modules have low power con-R
3
Related work
This section summarizes some articles written by researchers in an area of Bluetooth tech-nology and indoor positioning techtech-nology. Articles describe experimentation performed in the area of Bluetooth mesh network and how Bluetooth mesh features can be utilized to track people and objects in a smart building.
3.1
The Smart Doorbell: A proof-of-concept Implementation
of a Bluetooth Mesh Network
Mart´ınez et al. [12] implemented a proof-of-concept mesh network into their office build-ing. The authors of the article developed a simple mesh network containing nodes with different roles and provisioned them to serve as a simple building doorbell notification system. Client nodes with a button were located at the doors of the building acting as the doorbell. Client nodes generated a message whenever a visitor pressed the button. The message was then sent to the relay nodes within the radio range. Relay nodes re-ceived and re-transmitted the message to the server node. Server node was connected to the Internet through an Arduino card. he message was sent through the Internet to every employee on the network. The BMD-300 [13] module was used as the node for the entire mesh network. To program the nodes they used application SoftDevice developed by Nordic Semiconductor.
The result showed that the size and the internal layout of the building was an essen-tial factor in designing a mesh network inside the building. Moreover, the result showed that the package loss increased when distance exceeded 10 meters and the latency was 300 ms for packets that travelled a distance of 10 meters.
This paper gives a reasonable explanation about the recently released Bluetooth net-work topology, namely Bluetooth Mesh, and describes some relevant terminologies. This paper also makes an excellent contribution knowledge about some Bluetooth devices that support mesh concept and also gives a good idea of how to build a simple mesh network.
3.2
Smart indoor positioning using BLE technology
Indoor positioning system (IPS) is a system that can be used to locate people or ob-jects inside a building using different technologies [14]. Bluetooth Low Energy (BLE) offers features such as low cost and energy efficiency. BLE beacon broadcasts informa-tion which includes Universal Unique Identifier (UUID) and Received Signal Strength Indicator (RSSI) [14]. BLE beacon is a Bluetooth device used to send an advertising message with different intervals and based on the information mentioned above Memon et al. [14] designed a system which estimates the location of a staff member of the de-partment of telecommunication engineering, Mehran University of Engineering and Tech-nology Jamshoro, Pakistan.
The article describes that BLE beacons were placed at the doors to laboratories in a department and the RSSI values were measured regarding different obstacles. An android application was developed with functionality to scann for all available BLE beacons and collect RSSI values. The application would then choose a beacon with highest RSSI value
and then, beacons number along with the user’s name would be sent to a server in order to monitor that user’s position. To improve the accuracy of the system the laborato-ries were divided into small blocks, while standing within each block, 25 beacon readings were taken. With 1000 ms advertising interval, the result showed 96% accuracy of the estimated user location, and 100% accurate with 500ms advertising interval.
3.3
A Bluetooth Low Energy Indoor Positioning System with
Channel Diversity, Weighted Trilateration and
Kalman Filtering
The article [15] is about the development of an Indoor Positioning System that can track both people and assets using BLE technology and RSSI. Still, there are many challenges to this system in indoor environments, mainly in terms of unstable RSSI due to multi-path effect, but also the propagation of the signal. The authors started by evaluating three factors that are important for an IPS: the arrangement of the transmitter/receiver devices, the analysis of RSSI and choice of technology. After the evaluation, they pro-posed an IPS that uses SensorTag devices as transmitter and Raspberry Pi as a receiver and a BLE technology. In this implementation, the transmitter is the one sending BLE beacons while the receiver scan for BLE beacons and the computer server is in charge of processing and calculations. To make the system be a low cost and with high accuracy in any environment authors suggest a solution that implements channel diversity, weighted trilateration and Kalman filtering.
In the second section, the authors presented different related works with similar tech-niques and compared those with their proposal. First was the Fingerprinting approach compared to Non-Fingerprinting approach. The comparison makes it clear that even so the Fingerprinting gives a better result, it requires much offline work, a significant amount of measurements taken, which also must be updated if the environment changes. Another critical information here is a table that shows a comparison of some studies discussed in the section. It compares scenarios, the number of beacons, achieved precision and tech-nology, methodology or algorithm used. These tables give a good overview of what can be expected from different approaches. The main goal of the implemented system is to track the position of a device in different indoor environments. The system consists of one or more beacons that send advertisements and at least three receivers that scan for advertisements, with three sniffers each. The sniffers are used to make it possible to listen for three advertisement channels 37, 38 and 39 at the same time, as BLE transmits on every one of three channels. The server is used to calculate the estimated position using distance values received from transmitters.
To improve the performance channel diversity is used in three different ways: choose the channel that provides the most significant RSSI value, calculate the mean of all the channels and weighted calculation where the channel with biggest RSSI have a more sig-nificant weight in the calculation. When the RSSI is calculated, it is used to calculate the corresponding distance. There are three different propagation models used to calculate distance: Log-Distance Path Loss, International Telecommunication Union and Empiri-cal model. The next step is to use trilateration to Empiri-calculate the estimated position using distances from receivers to the sender. However, the mathematical trilateration cannot be used most of the time because of RSSI values are not ideal, and it is impossible to
get a single intersection point of three circles. The circles can be grouped in different ways: circles intersect in an area, two circles intersect in an area, but the third one is separated, circles do not intersect. The approach for this problem is to use weighted trilateration, where the receiver with the smallest distance to the sender is the one to be trusted more than others. At last, the second order Kalman filtering is used to improve estimated position by smoothing results of weighted trilateration. The system was tested in three different scenarios: Indoors medium sized room environment, laboratory room and conference room. The tests were performed in a realistic situation, in the presence of people, with other 2.4 GHz signals around and different directions of the sender device. The results show that there is not one ideal propagation model that would work best in every scenario, but every scene has one or more propagation model that are giving good results. The authors stated that their approach improves the estimation error compared to other approaches. For example, in the laboratory, the error was below 1.82 m during 90% of the time, but in the conference room, the error was up to 4.6 m 90% of the time. The error is much more in the conference room because of the distance between receivers. The accuracy of RSSI measurement gets worse as the distance between transmitter and receiver increases 5 meters. The articles provide us with a deeper understanding of how IPS are built, function, and what complications can be expected. We get to know about different solutions to problems get essential information on a different aspect of our work. There are also many related works mentioned, that can be useful.
4
Method
This section presents the research method used to solve the research problem stated in section 1.3. The result of the research method is a prototype that is used to investigate and answer questions stated in section 1.3.
4.1
Method Description
The method chosen for this thesis is a system development method proposed by Nuna-maker et al. [16]. The main reason for choosing this method is because of its systematical development approach suitable for building a prototype. As shown in figure 6 The method has an iteration ability and works well even when not all the project requirements are known in detail ahead of time. So, the prototype can be reworked after it has been built and tested.
Figure 6: Five stages of system development process described by Nunamaker and Chen [16]
4.1.1 Construct a conceptual framework
This is the first step in the research process that consists of several parts. First part is to define the problem and research questions, as done in section 1.3, to better understand the aim of the project. Next part is to investigate the system requirements mentioned in section 5.3, to define the process of testing and understand what functionality the prototype requires. The last part is to study the area of research to gain theoretical background knowledge. The results of research are presented in section 2 and 5.1.
4.1.2 Develop a system architecture
This step is about developing a system architecture that gives insight into system buildup, defining the components of the system and describing their functionalities. Requirements specifications (see 5.3) are defined based on the components of the system and what functionality each component should have in order to evaluate the entire system.
4.1.3 Analyze and design the system
This step involves analysis of the system architecture and its components and specifying how they should be implemented. Study how different components of the system work and create UML diagrams in order to simplify the analyze of different parts of the system. The result is presented in section 5.3
4.1.4 Build the system (prototype)
The development of prototype of the system accordingly to the design proposed in the previous step. The process involves writing the code for different parts of the system that carries out different system functions. The prototype of the system consists of a small Bluetooth low energy mesh network to demonstrate the functionality and usability of the system. The tests are performed to study if the system responds to all requirements mentioned in section 5.3.
4.1.5 Observe and Evaluate the System
The tests are performed on each part of the system to ensure the system’s performance. Several test cases are performed to evaluate if the system satisfies the functional require-ments specifications stated in the research phase and the result is analyzed based on the system requirements defined in section 5.3.
5
Results
In this section, we present the results achieved during the thesis work following the method steps in chapter 4.
5.1
Construct a conceptual framework
5.1.1 Problem tree
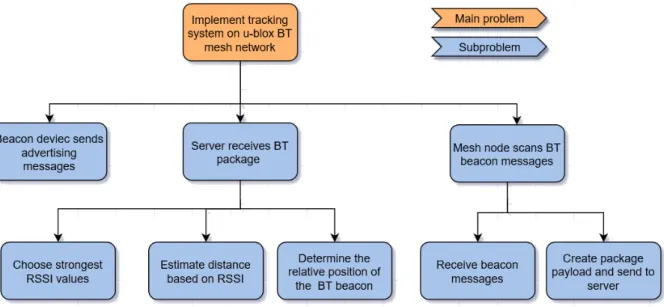
Figure 7: Dividing the problem into sub-problems
The problem tree was designed to get a better overview of the system. This way, it is easier to determine problems to be solved to make a prototype. The prototype is a track-ing system based on Bluetooth mesh technology and RSSI measurements. The tracktrack-ing system consists of a Beacon device(transmitter), Node device(receiver) and Server de-vice(computer).
The Beacon device broadcasts advertising messages, notifying listening devices about its presence. The Node devices listen for broadcasted advertising messages and collect them for processing. After the message is processed, the information from the message is sent to the Server device through the mesh network. The Server device is a computer and can not be a part of the mesh network. Thus there is a need for a medium between the computer and a mesh network. The medium is a Node device with special features, and we call it a Gateway device. The Gateway device listens for mesh messages, and when such a message is received, the Gateway sent it to the Server device. The Server device process received messages, choose the strongest RSSI values, calculate distance based on RSSI and calculate the position of the Beacon device.
5.1.2 Literature study
A preliminary literature study that was carried out to gain knowledge about different problems presented in the problem tree (see figure 7). The result of the literature study is discussed further in the sections 5.1.3, 5.1.4, 5.1.5.
5.1.3 Indoor Positioning System (BLE)
Implementation of a Bluetooth-based Indoor Positioning Systems face some challenges in indoor environments [15], as it is a non-line of sight environment. The signal propagation might be affected by different factors:
• Multipath and fading caused by reflection and diffraction around objects, walls, furniture and floors within the room.
• Transmission loss that is caused by obstacles like walls and floors. • Persons moving in the room.
• Other signals on the same frequency.
Reflecting on the challenges mentioned above, it is important to take into consideration the arrangement of the transmitters and receivers in an indoor environment. It would be beneficial to have the arrangement with fewer obstacles in a signals way.
The RSSI can be used for localization in two ways: to calculate distance using radio propagation loss model or by fingerprinting technique. The Fingerprinting method in-volves mapping taken RSSI measurements to different positions. This approach provides greater accuracy, but requires a big amount of pre-work and is vulnerable to any change in the environment. Measured RSSI together with a propagation loss model can be used to calculate the distance between the sender and the receiver.
Reflecting on the information mentioned above, we decided to use a Non-Fingerprinting approach, even if the accuracy of the system will be worse than with Fingerprint approach. The main reason is that the system should be scalable and the Fingerprinting requires extra work whenever a node is added to the network.
5.1.4 Positioning algorithms
The calculation of the Beacon position is done on the Server. The Server is a computer which has a powerful processor and can execute complex localization algorithms very fast. This way, we gain the advantage of its high processing power. One drawback is a risk of the high traffic that can overload the system. To eliminate this risk, a controller can be implemented on the Node device, that if the measured RSSI is higher than specified, the Node should not send information further to Server.
There are a few different algorithms that can be used to calculate the position based on the distance: Min-Max and Trilateration.
Min-Max algorithm
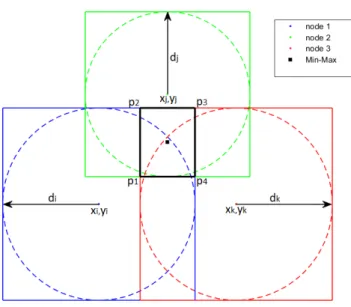
Figure 8: Min-max algorithm.
The Min-Max algorithm [17] represented by equations (7), (8), (9), (10) is a simple local-ization algorithm that builds a square around each Node, as shown in Fig.8. Each side of the square is two times the measured distance di, dj, dk, between the Beacon and Node. The intersections of these squares are used to determine an intersection region where the position of the Beacon will be estimated. The intersection region has four vertices p1, p2, p3 and p4. The position of the Beacon is estimated by calculating the middle point of the intersection region. Even in a scenario where there is no intersection region between squares, Min-Max localization algorithm can calculate a coarse position of the Beacon. Min-max algorithm can produce high localization error even if the distance measure-ments errors are small. However, it can be improved by adding a weight to each vertex of the definition zone. The weighted Min-Max does not locate the position of the Beacon at the centre of the definition zone, it locates the position of the Beacon anywhere inside the defined zone with respect to weights of the vertices. Weights are calculated using equation (11). P1 = [max(xi− di), max(yi− di)] (7) P2 = [max(xi− di), min(yi+ di)] (8) P3 = [min(xi− di), min(yi+ di)] (9) P4 = [max(xi+ di), min(yi− di)] (10) W4(j) = 1 n P i=1 |D2 i,j− di2| (11)
Trilateration algorithm
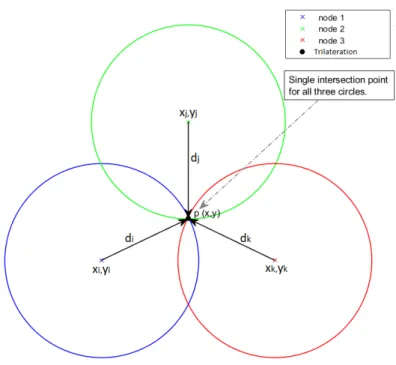
Figure 9: Trilateration algorithm.
Trilateration algorithm [20] is a simple localization algorithm that uses distances between a point and three known locations to calculate the position of the point. In case of Indoor Positioning System, it calculates Beacon location at an intersection point of three circles. Circles are formed using Node position as the center and the distance between Node and Beacon as the radius.
The classic Trilateration algorithm is a system of linear equations:
x2+ y2+ a1x + b1y + c1 = 0 (12)
x2+ y2+ a2x + b2y + c2 = 0 (13)
x2+ y2+ a3x + b3y + c3 = 0 (14)
where ai = −2xi, bi = −2yi and ci = x2i + yi2− ri2.
Solving a system of linear equation we get:
x = (c3− c2)(b1− b3) − (c3− c1)(b2− b3) (a2 − a3)(b1− b3) − (a1− a3)(b2− b3) (15) y = (a2− a2)(c3− c1) − (c3− c2)(a1− a3) (a2− a3)(b1− b3) − (a1− a3)(b2− b3) (16) Using equations (15) and (16) we can calculate position of the beacon. It is worth to mention that the distance calculated using RSSI measurements is not very accurate and the three circles may not intersect at a single point. Circles can be grouped in many different ways, where the classic Trilateration algorithm can produce high localization error. This makes the implementation of Trilateration algorithm a challenging problem. There are many different scenarios and every one of them needs an optimized algorithm that solves a specific problem.
5.2
Develop a system architecture
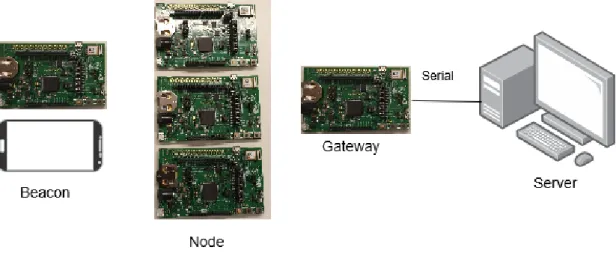
In this section are described different parts of the system and their functionality. The system consists of four parts, beacon device, node device, gateway device and server device. Figure 10 shows different parts of the system and the role of each device.
Figure 10: System overview
5.2.1 Beacon Device
The beacon unit is EVK-NINA-B3, which broadcasts Bluetooth advertising packages. Beacon device is not a member of the Bluetooth mesh network. It only broadcasts adver-tising packages at regular intervals and shows its presence.
5.2.2 Node Device
The node device is EVK-NINA-B3, which receives and transmits messages through the Bluetooth mesh networks. The node device is a member of the Bluetooth mesh network and scans all Bluetooth beacons, checks if the beacon ID meets the conditions for the beacon ID. When the beacon ID is checked, the node device measures RSSI and then filters the RSSI using the Kalman filter, creates the mesh payload and publishes the package through the Bluetooth mesh network. Figure 10 illustrates the node device functionality.
5.2.3 Gateway Device
The Gateway device is also EVK-NINA-B3, which subscribes to all Bluetooth mesh pack-ages that are published to a particular address. The Gateway device is a member of the Bluetooth mesh network and receives all incoming events from the Bluetooth mesh network and transmits to the server device. The server and gateway devices communicate trough a serial connection.
5.2.4 Server Device
The server device is a computer that we use to monitor the system. The Server receives packets from the Gateway in two seconds, then the Server sorts all the packages based on which node has the maximum RSSI value. After the packages are sorted, the Server retrieves the position of the three nodes that have the maximum RSSI value. Then the
Server calculates the distance between each node and the beacon based on the filtered RSSI values. When the distance is calculated, the Server unit calculates the estimated position of the beacon based on Trilateration algorithms.
5.3
Analyze and design the system
This section describes components of the system, the relationship between them and analyses their functionalities.
5.3.1 Requirements Specification
The system consists of a BLE beacon device, BLE mesh nodes and a server.
• The moving device (BLE beacon) should be able to send advertising messages at regular intervals.
• The fixed devices (BLE mesh nodes) should be able to pick up advertising messages and transmit the messages through the BLE mesh network to the Server.
• The Server should be able to estimate the position of the moving devices and present visually where the tracked devices are positioned.
5.3.2 System Design
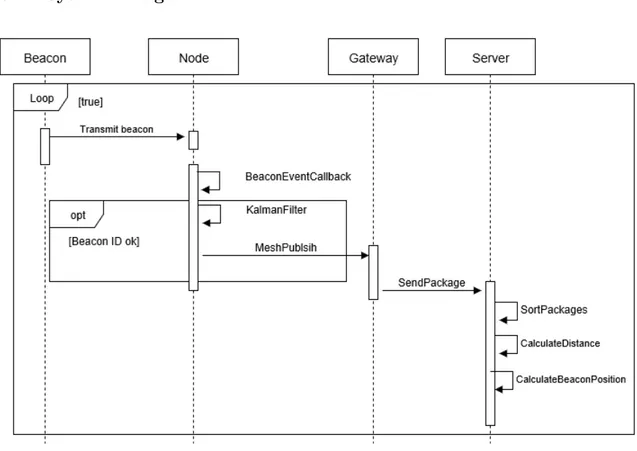
Figure 11: Sequence diagram for the system
As the sequence diagram in figur 11 shows, the beacon device transmitting advertising packages at regular intervals. The callback function is called whenever the beacon event happens. The node device communicate with all other nodes in the system through the Bluetooth mesh network and relays packages to a particular address. The gateway
device subscribes to that address and forwards all incoming messages to the Server via serial communication. Bluetooth mesh packages contain the local address of which node has sent the package, RSSI, beacon ID and transmission power. Server sorts nodes and chooses those with best RSSI values to calculates the distance between the node and the beacon. Three distances is than used and calculate beacons position.
5.4
Build the system (prototype)
This section describes the process of building the prototype of the system described in section 5.2. From the start, it was decided that the prototype would be based on BLE Mesh. Every part of the prototype was tested to determine that the functionality meets the requirements specified in section 5.3.
5.4.1 Beacon implementation
Beacon device is implemented using an Android smartphone and Nordic Semiconductor application called Beacon Simulator, that we downloaded from the google play store and installed on a smartphone.
The application has two features Simulator and Scanner. The Simulator feature is used to simulate a Beacon and EddystoneUID as the type of Beacon. The EddystoneUID have a two fields Namespace ID and Instance ID, these specify what information is send inside broadcasted advertising message. We use Instance ID and Namespace ID to specify which Beacon is sending the message. Information consists of 16 bytes coded as hexadecimal values.
5.4.2 Node implementation
Node device is implemented using a NINA-B3 module and Visual Studio Code develop-ment environdevelop-ment. The logic is written using Java-Script programming language and an u-blox extension. The underlying C code is provided by u-blox developers.
A node must go through provisioning and configuration to become a part of the mesh network. It must have a NetKey, publish address, ID and role to be able to send mesh messages and to relay mesh messages. The provisioning and configuration is done with AT-commands using s-center tool developed by u-blox.
When a Node receives a beacon advertising message, an event CallBack() function is called. The function provides data: 16 bytes long UID retrieved from message payload and measured RSSI value. The UID is used to determine if the discovered Beacon is the one we look for. If it is the case, the Nodes ID, Beacons ID and RSSI are sent to Server through the mesh network.
5.4.3 Gateway implementation
The gateway device is a special Node that functions as a link between the mesh network and the computer. It does not scan for beacon advertising messages as it is already fully loaded with forwarding mesh messages.
The Gateway must go through provisioning and configuration to become a part of the mesh network. It must have a NetKey, subscription address, ID and role to be able to receive mesh messages and to forward them through a serial connection. The provisioning and configuration are done with AT-commands using s-center tool developed by u-blox.
5.4.4 Server implementation
Server device is implemented using a computer and Red programming tool. Node-Red is installed on the computer and to be used as the Server. The computer is connected to a Gateway device through a serial port, to be able to communicate with the mesh net-work. Server logic is written in JavaScript, and it is used to process the information that comes through the serial port.
Positions of all the Nodes are stored in the text file. The text file is read when the Node-Red starts. When data comes through the serial port, the RSSI value and Node ID is retrieved from the payload and stored in the array, this process is repeated for every incoming data message for 2 seconds time period. The array is then sorted based on RSSI and three different Nodes with best RSSI values are chosen for positioning. The distance between each of three Nodes and Beacon is calculated using empirical radio signal prop-agation model.
When all information, three distances and Nodes position i available, the position of the Beacon can be calculated. The information is processed by two algorithms, Extended Min-Max and trilateration separately, this provides two estimations of the position that are shown in Node-Red GUI. In case of trilateration algorithm the process of calculating the position consist of two steps. The first step is to determine what case it is, what kind of relationship the circles have to each other. The second step is to use the positioning algorithm suited for that case.
In every test, the three distances and Nodes position is stored in the text file. It is then used in Matlab for visualization purpose.
5.5
Observe and Evaluate the System
5.5.1 RSSI Filtering
Table 1: Comparison of RSSI measurements
Type Distance Minimum Maximum Standard Deviation ∆d (m)
Unfiltered RSSI 1 m -62 dBm -53 dBm 1.6 0.82 Kalman filtered 1 m -60 dBm -59 dBm 0.5 0.11 Unfiltered RSSI 3 m -71 dBm -56 dBm 3.9 2.5 Kalman filtered 3 m -67 dBm -61 dBm 1.3 0.97 Unfiltered RSSI 5 m -84 dBm -62 dBm 4.9 09.50 Kalman filtered 5 m -75 dBm -66 dBm 2.1 2.70
Kalman filter is applied to system to reduce the noise. The Kalman filter is implemented using equations described in section 2.4. The system has no input control so Bu(x) is set to 0, Process noise is a constant and set to Q = 0.001, Measurement noise covariance is a constant and set to R = 1, initial state estimate x(t-1) is set 0 and initial state error is set to 0.
Table 1 shows the comparison between Kalman filtered RSSI and unfiltered RSSI. The beacon is located at 1 meter, 3 meters and 5 meters away from the node. Tested is made between a node and a beacon. The table shows difference distance ∆d using equation (17), environment constant n = 2.5 and one meter RSSI A0 = −58 dBm. For example
RSSI1 = -62 dBm and RSSI2 = -53 dBm, d1 = 1.45, d2 = 0.63 which gives at ∆d = d1
- d2 = 0.82 m.
5.5.2 First test scenario in office environment
Figure 12: Layout of the first test scenario.
Scenario in figure 12 shows the environment for two sets of tests with unfiltered RSSI and filtered RSSI, each set consists of four tests. Beacon was placed at four different locations, one at a time and at least 20 measurements were taken. The room has obstacles like furniture, computers, table panels and also Wi-Fi signals. Nodes were placed 0.5-1.5 meters above ground, antennas orientation were upwards.
5.5.3 Results of the first test scenario
Figure 13: The result of trilateration using filtered RSSI and unfiltered RSSI when beacon was placed at location (1, 3).
Figure 13 shows the result of the first test. Beacon was placed at position (1, 3) and 20 measurements were taken and plotted in Matlab. The plot on the left side shows the result of trilateration with unfiltered RSSI was most of the time the error is more than 1 meter. The plot on the left side shows the result of trilateration with filtered RSSI all the estimated positions have less than 1 meter error. We consider the result in the right
plot to show better accuracy than the one on the left. In this test, the LOS was between Node 1 and the beacon, Node 2 and the beacon and there were obstacles between the rest of the nodes and the beacon.
Figure 14: The result of trilateration using filtered RSSI and unfiltered RSSI when beacon was placed at location (3, 5).
Figure 14 shows the result of the second test. Beacon was placed at position (3, 5) and 20 measurements were taken and plotted in Matlab. The plot on the left side shows the result of trilateration with unfiltered RSSI were most of the time the error is more than 1 meter. The plot on the left side shows the result of trilateration with filtered RSSI where most of the estimated positions has less than 1 meter error. We consider the result in the right plot to show better accuracy than the one on the left. In this test the LOS was between Node 1 and the beacon, Node 2 and the beacon and there were obstacles between the rest of the nodes and the beacon.
Figure 15: The result of trilateration using filtered RSSI and unfiltered RSSI when beacon was placed at location (4, 3).
20 measurements were taken and plotted in Matlab. The plot on the left side shows the result of trilateration with unfiltered RSSI was the estimated position is widely spread out with the error varying from less than 1 meter to more than 2 meters. The plot on the left side shows the result of trilateration with filtered RSSI where most of the estimated positions have 2 meter error. Filtering made the estimated position more stable but the error was still large. In this test, the LOS was between only Node 1 and the beacon, and there were obstacles between the rest of the nodes and the beacon.
Figure 16: The result of trilateration using filtered RSSI and unfiltered RSSI when beacon was placed at location (2.5, 1.6).
Figure 16 shows the result of the second test. Beacon was placed at position (2.5, 1.6) and 20 measurements were taken and plotted in Matlab. The plot on the left side shows the result of trilateration with unfiltered RSSI was the estimated position is widely spread out with the error varying from less than 1 meter to more than 2 meters. The plot on the left side shows the result of trilateration with filtered RSSI where most of the estimated positions have 2 meter error. Filtering made the estimated position more stable but the error was still large. In this test, there were obstacles between all of the nodes and the beacon.
5.5.4 Second test scenario in office environment
Figure 17: Layout of a space used in second test scenario.
Scenario in figure 17 shows the environment for two sets of tests. In the first set, a beacon was placed at five different locations, one at a time and at least 20 measurements were taken. In the second set, all doors were locked and the beacon was placed at two different locations, one at a time and at least 20 measurements were taken. Nodes were placed 1-1.7 meters above ground, antennas orientation were towards the centre of the room nodes were placed in. Every room has obstacles like furniture, computers, table panels and also Wi-Fi signals.
5.5.5 Results of the second test scenario
Figure 18: The result of trilateration using filtered RSSI. Beacon at locations (3, 8.5) and (11, 8).
Figure 18 shows the result of the second test scenario when the beacon was placed at locations (3, 8.5) and (11, 8). Test measurements were plotted in Matlab. In the plot on the left there was LOS between the beacon and the node. In the plot on the right there were two nodes in the room but there were no LOS between the beacon and the nodes.
Figure 19: The result of trilateration using filtered RSSI. Beacon at locations (2, 4.2) and (9.2, 3).
Figure 19 shows the result of the second test scenario when the beacon was placed at locations (2, 4.2) and (9.2, 3). Test measurements were plotted in Matlab. In the plot on the left there was LOS between the beacon and the node. In the plot on the left there was LOS between the beacon and Node 2 and NLOS between the beacon and Node 6. In the plot on the right there was LOS between Node 5, Node 4 and the beacon.
Figure 20: The result of trilateration in a NLOS environment using filtered RSSI. Beacon is at locations (5, 6) and (5, 10).
Figure 20 shows the result of the second set of tests where the beacon was placed at locations (5, 6) and (5, 10) in a hallway. Test measurements were plotted in Matlab. Both plots shows result of distance estimation in NLOS environment.
5.5.6 Different cases of circles arrangements
Figure 21: Different cases of circles arrangements.
While analyzing the results, we came across different possible cases of circles arrangement shown in figure 21. On the left side of the picture are cases that can be handled by some approach or algorithm, while on the right side are cases that can not be handled by any approach or algorithm.
5.5.7 Comparison of Trilateration and Extended Min-Max algorithms
Table 2: RMSE Comparison of Trilateration and Extended Min-Max
Real position Trilateration RMSE E-Min-Max RMSE Best performance
(5, 6) 1.6208 1.0745 E-Min-Max (5, 10) 2.2321 2.0447 E-Min-Max (3, 8.5) 0.3422 0.5682 Trilateration (11, 8) 2.3003 2.0553 E-Min-Max (2, 4.2) 0.8333 0.7958 E-Min-Max (3, 6) 2.7239 2.9852 Trilateration (9.2, 3) 0.1717 0.4053 Trilateration (4, 3) 1.8067 1.2530 E-Min-Max (2.5, 1.6) 1.5892 1.8104 Trilateration (1, 3) 0.5150 0.5146 E-Min-Max (3, 5) 0.7107 0.3891 E-Min-Max
To get a better understanding of accuracy we used previously collected test-results to calculate Root Mean Square Error. Table 2 shows the result of the comparison between two positioning algorithms, Trilateration and Extended Min-Max. RMSE was calculated using equation (18). RM SE = v u u t 1 N N X i=1 (xi− xc)2+ (yi− yc)2 (18)
5.5.8 Calculation time of algorithms
Figure 22: Calculation time in milliseconds.
Figure 22 shows an example of how long it takes for the server to calculate location after data is received. Extended Min-Max is most of the time faster than Trilateration, but it is worth to mention that E-Min-Max is a simple algorithm while Trilateration uses recursion in some cases to calculate position. The longest time in this set of tests is 10 milliseconds and the lowest is less than 1 millisecond. Amount of nodes does not impact the calculation time, but the server will not do any calculation if there are less than three nodes that detect a beacon. Because both E-Min-Max and Trilateration implemented uses data from three nodes to calculate location.
6
Analysis and Discussion
6.1
RSSI Filtering
The result presented in table 1 in section 5.5.1 shows that the RSSI measurements are unstable and noisy. Unfiltered RSSI at 1 meter takes the values between -62 dBm and -53 dBm and with distance difference ∆d = 0.81 meter. This means that the environment is very noisy which makes difficult to use RSSI to estimate the beacon position. The figure 23 shows unfiltered RSSI samples at a 1 meter distance within 60 seconds.
Figure 23: Unfiltered RSSI at 1 m distance
The RSSI measurements at 1 meter distance using the Kalman filter takes values between -60 dBm and -59 dBm and with distance difference ∆d = 0.11 meter as shown in table 1 in section 5.5.1. The Kalman filter removes a lot of noise compared to unfiltered RSSI and reduces the distance estimation error which gives a much better position estimation. The figure 24 shows Kalman RSSI samples at 1 meter distance within 60 seconds.
The antenna of the Bluetooth device used in this thesis is very sensitive. Changing the antenna orientation can cause differences in RSSI measurements and even human interference can drop the RSSI values. Furniture and other devices running on the same frequency can affect RSSI. All tests are made with the presence of all these obstacles. The conclusion is that the use of RSSI for distance estimation is unreliable which makes difficult to get good localization accuracy.
6.2
Analysis of result
The aim of this thesis was to develop a prototype of a tracking system based on Blue-tooth Low Energy technology, mesh topology and RSSI measurements. The RSSI is least truth-worthy measurements that can be used to calculate the distance between two BLE devices, because it is know to be noisy. The results provided in section 5.5 shows that overall filtered RSSI provides more stability and accuracy to the measurements than un-filtered RSSI. But even with filtering, it is challenging to make a good position estimation. Because the noise is still present even after filtering, what makes distance calculated based on RSSI not accurate. This distance is then used by algorithms to calculate location of the beacon, but the wrong distance leads to the wrong estimated location and gives rise to different cases of circle arrangement.
The results shows that LOS and NLOS have a big impact on the accuracy of the system. When there was LOS between two nodes and the beacon the estimated the position was very accurate with less than 1 meter error. When there was LOS between one node and the beacon, the error was less than 2 meters and when there was NLOS the error was varying from less than 1 meter up to 5 meters. Based on the previous information it is clear that orientation, location and number of nodes have an impact on the system. If the node is placed high on the wall with an antenna looking towards the centre of the room, the probability of having LOS between the node and the beacon become higher. If nodes are densely placed the probability of having LOS between two or more nodes and the beacon become higher.
In section 5.5.7 we compared the performance of Trilateration and Extended Min-Max algorithms by comparing RMSE. E-Min-Max provides better accuracy in seven cases and Trilateration in 4 cases. The biggest difference in accuracy where E-Min-Max performs better is around 0.5 meter. And the biggest difference in accuracy where Trilateration performs better is around 0.2 meter that is not very big but still have an impact on sys-tems performance. There are two way to achieve better accuracy of the system. One way is to fuse E-Min Max and Trilateration results, calculating avarage of both results. And the second way is to determine which cases are handled better by E-Min-Max and which are handled better by Trilateration and use only one of them at a time, based on the case. In this thesis we were limited to use RSS measurements to calculate the position of the beacon, but there are other techniques that can be used. Apart from RSS there are two widely used techniques for positioning, Angle of Arrival and Time of Flight.
Angle of Arrival technique requires complex hardware, special antennas that can detect angle of the incoming signal, while the calculation of the position involve simple geometry.
It is possible to calculate position with only two nodes. According to [18], the average error in a 6x3 meters room is around 0.14 meter. But it is unclear how NLOS impact the AoA.
Time of Flight technique is also complex because it is necessary to have synchronized time up to nanoseconds on both transmitter and receiver to make accurate calculation of the distance. This technique requires at least three nodes to calculate position using trilateration algorithm. According to [19], NLOS condition has big negative impact on accuracy of Time of Flight, while RSS does not suffer us much from NLOS.
For indoor environment with high NLOS factor the best approach is to fuse ToF and RSS for best result.
7
Conclusion
In section 1.3 we formulated problem and defined research questions for this thesis. Here we will answer the questions.
• RQ1: Which algorithm should be used to calculate position based on RSSI mea-surements in this project?
We tested both Trilateration and Extended Min-Max based on the data from the tests in scenarios one and two. It is hard to say which algorithm is better in terms of positioning accuracy. In some cases Extended Min-Max algorithm provides better accuracy then Trilateration and in some cases Trilateration provides better accuracy then Extended Min-Max. Best solution would be to use Extended Min-Max for the cases handled best by Extended Min-Max and Trilateration for cases handled best by Trilateration.
• RQ2: How does the amount and placement of the nodes impact the system? It is important to avoid situation of NLOS between node and beacon. A way to do this is to consider orientation and placement of the antenna. Antenna should have a good field of view, which is achieved by placing antenna high on the wall in a places where field of view is as clear from obstacles as possible. Having more nodes per room increase chances of clear LOS between a node and a beacon, but it also increases cost of the system. Accuracy of the calculated position increase if more nodes has LOS to the beacon. There are some unpredictable aspects like changes in the environment and people between a node and a beacon that can have negative impact on the system performance.
• RQ3: What accuracy can be achieved in a mesh-based tracking system? How can the accuracy be improved?
We used only RSS in our project to determine distance to the beacon and cal-culate position based on these distances. In NLOS tests, the error was less then 2 meters 70% of time. In all other tests, the error was less than 2 meters in 83% of time. The accuracy can be improved by adding Time of Flight to provide support to RSS when RSS is noisy, while RSS provide support to Time of Flight in NLOS situations.
7.1
Further Work
This thesis was evaluated indoor positioning based on the received signal strength and tri-lateration. There are other techniques that can be used for indoor positioning using BLE mesh network eg. Fingerprinting. For future work, it would be interesting to implement time synchronization and improve filtering so the system can track moving devices.
References
[1] Bluetooth SIG. The State of Bluetooth in 2018 and Beyond. https://blog.bluetooth.com/the-state-of-bluetooth-in-2018-and-beyond
[2] Bluetooth SIG. Go Faster. Go Further.
https://www.bluetooth.com/bluetooth-technology/bluetooth5/bluetooth5-paper?utm campaign=developer&utm source=internal&utm medium=blog&utm content=exploring-bluetooth-5-distance
[3] Bluetooth SIG. Bluetooth mesh networking. https://www.bluetooth.com/bluetooth-technology/topology-options/le-mesh/mesh-tech
[4] u-blox, NINA-short range radio chips. https://www.u-blox.com/en/short-range-radio-chips-and-modules
[5] Bluetooth SIG. Core Specifications.
https://www.bluetooth.com/specifications/bluetooth-core-specification
[6] Kevin Townsend, Carles Cuf´ı, Robert Davidson and Akiba, Getting Started with Bluetooth Low Energy. Published by O’Reilly Media, Inc., 2014. Cited on chapters 2, 3 and 4.
[7] Bluetooth SIG. Exploring Bluetooth 5 - What’s new in Advertising? https://blog.bluetooth.com/exploring-bluetooth5-whats-new-in-advertising
[8] Bluetooth SIG. Received Signal Strength. https://blog.bluetooth.com/proximity-and-rssi
[9] Kaibi Zhang, Yangchuan Zhang and Subo Wan, ”Research of RSSI indoor ranging algorithm based on Gaussian - Kalman linear filtering,” 2016 IEEE Advanced Infor-mation Management, Communicates, Electronic and AutoInfor-mation Control Conference (IMCEC), Xi’an, 2016, pp. 1628-1632. doi: 10.1109/IMCEC.2016.7867493
[10] Bluetooth SIG. Bluetooth location services. https://www.bluetooth.com/bluetooth-resources/paper-enhancing-bluetooth?utm
campaign=location-finding&utm source=homepage&utm medi um=featured-resource&utm content=ken-51-feature
[11] u-blox, NINA-B3 series Module for Bluetooth https://www.u-blox.com/en/product/evk-nina-b3
[12] C. Mart´ınez, L. Eras and F. Dom´ınguez, ”The Smart Doorbell: A proof-of-concept Implementation of a Bluetooth Mesh Network,” 2018 IEEE Third Ecuador Technical Chapters Meeting (ETCM), Cuenca, 2018, pp. 1-5. doi: 10.1109/ETCM.2018.8580325
[13] Rigado, BMD-300 Series Module for Bluetooth https://www.rigado.com/products/modules/bmd-300/
[14] S. Memon, M. M. Memon, F. K. Shaikh and S. Laghari, ”Smart indoor position-ing usposition-ing BLE technology,” 2017 4th IEEE International Conference on Engineer-ing Technologies and Applied Sciences (ICETAS), Salmabad, 2017, pp. 1-5. doi: 10.1109/ICETAS.2017.8277872
[15] Cant´on Paterna, Vicente et al. “A Bluetooth Low Energy Indoor Positioning Sys-tem with Channel Diversity, Weighted Trilateration and Kalman Filtering.” Sensors (Basel, Switzerland) vol. 17,12 2927. 16 Dec. 2017, doi:10.3390/s17122927
[16] Nunamaker, Jay F., et al. “Systems Development in Information Systems Research.” Journal of Management Information Systems, vol. 7, no. 3, 1990, pp. 89–106. JSTOR, www.jstor.org/stable/40397957.
[17] J. J. Robles, J. S. Pola and R. Lehnert, ”Extended Min-Max algorithm for position estimation in sensor networks,” 2012 9th Workshop on Positioning, Navigation and Communication, Dresden, 2012, pp. 47-52. doi: 10.1109/WPNC.2012.6268737 [18] S. Monfared, T. Nguyen, L. Petrillo, P. De Doncker and F. Horlin,
”Experi-mental Demonstration of BLE Transmitter Positioning Based on AOA Estima-tion,” 2018 IEEE 29th Annual International Symposium on Personal, Indoor and Mobile Radio Communications (PIMRC), Bologna, 2018, pp. 856-859. doi: 10.1109/PIMRC.2018.8580796
[19] A. Galov, A. Moschevikin and R. Voronov, ”Combination of RSS localization and ToF ranging for increasing positioning accuracy indoors,” 2011 11th International Conference on ITS Telecommunications, St. Petersburg, 2011, pp. 299-304. doi: 10.1109/ITST.2011.6060072
[20] S. Pradhan, S. Shin, G. Kwon, J. Pyun and S. Hwang, ”The advanced TOA tri-lateration algorithms with performance analysis,” 2016 50th Asilomar Conference on Signals, Systems and Computers, Pacific Grove, CA, 2016, pp. 923-928. doi: 10.1109/ACSSC.2016.7869184
[21] S. Hwang and S. Shin, ”Advanced TOA Trilateration Algorithm for Mobile Localiza-tion,” 2018 IEEE Asia-Pacific Conference on Antennas and Propagation (APCAP), Auckland, 2018, pp. 543-544. doi: 10.1109/APCAP.2018.8538295
[22] Li, J., Yue, X., Chen, J., & Deng, F. (2017). A novel robust trilateration method applied to ultra-wide bandwidth location systems. Sensors (Switzerland), 17(4) doi:10.3390/s17040795
[23] Basili, V. R. (. 1. )., et al. “Experimentation in Software Engineering.” IEEE Transactions on Software Engineering, vol. SE-12, no. 7, pp. 733–743. EBSCOhost, doi:10.1109/TSE.1986.6312975. Accessed 20 Mar. 2019.
[24] Bluetooth SIG. Radio Versions. https://www.bluetooth.com/bluetooth-technology/radio-versions
![Figure 6: Five stages of system development process described by Nunamaker and Chen [16]](https://thumb-eu.123doks.com/thumbv2/5dokorg/4084783.85562/20.892.328.510.434.850/figure-stages-development-process-described-nunamaker-chen.webp)