INVESTIGATION OF THE ENERGY
SAVING POTENTIAL FOR AN OFFICE
BUILDING COMPLEX
A study on the viability of an on-site combined heat- and power supply system
DOUGLAS ERIKSSON
School of Business, Society and Engineering
Course: Degree project Course code: ERA403 Credits: 30 ECTS
Program: Master of Science in Engineering –
Energy systems
Supervisors: Erik Dahlquist, Maher Azaza Examinor: Xin Zhao
Customer: Castellum Date: 2018-06-15 Email:
ABSTRACT
The building stock in the European Union accounts for over 40% of final energy use, where the usage of non-residential buildings may be up to 40% higher than the residential sector. Improving building energy efficiency across all categories of buildings is one key goal of the European energy policies, made prominent by the Climate and Energy package, Energy Performance of Building Directive (EPBD) and Energy Efficiency Directive (EED). In this study, a simulation model of an office-building complex utilizing district heating was created using transient simulation software TRNSYS. The model was validated using consumption data provided by the facility owner, after which an investigation of the energy saving
potential along with the economic viability of adapting a new heat- and power supply system was conducted. The system designs were comprised of a geothermal energy system in
combination with a PV-system and electricity storage. It was concluded that the systems were sufficient in maintaining an adequate indoor climate. Furthermore, the investments were ascertained as profitable and resulted in a decreased building specific energy demand.
PREFACE
The ambition of the study has been to create a model that may serve as a tool for similar investigations further on, whilst simultaneously providing a framework for decision making at Castellum in their pursuit of ever increasing energy-efficient buildings. Finally, due to an interest in building energy systems it has been a valuable learning experience and hopefully something that will be of aid in the future line of work.
I would like to thank my supervisors Maher Azaza and Erik Dahlquist for the support throughout this degree project where their knowledge and ideas have been of great assistance.
I must also express my gratitude to Alexander Sandberg who has supplied reference material that have aided in the model construction. Finally, to my dear friend and fellow classmate Philip Lind, without whom this work wouldn’t have been what it is today.
Västerås in June, 2018
SUMMARY
A rapid growth in world population coupled with enhancements of building services and increased comfort levels have significantly raised building energy use. At present the building stock in both the U.S and the European Union accounts for over 40% of final energy usage. Considering non-residential buildings the consumption is on average 40% higher than the residential building sector, mainly due to increased utilization of building services as well as occupancy density and behaviour. This in turn enables significant energy savings with the adaption of energy efficiency measures and operational strategies. These are as well key goals of the European energy policies, where recently legislated directives are becoming ever more stringent.
The purpose of this work has been to develop a simulation model of an office-building complex located in Västerås, Sweden and to investigate the energy saving potential along with the economic viability of adapting a renewable, integrated heat- and power supply system. Specifically, the study aimed at investigating how such an integrated system would have to be designed to comply with thermal requirements and building energy certifications. Furthermore, to evaluate the effectiveness and profitability of an electricity storage system and corresponding impact on the building specific energy demand.
A 3D-model of the building complex was created using Trnsys3D in accordance with blueprints and reference material. A reference simulation model was then constructed in TRNSYS to validate the building component with respect to measurements provided by the facility owner. Having achieved sufficient accuracy a geothermal energy system coupled with 1) a standalone PV-system and 2) a combined PV-system and battery storage was constructed in accordance with suggestions and guidelines acquired via a literature review.
Results reveal that the designed systems were successful in maintaining a healthy indoor climate along with satisfying building energy certifications. The profitability of the technical installations was evaluated using the NPV-method, where the GSHP in combination with the standalone PV-system amounted to a NPV of approximately 1,1 MSEK compared to utilizing a district heating system and the electricity grid for household electricity consumption. The NPV was shown to increase even further when applying a battery for electricity storage. The largest battery capacity included in the analysis was 38,4 kWh which yielded an increased self-consumption of PV-generated electricity by roughly 20 percentage units. Similarly, the system design with the lowest building specific energy demand was the PV-system in
combination with the battery of 38,4 kWh. The overall conclusion was that the combination of geothermal energy, PV-power and electricity storage is a viable and profitable investment for an office building complex with a high annual energy demand.
TABLE OF CONTENTS
1 INTRODUCTION ...1 1.1 Background ... 1 1.2 Purpose ... 2 1.3 Research questions ... 3 1.4 Delimitation ... 3 2 METHOD ...42.1 Structure of empirical study and collection of material ... 4
2.1.1 Literature reviews ... 4
2.1.2 Simulations ... 4
2.2 Analysis of material ... 5
3 LITERATURE REVIEW ...5
3.1 Buildings as energy systems and Swedish regulations ... 5
3.1.1 Ventilation systems ... 7
3.1.2 Radiator space heating systems ... 9
3.2 Geothermal energy systems ...10
3.2.1 System design ...10
3.2.2 Utilization techniques ...12
3.2.3 GSHP for heating office buildings ...12
3.3 Solar energy systems...13
3.3.1 Recent years solar power development ...13
3.3.2 Swedish solar power development ...14
3.3.2.1. Investment cost incentive ... 14
3.3.2.2. Tax reduction system ... 14
3.3.2.3. Battery system incentive ... 14
3.3.2.4. Elcertificate system ... 15
3.3.2.5. Net-metering ... 15
3.3.3 Photovoltaic solar cell systems for use in office buildings ...16
3.4 Energy storage systems ...17
3.4.2 Hot water storage ...18
3.5 Economic calculations ...19
3.5.1 Swedish electricity price structure ...19
3.5.2 Methods for determining the profitability of a technical installation ...19
4 MODEL DEVELOPMENT ... 20
4.1 Developing the model in TRNSYS ...21
4.2 Baseline scenario (Scenario 1) ...22
4.2.1 Description and modelling of the building ...22
4.2.2 Consumption data treatment ...24
4.2.3 Modelling the district heating system ...27
4.2.4 Modelling the space heating distribution system ...27
4.2.5 Modelling the weather ...28
4.2.6 Determining the accuracy of the simulation results ...28
4.3 Combined GSHP and PV-system (Scenario 2) ...28
4.3.1 Modelling the hot-water storage tank ...29
4.3.2 Modelling the heat pump unit ...29
4.3.3 Modelling the heat source ...30
4.3.4 Modelling the electrical auxiliary heater ...30
4.3.5 Modelling the PV-system ...31
4.3.6 Modelling the control units ...32
4.4 Combined GSHP- and PV-system with electricity storage (Scenario 3) ...32
4.4.1 Modelling the regulator and battery ...33
4.4.2 Energy simulation logic ...34
4.5 Economical assessment ...35
4.5.1 Assessment of baseline scenario ...35
4.5.2 Assessment of Scenario 2 and Scenario 3 ...36
4.5.3 Installation- and maintenance costs ...37
4.5.4 Economic viability ...37
4.6 Sensitivity analysis ...38
5 RESULTS ... 39
5.2 Building energy simulation results ...41
5.3 PV-system simulation results ...44
5.4 Battery simulation results ...46
5.5 Building specific energy demand ...47
5.6 Sensitivity analysis ...48
6 DISCUSSION... 49
6.1 Main results ...49
6.1.1 Battery system ...49
6.1.2 PV-system ...50
6.1.3 District heating price models ...51
6.1.4 Ground-source heat pump system ...52
6.2 Choice of methodology ...53
7 CONCLUSIONS ... 53
8 SUGGESTIONS FOR FURTHER WORK ... 54
REFERENCES ... 55
APPENDIX 1 BUILDING SCHEMATICS
APPENDIX 2 NIBE FIGHTER 1330
LIST OF FIGURES
Figure 1 System boundaries for building regulation ... 6
Figure 2 Natural ventilation (Illustration: Bo Reinerdahl) ... 8
Figure 3 Exhaust air ventilation system (left) and FTX-system (right) (Illustration: Bo Reinerdahl)... 8
Figure 4 Schematic of vertical geothermal energy system (Google Images, 2018) ... 11
Figure 5 Monthly average elcertificate price (Swedish Energy Agency, 2017b) ... 15
Figure 6 Yearly installed PV-capacity in Sweden (Swedish Energy Agency, 2015c) ...16
Figure 7 Electricity price constituents ...19
Figure 8 Conceptual model ...21
Figure 9 Aerial view of building complex (Google Maps, 2018) ... 22
Figure 10 Simulation model aerial view of building complex ... 23
Figure 11 District heating reference simulation model ... 24
Figure 12 District heating energy usage 2012 (left) and 2014 (right) ... 25
Figure 13 Building electricity consumption (2014) ... 25
Figure 14 Daily average electricity usage ... 26
Figure 15 Daily average domestic hot water usage ... 26
Figure 16 Radiator supply temperature ... 27
Figure 17 GSHP- and PV-system simulation model ... 29
Figure 18 Combined GSHP-, PV-system and battery simulation model ... 33
Figure 19 Electricity price structure for technical installation ... 36
Figure 20 Space heating energy demand (2012) ... 39
Figure 21 Space heating energy demand (2014) ... 40
Figure 22 Monthly accuracy of simulation results ...41
Figure 23 Simulated building zone temperatures ... 42
Figure 24 Outdoor temperature (2014) ... 42
Figure 25 Domestic hot water tank temperature ... 43
Figure 26 Ground source heat pump system operating temperatures ... 43
Figure 27 Coefficient of performance (COP) ... 44
Figure 28 Monthly PV-production and building electricity demand ... 45
Figure 29 Cumulative discounted cash flow (Scenario 2) ... 46
Figure 30 Cumulative discounted cash flow (Scenario 2, preliminary DH power tariff) ... 46
Figure 31 Cross-sectional building schematic (Building C & D) ...61
Figure 32 Outside building schematic (Buildings C & D) ... 62
Figure 33 Indoor building schematic (Buildings C & D) ... 62
Figure 34 In- and outside building schematic (Building E) ... 63
Figure 35 Cross-sectional building schematic (Building E) ... 63
LIST OF TABLES
Table 1 Building component's U-value... 23
Table 2 Annual building energy demand ... 25
Table 3 Radiator design parameters ... 27
Table 4 Borehole- and ground characteristics ... 30
Table 5 Electrical characteristics STP275-20 ... 31
Table 6 Preliminary fixed costs ... 35
Table 7 Preliminary variable costs ... 36
Table 8 Accuracy of simulation results ... 40
Table 9 District heating price model comparison ...41
Table 10 PV-system performance indicators ... 45
Table 11 Financial statistics of the PV-production ... 45
Table 12 Battery system simulation results ... 47
Table 13 Economic evaluation of different battery capacities ... 47
Table 14 Building specific energy demand ... 47
Table 15 Sensitivity analysis ... 48
Table 16 Battery NPV without subsidies ... 49
LIST OF EQUATIONS
Equation 1 Standard building specific energy demand ... 6Equation 2 NZEB building specific energy demand ... 7
Equation 3 Heat transfer rate ... 9
Equation 4 Radiator heat transfer rate ... 9
Equation 5 Coefficient of Performance ... 11
Equation 6 Self-consumption index (%) ... 17
Equation 7 Self-sufficiency index (%) ... 17
Equation 8 Net present value ... 20
Equation 9 Battery capacity [Ah] ... 33
Equation 10 Battery capacity [kWh] ... 34
NOMENCLATURE
Symbol Description Unit
A Area m2
BAh Battery capacity Ah
𝐶0 Investment cost SEK
Ccapacity Battery cell capacity Ah
Cp Specific heat capacity J/(kg K)
Ct Net cash inflow SEK
E Energy kWh
Eel Electricity kWh
Especific Specific energy demand kWh/m2
I Current A
Krad Radiator constant W/°Cn
n Radiator exponent -
Nparallel Number of cells in parallel -
Nseries Number of cells in series -
NT Net cash flow SEK
P Battery capacity kWh
𝑄̇ Heat transfer rate W
Qheat Heat output W
r Discount rate %
T Year of operation -
U Overall heat transfer coefficient W/(m2 K)
V Battery voltage V
W Power W
Δtm Mean temperature difference ℃
η Efficiency -
ρ Density kg/m3
ABBREVIATIONS
Abbreviation Description
Abbreviation Description
BBR Boverket's Building Regulations
BoS Balance of System
COP Coefficient Of Performance
DCF Discounted Cash Flow
DEG Decentralized Energy Generation
DH District Heating
DHW Domestic Hot Water
DPP Discounted Payback Period
EED Energy Efficiency Directive
EPBD Energy Performance of Building Directive
FTX Från- och Tillluft med Värmeåtervinning (Exhaust- and supply air ventilation with heat recovery)
GSHP Ground-Source Heat Pump
HVAC Heating, Ventilation, and Air Conditioning
IRR Internal Rate of Return
Li-ion Lithium-Ion
NiCd Nickel-Cadmium
NiMH Nickel-Metal-Hydride
NPV Net Present Value
NZEB Nearly Zero Energy Buildings
PBT PayBack Time
PI Profitability Index
PV PhotoVoltaic
ROIC Return on Invested Capital
ROT Renovering, Ombyggnad, Tillbyggnad (Repairs, Conversion, Extension)
SCI Self-Consumption Index
SCOP Seasonal Coefficient Of Performance SSI Self-Sufficiency Index
TES Thermal Energy Storage
1
INTRODUCTION
Focus on environmental challenges has risen greatly during the last decade and is at present equivalent to topics such as employment, socio-economic development, research, and
education, evident by for example the Europe 2020-strategy (Government Offices of Sweden, n.d.). Major resources are as such being spent at national levels aimed at reducing the carbon footprint of goods and services, along with mitigating deleterious greenhouse gases. Energy systems plays a key role in this process and can be made more sustainable by increasing the effectiveness in production, transmission and end use along with an increased share of renewable energy sources.
This work is a presentation of a degree project aimed at investigating the potential of adapting an on-site heat- and power supply system for an office-building complex. The sections below describe the context of the study and its positioning with respect to other studies in the specific field of research, along with the research questions that has been answered and corresponding limitations that was set.
1.1 Background
The rapid growth in world population coupled with enhancements of building services, increased comfort levels and an increased time spent indoors have significantly raised building energy use over the past decade. At present the building stock in both the U.S and the European union accounts for over 40% of final energy usage (Cao et al., 2016). This is mostly due to an increased demand on HVAC (heating, ventilation, and air conditioning) services where it represents almost half of the energy used in modern buildings (Li et al., 2017a).
Considering the energy usage of non-residential buildings, which includes offices, shops, schools and hospitals amongst others, it is on average at least 40% higher than that of the residential building sector. This is mainly associated with the utilization of lightning, ventilation, heating, cooling, IT equipment and other appliances (D’Agostino et al., 2017) Another major impacting factor on the end energy usage is the number of occupants who utilizes the various building services, where a study on occupancy density and behaviour done by Kang et al. (2018) reveals that the end energy use may differ with up to 50,3% for comparable buildings depending on these two factors alone. This in turn enables significant energy savings with the adaption of energy efficiency measures and operational strategies. Improving building energy efficiency along with increasing renewable energy penetration rates are as well key goals of European energy policies. The Climate and Energy package legislated in 2009 set a target of 20% increase in building energy efficiency by the year 2020. Additionally, it includes an increase of renewable energy production by 20% along with a
decrease of greenhouse gas emissions by 20% compared with 1990s levels (European Commission, n.d.,a). These targets have since then been updated by the 2030 Climate and Energy framework to include a reduction of greenhouse gas emissions by 40% from 1990s levels, along with the share for renewable energy set at 27% and improvement in energy efficiency by 27% (European Commission, n.d.,b). Furthermore, the EU has introduced the Energy Performance of Building Directive (EPBD) and Energy Efficiency Directive (EED) which states the implementation of nearly zero energy buildings (NZEB) for public buildings by the end of 2018 and all buildings by 2020 (European Commission, n.d.,c).
Member countries are bound by legislation to implement the EPBD in their national regulations no later than 2020, highlighting that both EU directives and country specific guidelines are becoming more stringent. In Sweden, the Swedish National Board of Housing, Building and Planning has derived a proposal for a NZEB standard that has been sent out for consultation, but has yet to become a binding regulation (Thygesen, 2017).
There is also a stated ambition by the Swedish government to support decentralized energy generation (DEG) systems in the form of PV where there currently are three incentive schemes in place aimed at increasing the installation rate. This is done as one part of the Swedish ambition to rely solely on renewable energy sources for electricity production by 2036. Furthermore, there are large advantages to utilizing ground-source heat pumps (GSHP) for heating buildings with the way Swedish building regulations focus on purchased energy. This coupled with high effectiveness and steady seasonal performance (SCOP) of new GSHPs often make for profitable installations. (Thygesen, 2017)
As there are significant energy savings to be made in the building sector, and especially in non-residential buildings if constructed and operated properly, energy efficiency measures are viewed as a key solution in addressing the energy and climate goals detailed for earlier (Cao et al., 2016). This has led to numerous studies exploring appropriate renewable energy sources (RES) for building use (Li et al., 2017a). However, studies of combined systems conducted in cold climate regions, such as Sweden, are rather scarce (Wang et al., 2015; Tamasauskas et al., 2013).
The contribution of this study involves the investigation of an integrated on-site combined heat- and power supply system using renewable production techniques. This is in line with the current trends of reducing the environmental impact of the building sector experienced globally, and is furthermore applicable to the increased rigour of both European and Swedish energy directives. Additionally, it contributes to the development of modern office-buildings in particular where the investigation may provide guidelines on how future office-buildings may be designed, and especially in cold-climate countries where investigations are scarce regarding the intended system design.
1.2 Purpose
The purpose of this work is to develop a simulation model of an office-building complex located in Västerås and to investigate the energy saving potential along with the economic
viability of adapting a new integrated heat- and power supply system. The effectiveness of the system solution is then to be compared with the existing system, with the aim of having the model serve as a tool for similar investigations further on.
1.3 Research questions
Previous researches have separately considered the opportunities and challenges involved with adapting an on-site combined heat- and power supply system. However, few have considered an integrated system design similar to what is proposed in this study. Therefore, this study aims to address this knowledge gap by answering following research questions: - How would an integrated system of renewable energy production techniques along with heat- and power storage capabilities need to be constructed and operated to satisfy human thermal requirements and building energy certifications?
- How much will the self-consumption increase with an electricity storage system and is it profitable?
- Which heat- and power supply system yields the lowest building specific energy demand and is it profitable?
1.4 Delimitation
The study is limited to the concept of office-buildings and corresponding building
characteristics, for example time schedules, heating set-points, operations- and maintenance costs etc. This is due to estimates of missing input data being in accordance with suggested values for office-buildings specifically. Furthermore, due to the purpose of having the model serve as a tool for similar investigations an overall generic approach was applied where the designed systems are depicted in their simplest form and where substructures (valves, piping, wiring, etc.) are excluded.
Simulation results are limited to hourly values due to input data being supplied in the same format. No forecasting or operational strategies was developed for the designed systems. Finally, the financial considerations are limited to the cost and benefits of the developed system components, and where the cost of substructures are as stated earlier neglected.
2
METHOD
The general structure of the methodology that was applied is in short detailed for in the sections below. For further details regarding estimations, assumptions and limitations please see the Model Development section.
2.1 Structure of empirical study and collection of material
Case studies has been made on an office-building located in Västerås, Västmanland. The building complex is used as offices with approximately 115 occupants during normal working hours (06-18). It is connected to the local district heating grid as well as the local power grid, both owned by Mälarenergi AB.
A 3D-model of the building was created in Google SketchUp in accordance with blueprints of the building using the extension Trnsys3d (See Appendix 1 for details). Additionally, an IDA ICE-model of the same office building, created by a member of the academy for doctoral studies, was used as a reference for both the structural design and certain construction parameters.
2.1.1 Literature reviews
Literature reviews has been conducted to attain information regarding the construction and integration of both a ground-source heat pump system and a photovoltaic solar cell system to a building. Additionally, the review was extended to include battery storage systems and how such a system may be implemented and operated. Furthermore, studies regarding current price models for both district heating and electricity tariffs has been conducted, along with a survey of actual market costs of components needed for the construction of the proposed new systems. Finally, the literature review includes a presentation of operational requirements and parameters set by the Swedish National Board of Housing, Building and Planning to guarantee a safe and healthy indoor building climate.
2.1.2 Simulations
Simulation software TRNSYS (Transient systems simulation) was used to model the existing heat- and power supply system. Consumption data was provided by the facility owner and was used to validate the existing system design (scenario 1) so that accurate comparisons with the new proposed system designs could be made. The new energy delivery system, comprised of a ground-source heat pump system in combination with a standalone PV-system (scenario 2) and with the addition of a battery (scenario 3) was constructed using the same software and in accordance with the guidelines acquired via the literature review. The choice of applying TRNSYS for model development and simulations is twofold. Firstly, the software has been used extensively for similar projects of equal magnitude (Tamasauskas et al., (2017), Thygesen, (2017), Wang et al., (2015)) and with satisfying results. Secondly,
several earlier studies have validated the standard types included in the built-in library which allows for accurate and reliable use, whilst still having the flexibility to alter certain type parameters to better represent desired characteristics. See section 4.1 for further details regarding the simulation software.
Weather data for the location of the building (Fallhammargatan 3B) was acquired using Shiny Weather Data (2017), an online tool developed by a member of the academy for acquiring weather data in five different formats. Data for year 2012 and 2014 was downloaded and entered as an Energy+ file in TRNSYS.
2.2 Analysis of material
Simulations of the energy performance of the building were obtained through TRNSYS and exported to MS Excel where the evaluation of the constructed system designs were
conducted. Key building characteristics were analysed and compared with the existing district heating system to determine the viability of the constructed heat- and power supply systems in terms of the indoor building climate. Furthermore, the economic viability of the system designs was evaluated and compared to the costs of utilizing the district heating system.
Finally, a sensitivity analysis was conducted to evaluate the reliability of the results, where certain operational parameters and corresponding effect on the profitability of the technical installations was investigated.
3
LITERATURE REVIEW
The literature review contains a summary of information needed to construct the model and to analyse the results. Similar investigations, methodologies and corresponding results are detailed for along with up to date suggestions regarding certain building- and
operational parameters that was either missing or incomplete in the provided input data. Finally, knowledge gaps in earlier research is identified which constitutes the basis for the current study.
3.1 Buildings as energy systems and Swedish regulations
When constructing, refurbishing or expanding on any building the Swedish National Board of Housing, Building and Planning has a set of building regulations (BBR) that needs to be adopted. These represent the minimum requirements that must be met in order to fulfil adequate child safety procedures along with accessibility-, fire protection- and satisfactory
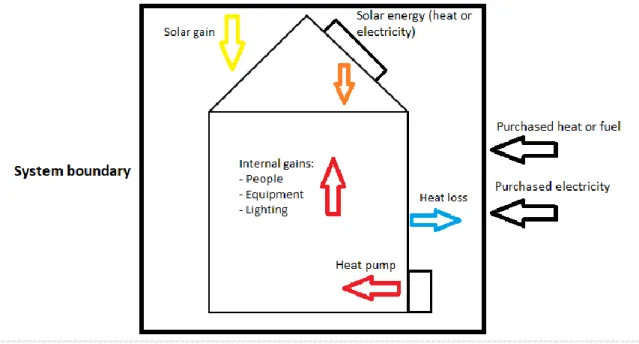
indoor climate schemes (National Board of Housing, Building and Planning, 2017a) Regarding the energy performance the term specific energy demand is used as the main requirement and is defined as the building energy demand divided by the area of the building that is heated to at least 10 ℃. Only purchased energy is included in the specific energy demand, i.e. energy used for heating, domestic hot water (DHW) production, cooling and various building services (fans, pumps etc.) (Thygesen, 2016). An illustration of the system boundaries for the building regulation is shown in Figure 1.
Figure 1 System boundaries for building regulation
The specific energy demand calculation is presented in Equation 1.
Equation 1 Standard building specific energy demand
𝐸𝑠𝑝𝑒𝑐𝑖𝑓𝑖𝑐 =
𝐸ℎ𝑒𝑎𝑡𝑖𝑛𝑔+ 𝐸𝑐𝑜𝑜𝑙𝑖𝑛𝑔+ 𝐸𝐷𝐻𝑊+ 𝐸𝑏𝑢𝑖𝑙𝑑𝑖𝑛𝑔 𝑠𝑒𝑟𝑣𝑖𝑐𝑒𝑠 𝐴𝑡𝑒𝑚𝑝
Where
𝐸𝑠𝑝𝑒𝑐𝑖𝑓𝑖𝑐 Building specific energy demand 𝐸ℎ𝑒𝑎𝑡𝑖𝑛𝑔 Energy used for heating
𝐸𝑐𝑜𝑜𝑙𝑖𝑛𝑔 Energy used for cooling 𝐸𝐷𝐻𝑊 Energy used for DHW
𝐸𝑏𝑢𝑖𝑙𝑑𝑖𝑛𝑔 𝑠𝑒𝑟𝑣𝑖𝑐𝑒𝑠 Energy used for building services, e.g. fans, pumps etc. 𝐴𝑡𝑒𝑚𝑝 Living area heated to 10 ℃ or more
The 2010 Energy Performance of Buildings Directive (EPBD) and the 2012 Energy Efficiency Directive (EED) issued by the EU are the main legislations covering the reduction of energy consumption within the building sector. Under the existing EPBD all new buildings must be
nearly zero energy building (NZEB) by 31st December 2020, and all public buildings by 31st December 2018. Furthermore, EU countries must set minimum energy performance requirements for new buildings, along with implementing long-term national building renovation strategies, as stated in the EED (European Commission, n.d.,c). Resulting from this, the Swedish National Board of Housing, Building and Planning has developed a
proposal for a national NZEB definition. Similar to the current building regulations the new proposal is based on purchased energy but introduces weighing factors for different energy usages. Electricity used for heating, cooling or DHW production has a weighing factor of 2,5 whereas electricity used for building services has a factor 1. Household electricity is excluded from the specific energy demand. (Thygesen, 2016) The specific energy demand according to the new NZEB definition is calculated as shown in Equation 2.
Equation 2 NZEB building specific energy demand
𝐸𝑠𝑝𝑒𝑐,𝑁𝑍𝐸𝐵
=(𝐸𝑒𝑙,ℎ𝑒𝑎𝑡𝑖𝑛𝑔+ 𝐸𝑒𝑙,𝑐𝑜𝑜𝑙𝑖𝑛𝑔+ 𝐸𝑒𝑙,𝐷𝐻𝑊) ∗ 2,5 + 𝐸𝑒𝑙,𝑏𝑢𝑖𝑙𝑑𝑖𝑛𝑔 𝑠𝑒𝑟𝑣𝑖𝑐𝑒𝑠+ 𝐸ℎ𝑒𝑎𝑡𝑖𝑛𝑔+ 𝐸𝑐𝑜𝑜𝑙𝑖𝑛𝑔+ 𝐸𝐷𝐻𝑊 𝐴𝑡𝑒𝑚𝑝
Where
𝐸𝑠𝑝𝑒𝑐,𝑁𝑍𝐸𝐵 NZEB standard specific energy demand 𝐸𝑒𝑙,ℎ𝑒𝑎𝑡𝑖𝑛𝑔 Electricity used for heating
𝐸𝑒𝑙,𝑐𝑜𝑜𝑙𝑖𝑛𝑔 Electricity used for cooling 𝐸𝑒𝑙,𝐷𝐻𝑊 Electricity used for DHW
𝐸𝑒𝑙,𝑏𝑢𝑖𝑙𝑑𝑖𝑛𝑔 𝑠𝑒𝑟𝑣𝑖𝑐𝑒𝑠 Electricity used for building services 𝐸ℎ𝑒𝑎𝑡𝑖𝑛𝑔 Energy other than electricity used for heating 𝐸𝑐𝑜𝑜𝑙𝑖𝑛𝑔 Energy other than electricity used for cooling 𝐸𝐷𝐻𝑊 Energy other than electricity used for DHW 𝐴𝑡𝑒𝑚𝑝 Living area heated to 10 ℃ or more
3.1.1 Ventilation systems
The air in any building needs to be exchanged regularly to ensure a healthy indoor climate. According to Boverket’s building regulations (BBR) the minimum allowed ventilation air flow rate is 0,35 litres per second and square metre living space (l/(s m2)). It is however allowed to reduce the flow rate to 0,1 l/(s m2) while the building is vacant to reduce energy use (National Board of Housing, Building and Planning, 2017b).
In buildings constructed before 1976 natural ventilation was common, where the exchange of air is mainly driven by the indoor- and outdoor temperature difference. However, advances in construction materials and methods have made modern buildings have a higher air
tightness which requires mechanical ventilation to comply with the regulations set in the BBR. (Thygsesen, 2016)
Figure 2 Natural ventilation (Illustration: Bo Reinerdahl)
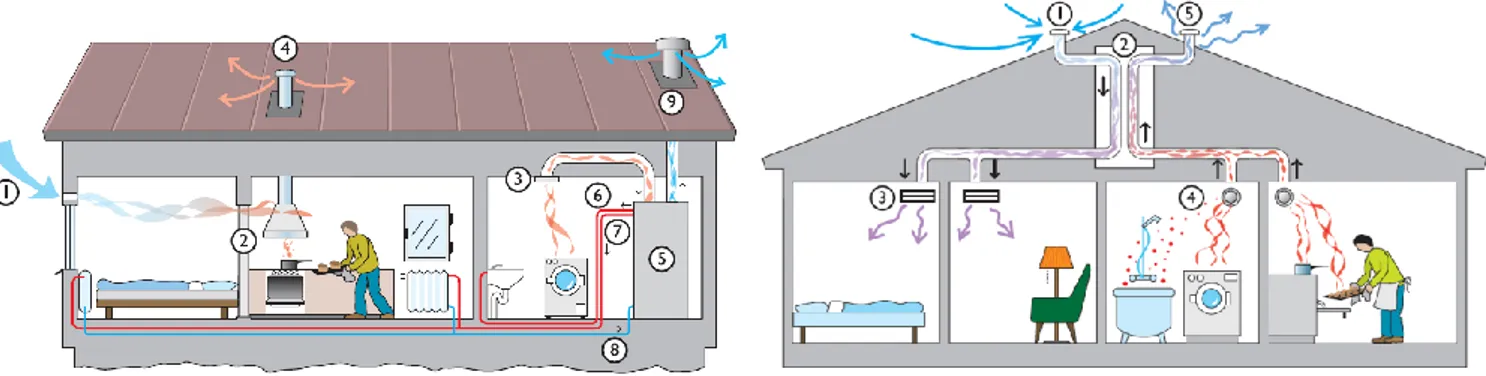
There are in principle two types of mechanical ventilation systems, the exhaust air system and the supply- and exhaust air system. In an exhaust air system, a fan which exhaust air from the building is in continuous operation which creates a slight vacuum. This enables supply air to enter via outdoor air registers, fitted in for example window frames and walls. These air registers are as well often self-regulating to limit the air flow at very low outdoor temperatures (Swedish Energy Agency, 2015a).
An exhaust- and supply air system with heat recovery (FTX) on the other hand performs well regardless of weather, and is as well more energy efficient. One supply- and one exhaust fan ventilate the house through two separate duct systems. Warm air from kitchens, bathrooms and utility rooms are drawn and passed through a heat exchanged which transfers heat to an inlet stream of cold, outside air. This supply of fresh air is then distributed to bedrooms, living rooms and other living areas. Implementing a heat recovery system enables energy savings of up to 50 – 60% compared to a system in which heat is not recovered. There are however impediments present in such a system as well, for example the risk of sound problems along with a fouling sensitivity which raises the need for maintenance (Swedish Energy Agency, 2015b).
Figure 3 Exhaust air ventilation system (left) and FTX-system (right) (Illustration: Bo Reinerdahl)
3.1.2 Radiator space heating systems
According to Jangsten (2016) roughly 94% of multi-family buildings in Sweden utilizes hydronic heating systems, of which radiators is the most commonly installed heat emitter. The radiator distribution system supplies heat by circulating hot water through distribution pipelines to radiators situated in heated zones. The water is cooled as heat is exchanged with the surrounding air and is returned to the substation via another set of pipelines. The most common installation is the 2-pipe system, in which supply- and return lines are separated and smaller branch pipes supplies each individual radiator, where several may be connected in parallel. Other system configurations include 1-pipe and 3-pipe systems, but are both significantly less utilized due to efficiency- and costs concerns.
The design process of a radiator space heating system involves the selection of adequately sized components so that the necessary heating demand will be fulfilled. Decisions must be made with respect to the prevailing temperature levels within the heating system and the surroundings in which it is to operate. Equation 3 denotes the correlation between inlet- and outlet fluid temperatures, the overall heat transfer coefficient and the total heat surface area for any arbitrary heat exchanger
Equation 3 Heat transfer rate
𝑄̇ = 𝑈 ∗ 𝐴 ∗ Δ𝑡𝑚 Where
𝑄̇ Heat transfer rate
𝑈 Overall heat transfer coefficient 𝐴 Heat emitting surface area
Δ𝑡𝑚 Mean temperature difference between hot- and cold flow
For the case of a radiator the heat transfer will take place between the water inside the
radiator, the surrounding air and boundary walls in which the radiator is located. I.e. the heat exchange will be a combination of convection and radiation of non-linear characteristic. Hence, Equation 3 must be modified and for a panel radiator following expression has been developed (Trüschel, 2002).
Equation 4 Radiator heat transfer rate
𝑄̇𝑟𝑎𝑑= 𝐾𝑟𝑎𝑑∗ Δ𝑡𝑚𝑛 Where
𝑄̇𝑟𝑎𝑑 Radiator heat transfer rate 𝐾𝑟𝑎𝑑 Radiator constant
Both the radiator constant and the radiator exponent depend on the size and characteristic of the radiator component.
3.2 Geothermal energy systems
Geothermal energy is the collective term for solar energy stored in rock and ground. The heating of ground surface layers is achieved by both incoming solar radiation as well as radioactive heating from the earth’s core. Ground-source heat pumps (GSHP) utilizes this temperature difference for heating and cooling of buildings where the heat extracted during cold periods is returned via solar radiation during summer time, and to some extent via the thermal energy system itself. It is classified as a renewable energy resource and Sweden is the number one country in utilization of geothermal energy per capita (2009) where it represents roughly 20% of residential buildings and 10% of the remaining building stock
(Nationalencyklopedin, n.d.,a).
3.2.1 System design
A typical system design is comprised of a ground loop, heat pump and a distribution system. The ground loop consists of a series of pipes that is buried beneath ground. A heat transfer fluid (anti-freeze and water mixture) runs inside the ground pipes and removes or adds heat to the surrounding earth, depending on operational mode. The mixture then carries the absorbed heat to a heat pump unit. In a forced air system, heated air is distributed through the buildings ductwork, whereas in a hydronic system the hot water is circulated through radiators or another circulation system to provide heat (Manitoba Hydro, n.d.). A schematic of a typical vertical GSHP system is shown in Figure 4.
Figure 4 Schematic of vertical geothermal energy system (Google Images, 2018)
There are several measures available to rate the heat pump performance and efficiency, one common method being the Coefficient of Performance (COP). However, authors M.R Braun et al. (2015) states that there is an ambiguous nature to the term “COP”, hence it is important to clearly define the system boundaries. The authors suggest that the COP may be determined as the desired output over the electrical power supplied to the motor terminals, or the
mechanical power acting on the compressor shaft for open compressors. The COP for a heat pump in heating mode may be determined using Equation 5.
Equation 5 Coefficient of Performance
𝐶𝑂𝑃ℎ𝑒𝑎𝑡𝑖𝑛𝑔= 𝑄ℎ𝑒𝑎𝑡
𝑊 Where
𝐶𝑂𝑃ℎ𝑒𝑎𝑡𝑖𝑛𝑔 Coefficient of Performance of the heat pump in heating mode 𝑄ℎ𝑒𝑎𝑡 Heat output from the condenser
3.2.2 Utilization techniques
Li et al. (2017a) states that due to the high availability and constant source temperature GSHPs are ideal for direct building use. However unequal heating and cooling demands for different seasons may be present depending on the zone in which the building is located. An investigation on the underground thermal imbalance of ground-coupled heat pumps by Yang et al. (2013) shows that if heat extracted during winters is significantly higher than injected during summers, cold accumulation and soil temperature decrease may occur which could result in system performance deterioration and ultimately system failure. The same study shows that similar problems may occur if the situation is the opposite as well, as for a cooling-dominated GSHP-system.
These conclusions are supported in the works of You et al. (2016), however they expand their research to investigate possible solutions as well. In total three solutions are found which alleviates soil temperature variations and aids in keeping the performance of the ground heat exchanger (GHE) steadily. Given enough borehole land a larger borehole can make the soil heat retainer larger, which is shown to increase the overall COP of the system by 0,4 – 1,2. Another, similar measure is to increase the borehole length which increases the total heat exchange per borehole. This may be achieved by either increasing the number of boreholes or by increasing the borehole depth. Finally, the borehole layout is shown to be of great
significance for the soil temperature recovery and may as such be modified to either increase or decrease the heat extraction- or injection to the GHE.
Regardless of modifications and measures to ensure continuity of the system, Li et al. (2017a) points out in their study on the long-term performance of GSHPs that due to varying season lengths and demand loads soil thermal imbalance is almost inevitable, which raises the need for accurate control strategies to retain high effectiveness and to reduce maintenance costs. One utilization pathway for GSHP-systems is radiant floor heating systems, which are highly flexible regarding the choice of heat source. Zhang et al. (2017) has evaluated the
performance of such a system for space heating, where they conclude that the advantages of such a system, in comparison with air conditioning is draught sensation, reduced dust accumulation as well as better satisfying the human body regulation characteristics. This enables temperatures 2 to 3 ℃ lower than a comparable convection heating system whilst achieving the same thermal comfort levels, which may reduce building energy use by up to 15%.
3.2.3 GSHP for heating office buildings
Several studies on GSHP-systems for use in office buildings has been conducted. They are however rarely stand-alone systems but rather combined with some sort of sub-system. For example, the combination of thermal solar power and GSHP-systems is greatly recognized in cold climate regions where unbalanced heating- and cooling loads are present (Li et al., 2017b)
Authors Tamasauskas et al. (2013) has evaluated three solar heating- and cooling systems for an office building located in Montreal, Canada. A reference case was constructed using
TRNSYS and used to determine thermal loads and end energy use distribution. The analysis revealed that it is of great importance to operate the solar system in both heating- and cooling mode, from which energy savings of up to 76% were achievable compared to the reference system. Furthermore, when including climate factors, it was shown that the most profitable system solution was having solar energy as a supplement to an efficient mechanical system, for example a heat pump.
Wang et al. (2015) has conducted a similar investigation where they evaluated a GSHP-system assisted with thermal solar power for space heating of an office-building in the town of Tianjin, China. The system design consisted of three subsystems, a solar heat collection system, a ground source heat exchanger and a heat pump system. Using simulation software TRNSYS the system was evaluated for a sunny day in mid-January, where results showed that the indoor air temperature could be kept at satisfying levels for the operating period. Zhang et al. (2017) also conducted a similar investigation but utilizing a radiant floor heating system instead, as well as including an energy storage tank for auxiliary heating as the electricity prices peak. This configuration did however not include a solar heat collection system, but a low heating load at night allowed for heat storage in the floor and remaining building structure to aid in heating during the day. Measurements revealed that the indoor air temperature was kept at a minimum of 18 ℃ during normal working hours, which satisfies the thermal comfort requirement of the human body. Additionally, for open space surfaces with incoming radiation the thermal comfort level could be kept for up to two days with the GSHP-system shut off and utilizing the heat storage tank only.
3.3 Solar energy systems
Solar energy systems denote both solar thermal collectors and photovoltaic solar cells (PV). Solar collectors transform solar radiation into heat via an absorber which is in turn
transferred to a medium, typically water, air or a mixture. As such a thermal collector may be used for heating water directly or as a supplementary heating system (SolarServer, 2018). Photovoltaic solar cells produce direct current which may be utilized as is or to charge a battery. Connecting the solar cell system to the electricity grid requires an inverter which transforms the direct current into an alternating current. PV-system installations in Sweden generate on average between 50 – 150 kWh/m2 depending on the type of system, with overall efficiencies in the range of 7 – 17% (Nationalencyklopedin, n.d.,b).
3.3.1 Recent years solar power development
Installed solar power worldwide experienced an increase of around 50% from year 2015 to 2016, with an installed PV-capacity of 76 GW in 2016 compared to 50 GW the year prior (The Guardian, 2017). According to Kabir et al. (2017) this increase is greatly contributed by the adaption of policies, investments and funding from both governments and non-governmental actors, which have aided in building a solid foundation for the utilization of solar power throughout many years. However, recent trends indicate that this may be about to change as
there has been significant cuts in subsidies for solar power in many countries recently. There are as well technical barriers that are still present despite years of deployment, such as low solar cells efficiencies and inadequate infrastructure which hinders further growth.
3.3.2 Swedish solar power development
There are currently three incentive schemes in place to support a strong development of PV-systems in Sweden, where all three are aimed at increasing the installation rate. This is done as a part of Sweden’s ambition of relying solely on renewables for electricity generation by 2036.
3.3.2.1.
Investment cost incentive
First, there is the investment cost incentive implemented for the first time in 2009. As of January 1st 2018 the incentive grants 30% of the total investment cost of the system for all actors, with a ceiling of 1,2 MSEK per installed system. Additionally, the eligible costs may not exceed 37 000 SEK plus tax per kilowatt electrical peak power. The incentive is however limited to the amount of grants available, which ensues a first come, first served principle where it may only be granted as long as the funding is sufficient.
There is also the possibility of applying for ROT, which is a deduction of the labour cost by 30% and applies to several technical installations. However, both ROT and investment cost subsidies cannot both be granted for the same installation (Swedish Energy Agency, 2018c).
3.3.2.2.
Tax reduction system
Secondly, there is the tax reduction system introduced in 2015 which grants producers a tax deduction of 0,6 SEK per kilowatt hour fed into the grid, limited to 18 000 SEK per year. However, the deduction does not apply to the amount of kWh that exceeds the amount bought from the grid, and to be eligible the main fuse has to be 100 amperes or smaller (Swedish Energy Agency, 2018c).
3.3.2.3.
Battery system incentive
Finally, the third incentive implemented in 2016 is a battery system incentive and applies for private consumers that wants to store their self-produced electricity. It grants funding for up to 60% of the total cost of the storage system, with a maximum set at 50 000 SEK and will be eligible for installations conducted between the 1st of January 2016 and the 31st of December 2019. As with the investment cost incentive there is also the possibility of applying for ROT for deductions of the installation cost, however ROT and battery system incentive may not both be granted for the same installation (Swedish Energy Agency, 2016).
3.3.2.4.
Elcertificate system
The elcertificate system was introduced in Sweden in 2003 as an instrument aimed at increasing the share of renewably produced electricity. Since January 1st, 2012 Sweden and Norway share the elcertificate market with a common goal of increasing the renewable electricity generation by 28,4 TWh as of 2020. Eligible renewable sources include amongst others wind- and solar power (Swedish Energy Agency, 2017a).
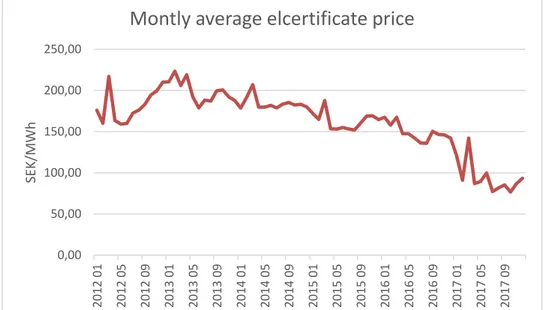
For each renewably generated MWh electricity the producer is eligible to apply for one (1) elcertificate from the Swedish government. The certificate may subsequently be sold on an open market where the price is determined using supply- and demand principles. To ensure a stable demand there is a lawfully stated obligation for certain suppliers, prosumers and actors on the Nordic electricity market who must purchase a certain amount of elcertificates with respect to their usage or amount of sold electricity. The quota is determined in the regulation of elcertificates and is established until 2045, which consequently is the year to which the elcertificate system is planned to be discontinued (Swedish Energy Agency, 2017b). The monthly average elcertificate price from January 2012 to December 2017 is shown in Figure 5.
Figure 5 Monthly average elcertificate price (Swedish Energy Agency, 2017b)
3.3.2.5.
Net-metering
Net metering is an administrative measure aimed at making PV-systems more profitable, and implies that excess electricity production that is fed into the grid can be used as a credit for future purchases. As such, it may be viewed as a manner of storing electricity for later use, similar to the way a battery would operate. (Luthander et al., 2014; Thygesen, 2017) Actors on the electricity market offers different net metering solutions, where the net between electricity demand and generation is calculated daily, monthly or even yearly. Several studies have investigated the profitability of utilizing different net metering schemes. Abdin & Noussan (2017) concurs that the net metering scheme in place in Italy is the main driver for the profitability of PV-system installations in Italy. According to the Swedish Society for
0,00 50,00 100,00 150,00 200,00 250,00 2012 01 2012 05 2012 09 2013 01 2013 05 2013 09 2014 01 2014 05 2014 09 2015 01 2015 05 2015 09 2016 01 2016 05 2016 09 2017 01 2017 05 2017 09 SE K/MWh
Nature Conservation (2013) a similar net metering scheme has proved valuable for the development of PV in Denmark, but emphasize that it is of great significance to consider a yearly net to account for seasonal variations in electricity generation- and demand.
Mälarenergi is one Swedish actor that offers a yearly net metering scheme (Mälarenergi, 2017).
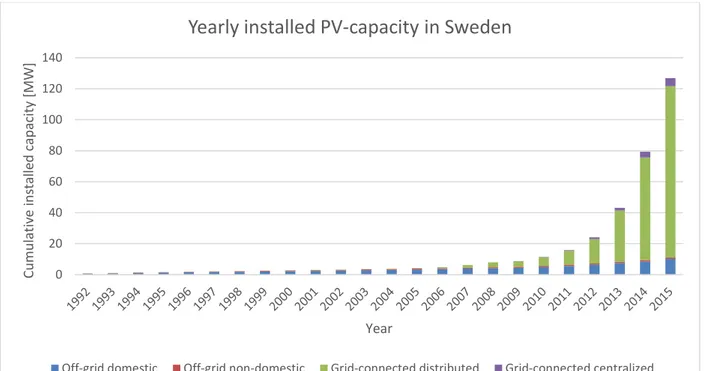
According to Thygesen (2017) the incentive schemes and governmental efforts aimed at increasing the renewable energy production seems to have influenced the installation rates for both PV-systems and solar thermal (ST) systems. This conclusion is as well supported by Sommerfeldt et al. (2016) in their study conducted at KTH which investigates the current state of photovoltaic systems for Swedish prosumers. The annual capacity growth of Swedish solar power is presented in Figure 6.
Figure 6 Yearly installed PV-capacity in Sweden (Swedish Energy Agency, 2015c)
3.3.3 Photovoltaic solar cell systems for use in office buildings
Martín-Chivelet & Montero-Gómes (2017) has evaluated the potential of building integrated photovoltaics (BIPV) for use in commercial- and office buildings, with the aim of reducing the amount of electricity bought from the local grid. Regarding residential buildings there are many studies investigating the improvement of PV self-consumption using demand-side management (DSM) and battery storage. This has proven valuable as loads can be shifted to more favourable times of the day. However, with the case of an office-building the load patterns are often fixed throughout days and along the year. Instead, the load often
corresponds well with the intensity of incoming solar radiation, making for improvements in both self-consumption and self-sufficiency without the use of battery storage.
The self-consumption index denotes the self-consumed part by the building relative to the total production of the PV-system and is presented in Equation 6 (Luthander et al., 2014).
0 20 40 60 80 100 120 140 Cumu lat iv e in sta lle d ca p acity [MW] Year
Yearly installed PV-capacity in Sweden
Equation 6 Self-consumption index (%)
𝑆𝐶𝐼 =𝑃𝑉𝑒𝑛𝑒𝑟𝑔𝑦 𝑐𝑜𝑛𝑠𝑢𝑚𝑒𝑑 𝑃𝑉𝑒𝑛𝑒𝑟𝑔𝑦 𝑝𝑟𝑜𝑑𝑢𝑐𝑒𝑑
∗ 100
The self-sufficiency index on the other hand denotes the degree to which the production of the PV-system fulfils the energy requirement of the building, determined using Equation 7 (Luthander et al., 2014).
Equation 7 Self-sufficiency index (%)
𝑆𝑆𝐼 = 𝑃𝑉𝑒𝑛𝑒𝑟𝑔𝑦 𝑐𝑜𝑛𝑠𝑢𝑚𝑒𝑑
𝐶𝑜𝑛𝑠𝑢𝑚𝑒𝑑 𝑒𝑙𝑒𝑐𝑡𝑟𝑖𝑐𝑖𝑡𝑦∗ 100
3.4 Energy storage systems
Energy storage systems denotes both thermal- and electrical storage systems. Both categories of systems are detailed for in the sections below to provide a framework for model
construction.
3.4.1 Battery systems
The most commonly used types of rechargeable (secondary) batteries are lead-acid, nickel-cadmium (NiCd), nickel-metal-hydride (NiMH), and lithium-ion (Li-ion). The lead acid battery is the oldest rechargeable battery system and is frequently deployed still due to it being reliable and economically priced. However, due to the aged technology it has a low specific energy and limited cycle count. The nickel-cadmium offers slight advantages over the lead-acid battery such as long cycle-life and being storable uncharged without deteriorating performance, but at the expense of increased costs. The nickel-metal hydride mostly serves as a replacement for the NiCd where it provides a higher specific energy and is constructed using less toxic metals. The lithium-ion battery is the most recent developed battery
technology and is replacing lead- and nickel based batteries. It is more expensive than other battery solutions but offers high cycle counts and low maintenance costs (Battery University, 2017a)
Cervantes & Chobineh (2018) has investigated the optimal sizing of a nonutility-scale (< 1 MWh/year) solar power system with battery storage. The model objective function is to minimize the total cost associated with solar power system investments and the grid provided electric power over a continuous period. The authors conclude following general
observations:
a) The optimal number of installed solar panels is sensitive to the installation labour costs b) The balance-of-system (BoS) cost has a negligible effect on the decision to install the solar power system
d) When the load is large, regardless of the battery cost it pays to install a storage-enabled solar power system
e) When a net metering program is available, the size of the installed system should be increased
These conclusions are to some extent supported in the works of Hassan et al. (2017). Both studies agree on the fact that a battery storage solution may prove profitable, and the latter expands their research to suggest a strategy for how to optimally charge and discharge the storage system. However, the same authors also conclude that a battery storage system is only economically viable as the unit cost drops to 1 627 SEK/kWh (138 £, exchange rate 2018-04-11), in contrast to the previous study which suggests that a battery system will always prove profitable with large loads, regardless of the unit cost.
The service life is as well crucial to consider when choosing a unit as replacing the battery amounts to a recurrent cost. According to Lambert (n.d.) a design life specification includes, but is not limited to the number and frequency of discharges, the maximum discharge rate, the depth of discharges and operating temperature. The author also points out that these regimes are often very difficult to comply with, which may yield service life shorter than the suggested design. A suggested number of cycles for lithium- and nickel based batteries of 300 to 500 cycles can be found in Battery University (2017b). Furthermore, a capacity bandwidth of 80 – 100% is suggested, i.e. that the battery should be replaced once the capacity loss reaches 80% of the rated capacity.
3.4.2 Hot water storage
Al-Habaibeh et al. (2017) defines a Thermal Energy Storage (TES) as a technology used to store thermal energy for use later in time in buildings and industrial processes. Furthermore, the authors highlight the usefulness of a TES system where it can aid in balancing energy supply and demand as well as reducing peak demands, energy consumption, CO2 emissions and costs. Common application areas involve coupled systems with heat pumps, boilers and solar thermal systems.
When utilized as hot- and tap water storage it is important that the tank is constructed and operated so that it limits the growth of legionella, bacteria that may cause diseases such as Legionnarire’s disease and Pontiac fever. The bacteria thrive in temperatures around 20 – 45 ℃, and according to the National Board of Housing, Building and Planning (2014) there is a palpable risk for bacteria growth in water heaters where the entire water volume cannot be heated to temperatures above 50 ℃ or in piping where water is stagnant for long periods of time. BBR recommends temperatures of 70 – 80 ℃ for 5 – 30 minutes to eliminate the bacteria and to hinder further growth.
3.5 Economic calculations
The Swedish electricity price structure and corresponding influential parameters on the buying- and selling price is detailed for below along with a variety of methods that may be applied when determining the economic viability of a technical installation.
3.5.1 Swedish electricity price structure
The reformation of the Swedish electricity market in 1996 opened for competition where costumers at the end of 2016 where able to choose from 121 electricity suppliers. The distribution of electricity is however still a regulated monopoly. The electricity price is decided by the Nord Pool power market, which operates on the balance between supply and demand. This implies that the most expensive production unit in operation at any given moment is the deciding factor for the wholesale price. To limit the effect of bottlenecks in transmissions the method of market splitting is applied, where the electricity market as a whole is divided into submarkets (bidding areas) where prices in each is determined by the individual production and consumption, as well as power transmission to and from adjacent areas. (Lindblom et al., 2017)
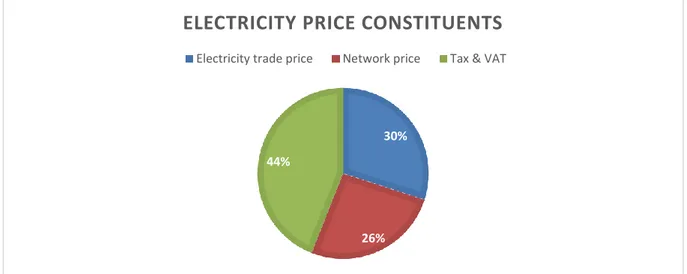
In 2016 the total electricity price consisted of 44% taxes and VAT, 30% the electricity trading price itself and 26% network and transmission costs. The relative size of each part can be seen in Figure 7.
Figure 7 Electricity price constituents
3.5.2 Methods for determining the profitability of a technical installation Several measures, often referred to as capital budget techniques, are available when
determining the profitability of a long-term investment. These techniques often serve as tools for choosing the optimal investment opportunity should several alternatives be
contemplated, where the future wealth of each alternative is assessed and compared. Gardoni et al. (2016) mentions Discounted Cash Flow (DCF) methods (such as the Net Present Value, NPV) being amongst the most popular capital budgeting techniques.
30%
26% 44%
ELECTRICITY PRICE CONSTITUENTS
The authors state that the NPV-method calculates a comparable current value of all present and future cash flows for an investment, accounted for the projects magnitude, time value, and risk of cash flows. The cash flows are typically divided into three categories:
I. Initial investment which represents the cost of building the asset II. Expected future cash in- and outflows due to sales and costs III. Investment terminal value
The formula for calculating the NPV is presented in Equation 8 (Investopedia, 2018).
Equation 8 Net present value
𝑁𝑃𝑉 = ∑ 𝐶𝑡
(1 + 𝑟)𝑡− 𝐶0 𝑇
𝑡=1 Where
𝐶𝑡 Net cash inflow during period t 𝐶0 Total initial investment cost 𝑟 Discount rate
𝑡 Number of time periods
Authors Gardoni et al. continues their analysis by stating that the NPV-method may prove insufficient should two or more projects have a similar or even equal NPV. The decision process may thus be enhanced by considering profitability ratios like the Internal Rate of Return (IRR), Discounted Payback Period (DPP), Profitability Index (PI) or Return on Invested Capital (ROIC). The IRR is obtained by solving for the discount rate as the NPV is set to zero (0). As such, it may be interpreted as the upper limit to which the investment is expected to be profitable. It is however important that the compared projects have a similar lifespan as the IRR does not explicitly account for the level and time of profitability.
Finally, the DPP refers to the time it takes for the project to break even and is determined by adding the discounted revenues for each period until the total summation is equal to the initial investment cost. By comparison, the project with the shortest DPP is the preferred option. However, by only utilizing the DPP as an indicator future benefits beyond the payback period is excluded, but owing to the simplicity of the method it is extensively used.
4
MODEL DEVELOPMENT
The development of the simulation model and included parameters are detailed for in the sections below, along with a description of the different scenarios that has been evaluated.
4.1 Developing the model in TRNSYS
The system solutions presented in the sections below have all been developed using the transient simulation program TRNSYS. According to the manufacturer’s webpage TRNSYS is a graphically based simulation software mainly focused on transient simulations of thermal- and electrical energy systems. It also contains a standard library of components which can be used as is for model constructions and simulations, but where components may also be modified by users to accurately represent desired characteristics (TRNSYS, 2018)
The source code consists of two parts, kernel equations and the components (types) used in models. The kernel reads and processes an input file which is then solved iteratively. The modelled system is solved by determining outputs for one component which is connected to the input of another, thus creating an intricate connection between components in the system. The accuracy of the simulation results is governed by the desired timestep and error tolerance, which are both set by the user. Iterations are performed until the changes in output are smaller than the specified tolerance.
In addition to inputs, each type also has a set of parameters that needs to be specified for the input file. Mathematical descriptions of all standard types are included in the TRNSYS
documentation library provided when installing the software, as well as being accessible from simulation interface.
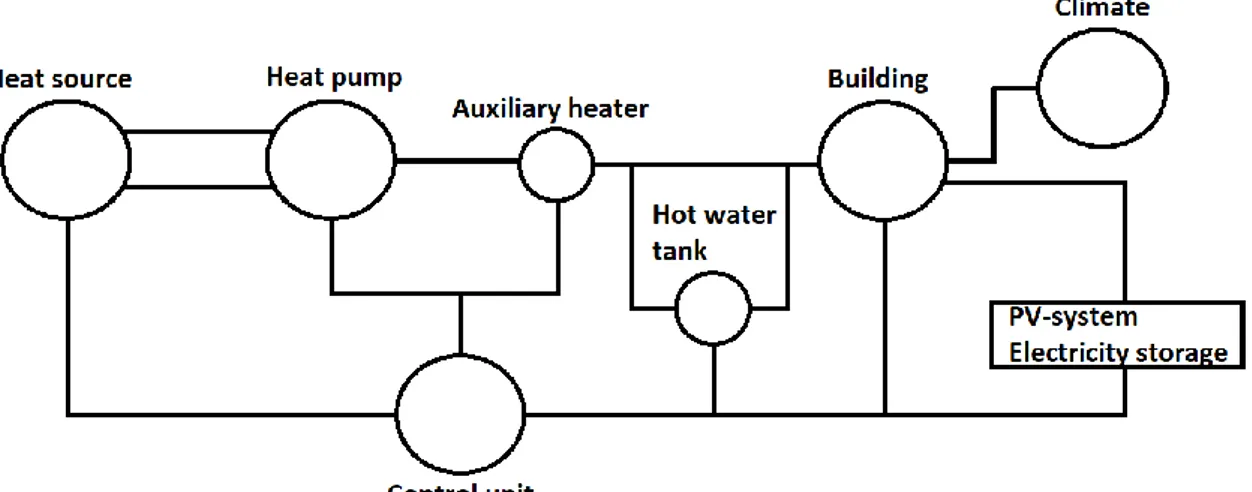
A conceptual model of the system was at first generated to aid in understanding the intricacy of the system and the interaction between components. This conceptual model is shown in Figure 8. The heat source was a geothermal energy system for the intended system designs, connected in loop with a heat pump unit. An auxiliary heater was situated after the heat pump which served to increase the water temperature that was either directed to a hot water tank or to the building radiator space heating system directly. The standalone PV-system (scenario 2) and with the addition of an electricity storage (scenario 3) are presented as a single block. Finally, the climate data that affects the building is shown along with an overall control unit governing the operation of each included component.
4.2 Baseline scenario (Scenario 1)
The baseline scenario (reference) contains a detailed model of the building and the current heat- and power supply system. The scenario was constructed to validate the developed building and corresponding thermal characteristics so that it accurately represents the actual building complex, from which comparisons with the proposed new system designs could be made.
4.2.1 Description and modelling of the building
The building complex is located at Fallhammargatan in Västerås, Sweden and is used as an office with approximately 115 occupants during normal working hours (06-18). It is
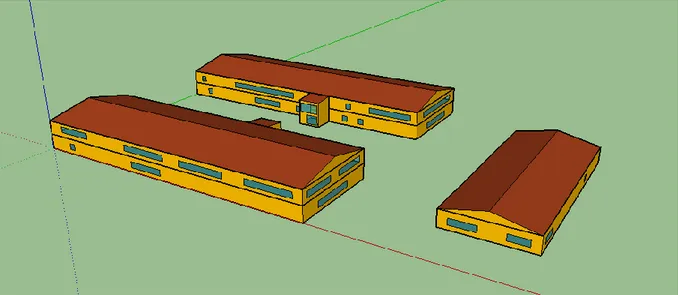
connected to the local district heating grid as well as the local power grid, both owned by Mälarenergi AB. Buildings C and D (see Figure 9) stands a total of 7,75 metres above ground comprised of two heated storeys and a non-heated attic. The outer geometry of both is 58,8 x 19,2 metres with windows on each external wall of each floor and with a total window area corresponding to roughly 35% of the related external wall surface. Building E is slightly smaller due to only having one heated floor and a non-heated attic, and measures 38,5 by 16 metres and stands 4,9 metres tall. An aerial view of the building complex is seen in Figure 9 below.
Figure 9 Aerial view of building complex (Google Maps, 2018)
A 3D-model of the building complex was constructed using Google SketchUp in accordance with blueprints and by utilizing the TRNSYS extension TRNSYS3D. Additionally, a IDA ICE model of the same building complex was used as a reference for both structural design and certain construction parameters. The generated 3D-model of the building complex is presented in Figure 10 below.
Figure 10 Simulation model aerial view of building complex
Note that by comparison with the building schematics (Appendix 1) not all windows are accurately positioned on respective wall, however this is a conscious choice. As the total size of each window is accurate along with the correct orientation the total solar irradiation to each heated zone will be the same as if the windows had been placed elsewhere on the same wall, thus yielding an accurate solar energy gain.
The 3D-model was exported to TRNSYS as an .idf file and modelled as a multizone building (Type 56) in TRNBUILD, an interface in TRNSYS used specifically for building construction and thermal characteristics determination. Construction materials of external walls, roof, floors and windows was selected from the embedded library in TRNBUILD in accordance with blueprint specifications and the IDA ICE model. The thermal characteristics of external walls, roof, ground floor and windows is shown in Table 1. Note that any doors was excluded when constructing the model, and where continuous walls were assumed.
Building component U-value (W/m2,K)
Roof 0,165
Outer walls 0,207
Ground floor 0,039
Windows 2,890
Table 1 Building component's U-value
The ventilation air flowrate was set to the minimum allowed according to BBR, at 0,35 l/(s m2) and utilizing an exhaust air only system. The infiltration loss was set at 0,1 ACH according to guidelines acquired via the literature review. Internal gains are comprised of persons, electrical appliances and artificial lightning for which time schedules for each type was constructed via a consumption data analysis, please see 4.2.2 for further details. The energy balance of each building in the complex was then calculated by TRNSYS with respect to following parameters:
• Heat loss through external walls, floor, roof and windows • Infiltration loss
• Internal gains • Solar gain
The simulation model in its entirety is shown in Figure 11. Note that the model outline is identical between the simulated years (2012 and 2014), the only difference being the weather data input. Connections between components are colour coded to make it easier to depict the intricacy of the system.
- Solid red: Radiator supply system - Dash green: Control units
- Dash blue: Simulation outputs
- Solid black: Energy supplied to the building
Figure 11 District heating reference simulation model
4.2.2 Consumption data treatment
Consumption data provided by the facility owner was analysed to benchmark the
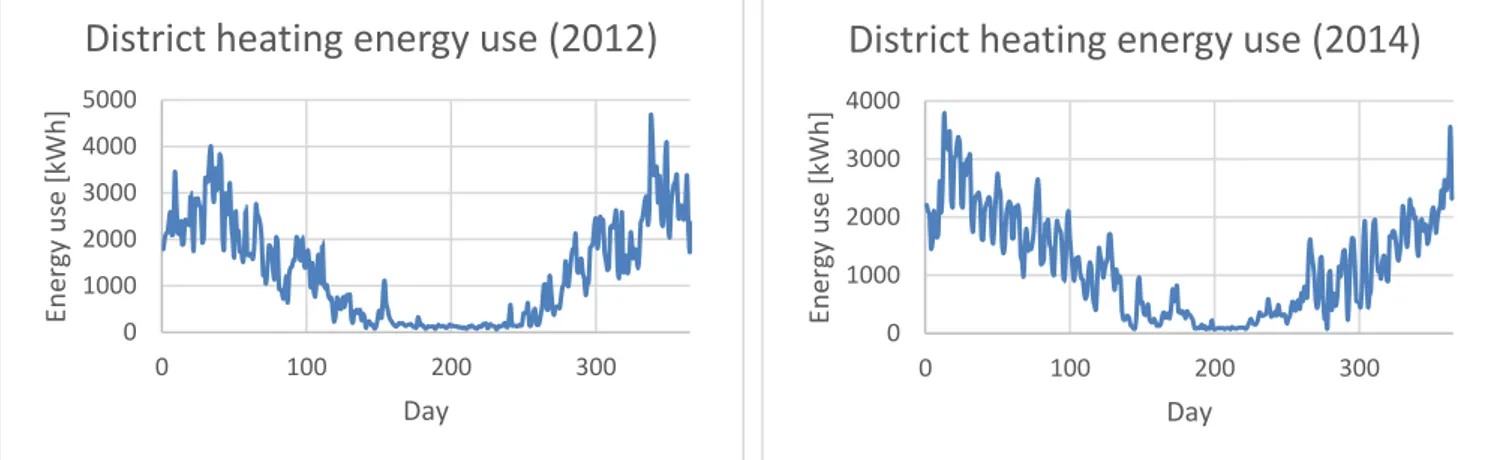
performance of the current heat- and power supply system. The district heating energy use was provided in hourly intervals for the years 2010, 2012 and 2014. However, the data set for 2010 was incomplete and thus excluded from the analysis. Instead, district heating
measurements for both 2014 and 2012 was sorted to represent the accumulated daily demand of the building complex for both years separately. The choice of analysing two separate years is done to increase the reliability of the model validation, with both increased data points and where variances between the years could be highlighted and discussed. Furthermore, the district heating energy use was as well sorted on a monthly basis to aid in the comparison between simulated and measured values, which enabled monthly variances
0 1000 2000 3000 4000 0 100 200 300 En ergy u se [kWh ] Day
District heating energy use (2014)
to be analysed. See the Results section for further details. The daily district heating energy use (including DHW use) for 2012 and 2014 are shown in Figure 12.
Figure 12 District heating energy usage 2012 (left) and 2014 (right)
The electricity consumption of the building complex was provided in hourly intervals for a continuous three-year period, starting at 1st of May 2012. The only complete yearly data set that corresponded with the provided district heating data was 2014, hence this year was chosen and the data sorted similarly to the district heating. The daily electricity demand of the building complex for 2014 is seen in Figure 13.
Figure 13 Building electricity consumption (2014)
The total building energy demand without any technical installations and divided into
heating (including DHW) and electricity for 2012 and 2014 separately can be seen in Table 2. Annual building energy demand
Year 2012 2014
Heat and DHW [kWh] 473 400 421 580
Electricity [kWh] N/A 150 362
Table 2 Annual building energy demand
0 1000 2000 3000 4000 5000 0 100 200 300 En ergy u se [kWh ] Day
District heating energy use (2012)
0 100 200 300 400 500 600 700 800 0 50 100 150 200 250 300 350 Ele ctricity co n su m p tio n [ kW h ] Day

![Figure 15 Daily average domestic hot water usage 0,05,010,015,020,025,030,000:0001:0002:0003:0004:0005:0006:0007:0008:0009:0010:0011:00 12:00 13:00 14:00 15:00 16:00 17:00 18:00 19:00 20:00 21:00 22:00 23:00Electricity use [kWh]Hour of day](https://thumb-eu.123doks.com/thumbv2/5dokorg/4709798.124011/37.892.102.652.611.1011/figure-daily-average-domestic-water-usage-electricity-hour.webp)
