DRIVER REACTIONS TO HORN AND HEADLIGHT WARNINGS IN
CRITICAL SITUATIONS – A SIMULATOR STUDY
Jonas Jansson, Birgitta Thorslund, Jonas Andersson Hultgren Swedish National Road and Transport Research Institute
SE-581 95 LINKÖPING Sweden E-mail: jonas.jansson@vti.se
Mattias Bränström Volvo Car Corporation SE-405 31 Göteborg. Sweden E-mail: mbranns3@volvocars.com
ABSTRACT
This paper presents a driving simulator study on driving behavior in a critical head-on collision scenario. The study aims at providing basic understanding of driver responses to headlight and horn warning coming from another vehicle a time critical situation. In total, 48 participants drove 30 km. During the drive participants performed a secondary task, announced by a vibration in the seat. At the time of the secondary task the own vehicle was directed into the opposing lane where oncoming simulated vehicles issued a light and/or sound warnings to get the drivers attention. An additional purpose of the study was to examine if the warning coming from the other vehicle has a different effect on persons with a hearing loss. A possible application for this type of warnings is the implementation of a system for automatic activation. Systems for automatic activation of brakes and steering are currently entering the market. These systems use proximity sensors to monitor the state of surrounding road users. Depending on the specific situation the effort/possibility to avoid or mitigate an accident may differ significantly between the principle road users of a pending collision, e.g. one road user (1) may easily avoid a collision while another (2) may not be able to do so. The only possibility for the second road user (2) to avoid a collision in such a situation is to issue a warning to the first (1), so that he/she may take evasive actions. Connecting the horn and the headlight to already existing sensor system, for automatic warning activation, is a cost effective means to provide such a warning. The warnings, could of course, also be triggered manually by the driver.
The results indicate that a driver who receives a warning from the oncoming vehicle responds faster to avoid the pending frontal collision. The most effective warning was the combination of horn and headlight. A majority of the participants where positive to the notion of an automated system to provide this type of warning (n=41). No significant difference in the behavior between the groups with and without hearing loss was found in this study.
1 INTRODUCTION
situation when the river faces an imminent danger. The installation of sensors to detect other road users in vehicles, open up the possibility to trigger an automatic warning using the horn and headlight. Systems for automatic activation of brakes and steering are currently entering the market. The systems use proximity sensors to monitor the state of surrounding actors. Depending on the specific situation the effort/possibility to avoid or mitigate an accident may differ significantly between the principles actors of a pending collision, e.g. one actor (1) may easily avoid a collision while the other actor (2) may not be able to do so. The only possibility for Actor 2 to avoid a collision in such a situation is to issue a warning to Actor 1, so that he/she may take evasive actions. Connecting the horn and the headlight to already existing sensor system, for automatic warning activation, is a cost effective means to provide such a warning. One of the aims of this project is to evaluate the effectiveness of such a warning, by implementing the warning signals in the driving simulator. And thereby also validate if the communication between the actors is experienced as intended. The other aim is to study effects of hearing loss on driving performance and on the experiences of the warning system. This is of special interest since there are no demands of hearing ability for driving passenger cars and therefore warning and support systems should be available also for drivers with hearing loss.
The field of transportation and hearing loss has received relatively little attention in the literature and the level of knowledge is thus rather low. Hearing loss is not an impediment for obtaining a driving license for passenger cars since individuals with hearing loss are not considered as an increased traffic safety risk (Englund, 2001). For commercial driving the demand of hearing ability, with or without hearing devices, is to hear normal speech from a distance of four meters (Widman, 2008). However, field studies revealed that hearing loss in older drivers is associated with poorer driving performance in the presence of visual or auditory distractors (Hickson et al., 2010).
According to HRF (Swedish Hard of Hearing Society) (HRF, 2009), there are approximately 1.3 million adults in Sweden (17%) with a hearing loss. This number is increasing, due to both longer life and more noise in the environments. The prevalence increases for all ages, although the most common category of hearing loss is presbycusis, which is related to age (HRF, 2009). The older part of the population is increasing and the number of road users with hearing loss will thus also increase. The use of innovative driver support systems in vehicles (e.g., collision warning, parking aid, and lane keeping systems) is increasing rapidly and the systems are becoming more and more advanced. Due to an increased availability of systems for infotainment (e.g., navigation system, mobile phone), there is an increased risk of distracting the driver from the driving task. Existing driver support systems frequently utilize auditory information and may thus exclude drivers with hearing loss.
2 EXPERIMENT
This experiment includes the reproduction of the sound of the horn and activation off the high beam of the oncoming vehicle. To ensure a realistic sensation field test and measures were performed to collect sound and light information for implementation of the warning signals in
2.1 Light
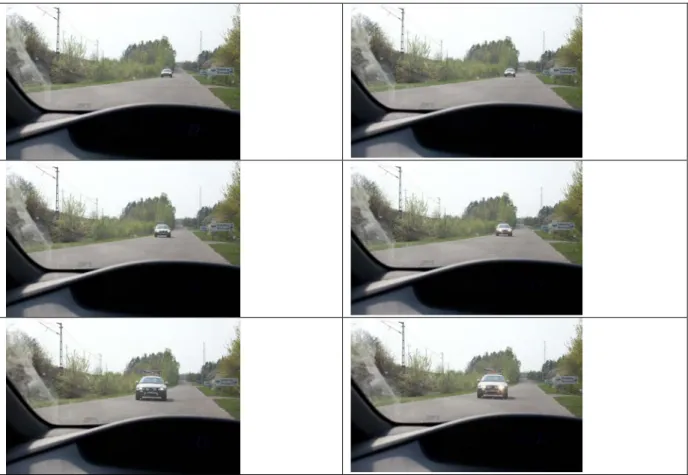
Photos were taken and luminance levels measured in a cloudy day to meet light conditions of daylight in the simulator. This was performed on both full and half beam every tenth meter from 100 meters distance, see Figure 1. Luminance measures showed no difference between full and half beam due to the bright background light (53000 lux). Thus implementation of
Figure 1: Photos of full and half beam taken each tenth meter are displayed for 60, 40 and 20 meters respectively.
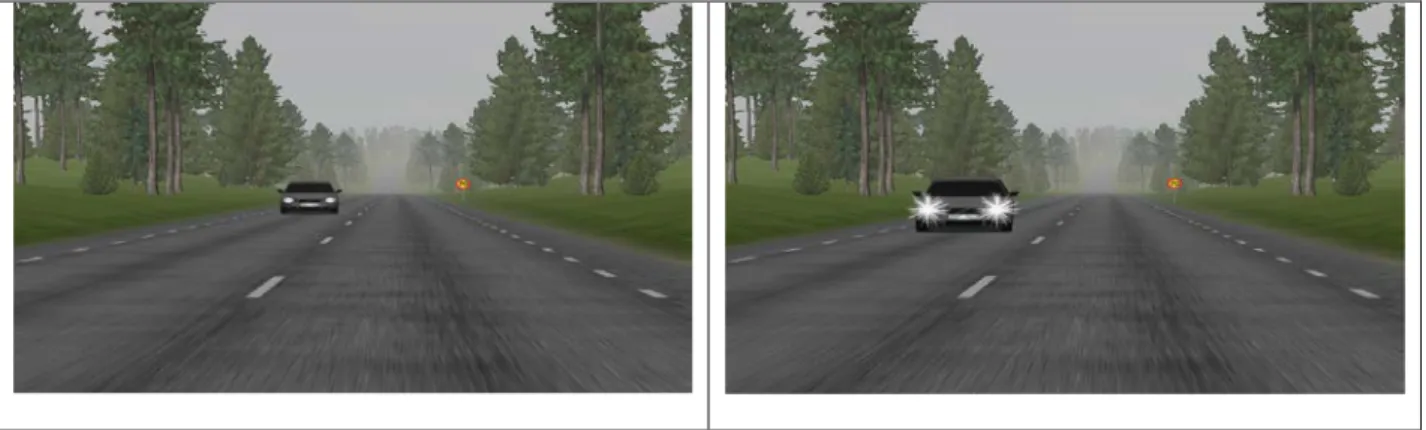
light had to rely on the photos. To make the full beam more distinct the size of the light beam was enlarged. The blinks were accomplished by activating and deactivating the full beam of the encountering vehicle. At critical events there was a pulsed warning signal of 0,3 seconds full beam presented 5 times with pauses of 0,04 seconds between. At non-critical events there were two blinks of 0,15 seconds with 0,10 seconds between. Additionally a line of led lights at the roof of the simulator cabin was lit simultaneously with the full beam. The simulated effect of high beam is shown in Figure 2.
Figure 2: Simulation of headlight warning as it appears in the experiment.
2.2 Sound
The horn signal from a Volvo V70 was recorded in field condition at a distance of 1,7 meters with a Svantek 955 Class 1 with a signal to noise ratio of 55 dB(A). The recording was adjusted according to an airborne sound transmission in a SAAB 9-3 cabin. At critical events there was a pulsed sound warning signal analogous to the light warning. Horn signals of 0,3 seconds were presented 5 times with pauses of 0,05 seconds. These signals were increasing in intensity as the principle other vehicle came closer. At non-critical events to signals of 0,1 second with a pause of 0,15 seconds were presented.
2.3 Method
A within subject design with four experimental warning conditions were used to evaluate the modality of the warning signals. The number of test participants was 48, 25 men and 23 women with a mean age of 62 years (SD = 7,5). The participants drove the Subject Vehicle (SV) and experienced the critical event 5 times with different warning signals; No warning, Light, Sound and Light+Sound. The warning coming from the encountering vehicle was given at TTC 2,8 seconds, where the horn and/or the lights of the POV were triggered. The warning signals were presented in balanced order. To investigate learning effects, the signal presented at the first event was repeated at the fifth event.
Non critical noise and light signals from other vehicles were presented in the gaps between critical events. These signals represent a greeting or a wish to make the driver aware of the headlight. Compared to the pulsed critical signals, these are shorter and meant to be experienced as friendly. The purpose of the non-critical signals is to evaluate if the driver understands the difference between the critical and the non-critical.
The driving scenario was a rural road (70 km/h speed limit) where the driver was distracted by a visual distraction task. The participants were instructed to drive as he or she usually does and to put a lot of effort into the secondary task. This consisted of reading and remembering
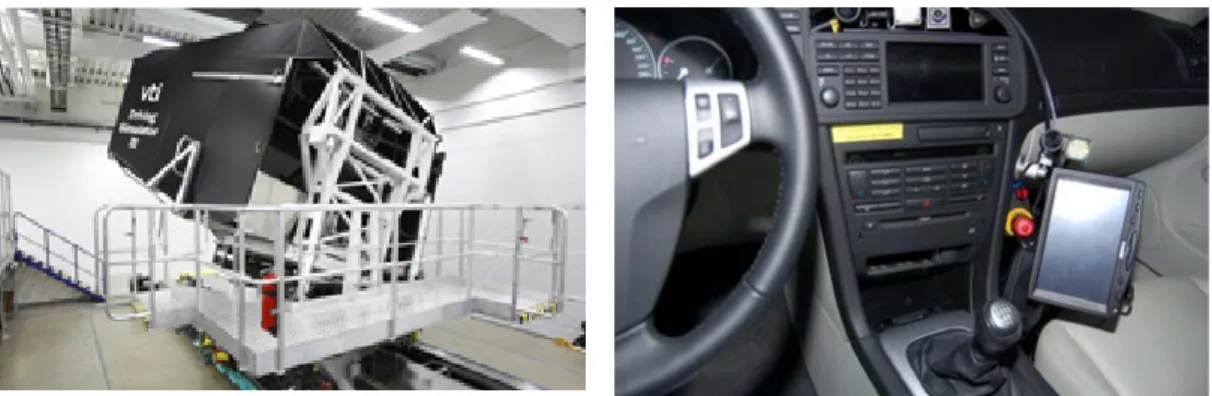
The study used VTI’s driving simulator III, see Figure 3. This is equipped with a Saab 9-3 cabin and an advanced motion system for realistic simulation of forces felt when driving (Nordmark et al., 2004). The main projection screen has a 120 degrees field of view, and three lcd-displays simulate the rear-view mirrors.
Figure 3: VTI´s driving simulator III and the position of the visual distraction task display.
3 MEASUREMENTS AND PERFORMANCE INDICATORS
Measurements used to monitor driver behavior were measured in a time window (16 sec) before and after each critical event. These are lateral distance, time to line crossing (TLC), time to collision (TTC), steering wheel reversal rate, driver reaction time (in terms of steering wheel correction, brake pedal response and time to look up) and eyes off road (total time, number of glances and longest glance). The objective measures were also accompanied by subjective ratings during and after the test drive. These aim at evaluating the realism of the simulated event and the usefulness of the warning provided by the meeting vehicle. The questionnaire included both yes/no-questions (e.g. did you experience any warning?) and 5 point scales, where 1 was “not at all” and 5 was “very much” (e.g. how realistic did you experience the simulator?)
3.1 Analysis
A mixed linear model was used and the Factors were Participant, Warning type and Gender, while Order of warning was a covariate. There was a separate analysis of the first event due to expected learning effects and realism. The participants were expected to be more shocked by the first critical event since this is not what they have expected. This event is also more realistic since these critical situations are not that likely to happen. In the secondary task, dependent variables were Amount Correct, Amount skipped and Amount correct ignoring order which will all be numbers between 0 and 4. The questionnaire was analyzed with logistic regression.
3.2 Results
Although the instruction was to consider the secondary task as important, several participants were not comfortable looking away in the situation of an encountering vehicle. This led to 12
brake response or have looked up within one second after the warning was issued. Looking at frequencies of fast responses reveal that 34% of all warnings gave a fast response. Of these fast responses (N=63) the most (32%) where at light+sound warning.
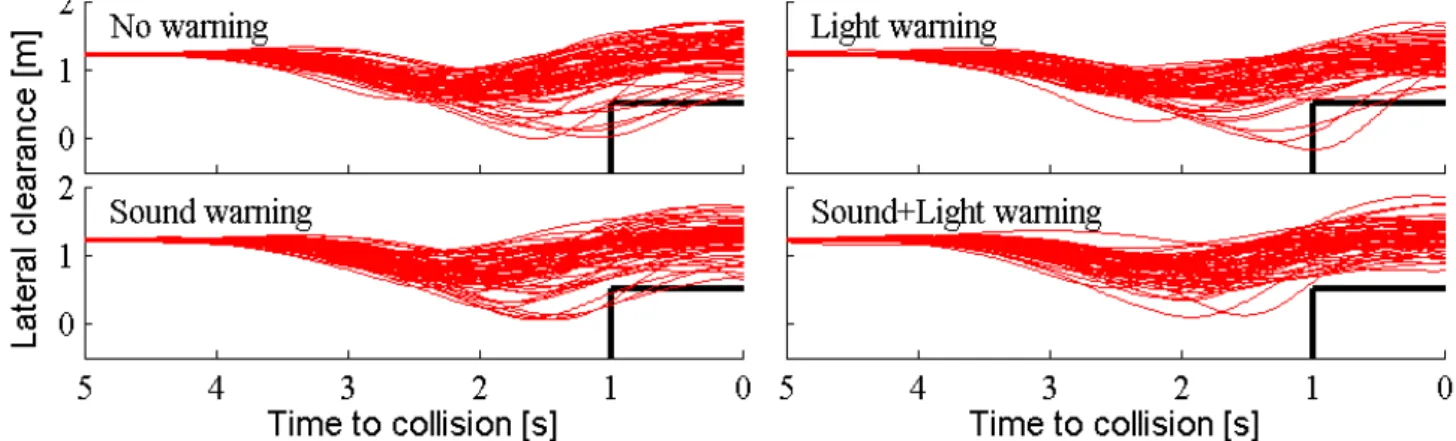
In the present study, the majority of all events did not lead to any incident or near crash situation, here defined by TTC < 1s with a lateral clearance < 0.5 m, see Figure 4. A warning was triggered at TTC = 2.8s, equivalent to a distance of about 110 m between the vehicles. At this stage, the SV is still positioned in its original lane and has a lateral velocity less than 0.5 m/s.
Figure 1: Lateral clearance and TTC for the four warning types, respectively. Trajectories that pass through the rectangular area (thick solid line) are defined as incidents (TTC < 1s and lateral clearance < 0.5 m). Five incidents were detected for 'No warning', three for 'Light warning', four for 'sound warning' and zero for combined warning.
Of all performance indicators and measures here only some who reveal significant effect of the warning are presented. This was examined by comparing the measures from a time window of 16 seconds before and after the warning respectively. The first critical event is treated separately, due to possible learning effects.
There was a decrease in the standard deviation for the lateral position for all warning types (including no warning) after the first critical event. This means that the critical event decreased the wobbling. The effect was significantly larger for light+sound warning compared to both no warning, t(34) = 2,51, p = 0,019 and light warning t(34) = 2,13, p = 0,044. Only 88% (N = 42) performed the first task, showing the unwillingness to look away although no critical event has happened so far. Mean values, standard deviations and numbers of cases for each warning modality are shown in Table 1.
Table 1: Change in standard deviation (SD) for the lateral position after first critical event
Type Mean
(m)
SD N
No warning 0,010 0,068 13
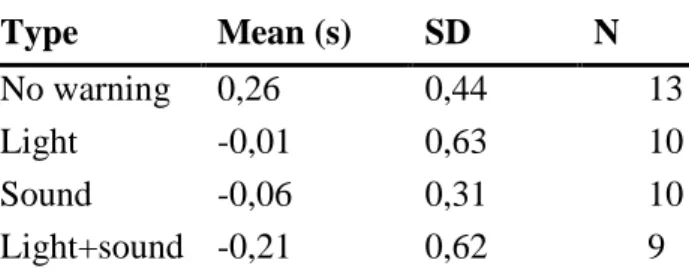
Eye tracking revealed that the Longest Glance away from the road decreased in duration as an effect of the critical situation, for all warning types except for no warning. The effect was significantly larger for light+sound than for no warning, t(34) = 1,57, p = 0,047. For mean values, see Table 2.
Table 2: Change in Longest Glance after first critical event
Type Mean (s) SD N
No warning 0,26 0,44 13
Light -0,01 0,63 10
Sound -0,06 0,31 10
Light+sound -0,21 0,62 9
The steering activity measured by SWRR increased for all warning types (including no warning) after the first critical event. The increase was larger for light+sound, however this was not significant. See Table 3.
Table 3: Change in SWRR after first critical event
Type Mean (n) SD N
No warning 1,31 3,06 13
Light 2,00 2,40 10
Sound 1,80 2,97 10
Light+sound 2,77 2,17 9
There was an increase in TLC for all warning types (including no warning) and the increase was significantly larger for light+sound than for no warning, t(34) = 1,56, p = 0,028. For mean values, see Table 4.
Table 4: Change in TLC after first critical event
Type Mean (s) SD N
No warning 0,29 0,42 13
Light -0,05 0,19 10
Sound -0,04 0,31 10
Light+sound -0,47 0,34 9
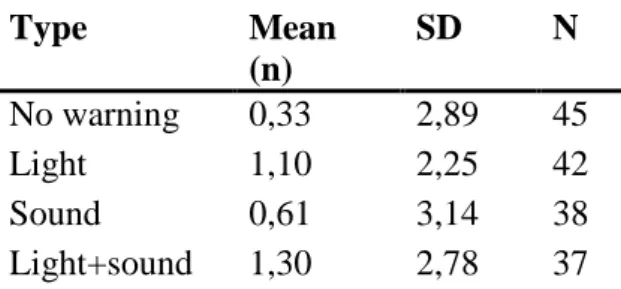
For the following critical events SWRR (Steering wheel reversal rate) increased for all warning types (including no warning). The increase was largest, however not significant, for
Table 5: Change in SWRR for event 2-5 Type Mean (n) SD N No warning 0,33 2,89 45 Light 1,10 2,25 42 Sound 0,61 3,14 38 Light+sound 1,30 2,78 37
Performance on secondary task is an alternative measure of warning effectiveness. There was a significant effect of warning type on the amount skipped letters. At each task four letters were displayed, thus maximum four letters could be skipped. The more skipped letters the more effective was the warning. Light+sound warning resulted in most skipped letters while no warning and greetings resulted in least skipped letters, see Table 6.
Table 6: Mean and SD for amount skipped on secondary task.
Mean (n) SD N No warning Light warning Sound warning Sound+Light warning Light Hello Sound Hello 1,00 1,49 1,65 1,90 0,60 1,00 1,10 1,27 1,46 1,39 0,98 1,29 61 59 60 60 48 48
A questionnaire regarding for example experienced warning modalities, usefulness and realism was filled in by the participants after the experimental drive. Almost all participants, 94% (N=45), have experienced warnings during the drive. Among those, 98% have experienced sound warnings, 87% light warnings and 71% the combination warning of sound and light. Only few, 31%, have experienced greetings. Among those, 21% have noticed light greetings, 31% have noticed sound greetings and 8% have noticed a combination of sound and light. The general realism in the simulator was rated high (M= 3,7; SD = 0,7) and men experienced the simulator as significantly more realistic(OR=17). The usefulness of warning was rated shortly above average (M=3,2; SD = 1,2).
The participants were positive to the way of announcing the secondary task thru seat vibration (M=4,60; SD=0,68). The difficulty of secondary task was rated shortly above average (M=3,3; SD = 0,8). The participants are generally positive towards the warning system and the warning modalities; 65% are positive towards auditory warning, 75% towards visual warning and 85% towards the combination warning of sound and light.
ratings of reality in the simulator making the participants uncomfortable with performing the task.
The level of criticality of the event was a major design issue for this experiment. Since the participants where to experience several events, having a collision was not desirable. No collisions occurred during the test. There were relatively few significant results among the performance indicators and measures, indicating that the critical event possibly could have been made more critical. However this could also lead to even more participants skipping in the secondary task.
In the beginning of the project running the test in low light conditions (dusk or night) was considered. This would have required a different simulator set-up (with an external light source, e.g. as was used in (Bolling et al., 2010), and presumably the effects of the warning under such circumstances would have been larger.
Among all warnings at critical events, 34% were useful according to the definition of leading to a fast response (< 1s). The first critical event is regarded as the most interesting and also most relevant, since the participants are totally unprepared of the situation. This is also were most significant results appeared. Although not overwhelmingly many, they are consistent. The combination of sound and light warning significantly decrease both wobbling and glances off the road and significantly increases time to line crossing. There is also a tendency of increase for steering activity.
When evaluating the possible effect of different warnings, it is important to create events that are critical enough. It would have been desirable to have more incidents. On the positive side, the combined sound and light warning eliminated all incidents. However, since few incidents were detected in the 'No warning' case, these results indicate that the warning has a positive effect. More critical events need to be created and evaluated to draw strong conclusions.
Detecting that the vehicles are on collision course before the SV enters the POV's lane (lateral clearance about 0.6 m) is highly challenging for the sensor system, which may, e.g., be camera and radar based. Furthermore, providing warnings to vehicles that still did not enter the POV's lane, and possible never enter the lane, may be disturbing for the driver of the SV. Realistic suitable sensor system may be able to detect if the SV enters the POV's lane at distances of up to 80 – 120 m, in this study equivalent to 2 – 3s TTC. Camera based sensor systems may be able to do so by detecting the lane markings and detecting if any part of the SV is placed inside the POV's lane. Such actions by the driver of SV may also motivate a warning, hence reducing the risk of triggering disturbing warnings during normal traffic conditions.
Greetings are experienced as less critical than warnings indicating that this new use of horn and headlight would not affect reactions to non-critical warnings or greetings. Participants are generally positive towards this warning system and most positive toward a combined sound and light warning.
A consistent significant main effect of warning modality emerged from the results of the secondary task. When performance on task is low, the driver’s attention has effectively been drawn from the secondary task. This indicates that some warning modalities are more effective in alerting the driver. The greetings have the highest scores, which again points to a distinction between these two signals (warning and greeting).
4 CONCLUSIONS
The results of this study indicate that light and sound warnings, issued in a critical head-on collision situation, are useful to the driver, and have an effect that increase safety. This type of countermeasure is the only feasible solution to avoid an accident in certain situation e.g. when the own vehicle is standing still and being struck by an oncoming vehicle. Correct
autonomous activation of the signals is dependent on the capabilities of the vehicles proximity sensors and data processing. The effect may also degrade at higher relative velocities because of the increased distance at which a warning needs to be issued. Both horn and head light warnings have been shown to have an effect in critical situations, with a combination of these two leading to more fast responses than horn or light warning alone. Participants were
positive towards having automated warnings from encountering vehicles in critical situations.
REFERENCES
Bolling, A., Sörensen, G., Jansson J (2010). Simulating the Effect of Low Lying Sun and Worn
Windscreens in a Driving Simulator. In proceedings of Driving Simulator Conference 2010,
Paris.
Englund, L. (Ed.). (2001). Medicinska förhållanden av betydelse för innehav av körkort -
Hörsel och balanssinne: Vägverket, Trafikmedicinska rådet.
Hickson, L., Wood, J., Chaparro, A., Lacherez, P., & Marszalek, R. (2010). Hearing
Impairment Affects Older People's Ability to Drive in the Presence of Distracters. Journal of
the American Geriatrics Society, 58(6), 1097-1103. doi: 10.1111/j.1532-5415.2010.02880.x HRF. (2009). HRF Rapport. HRF Report. Stockholm: Hörselskadades Riksförbund. The Swedish Hard of Hearing Society. .
Nordmark, S., Jansson, H., Palmkvist, G., & Sehammar, H. (2004). The new VTI Driving
Simulator - Multi Purpose Moving Base with High Performance Linear Motion. In
proceedings of Driving Simulator Conference 2004, Paris.
Widman, L. (2008). Medicinska körkortskrav vid Neurologiska och Psykiska sjukdomar,
Medical Requirements for Driving License at Neurological and Psychological Diseases In
Transportstyrelsen (Ed.), Vägverkets ändrade föreskrifter om medicinska krav, Changes in Swedish National Road Administration Directions for Medical Requirements. VVFS 2008:158.